Introduction to diffraction and the Rietveld method Luca Lutterotti Corso: Laboratorio Scienza e Tecnologia dei MAteriali
[email protected]
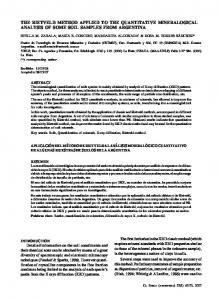
Goal of the Rietveld method To minimize the residual function using a non-linear least squares algorithm 2 1 WSS = ∑ w i ( Iiexp − Iicalc ) ,w i = i
Iiexp
and thus refine the crystal structure of a compound (cell parameters, atomic positions and Debye-Waller factors) €
500
Intensity1/2 [a.u.]
400 300 200 100 0 -100
20
40
60
2θ [degrees]
80
100
120
Bragg law Constructive interference and interplanar spacing:
Bragg law and intensities Considering the diffraction from the (001) plane
!$#
!"#
!"#
!$#
%&'()*'+"()',*-.()'$*(/**-'0"12'3' "-4'5'46&&*02'$1'λ7'()*'+"()',*-.()' $*(/**-'0"12'3'"-4'8'/6,,'46&&*0'$1' λ95'"-4'4*2(0:;(6"#%#$/+(&!*'(%$",?#$%.*7"!.3$)*//#0#(!$/'04%$-+!$,0#$4,!"#4,!*&,..3$*)#(!*&,.=$@$!"*0)$ '6!*'($*%$!'$,66.3$('$;'0#(!"*%$*%$+%#/+.$*/$!"#$6'5)#0$60'/*.#$),!,$5,%$&'00#&!#)$/'0$!"#%#$#//#&!%$-#/'0#$*(6+!$!'$ of peaks is determined by the symmetry and space group of theGSAS=$A)*!*(7$'/$!"#$;'0#(! large sampling volume, large beam, with not too low divergence => a medium to low resolution diffractometer structural refinements of low symmetries compounds (monoclinic, triclinic) require often a high resolution diffractometer A low and linear background is the first requirement No additional lines (beta lines) are also in general preferred Large collectable ranges are important High diffraction intensities should be achieved Smaller peak broadening help the analysis reducing overlaps Simple geometries are better for subsequent Rietveld fitting There is not the perfect instrument to get everything
Powder diffraction and Debye-Scherrer camera
A modern diffractomer
Parafocusing circle (Bragg-Brentano)
Diffractometer circle
X-ray source
Focusing circle
Receiving slit Incident beam slit
Sample
Theta-theta diffractometer
Slits system in Bragg-Brentano
scatter slit
antiscatter slit sample
detector
tube target
soller slits receiving slit
soller slits divergenge slit
High resolution instruments These instruments put the emphasis on the smaller line width obtainable: Pro: less overlapped peaks (more details for structural refinements) higher accuracy for microstructural analyses better separation for multiple phases smaller sampling volumes higher cell determination accuracy Cons: smaller sampling volumes low divergence (less grain statistic) => less accuracy in intensity smaller intensities => higher collection times more difficult to fit more sensible to models Good for structural refinements when high precision is requested
Low resolution instruments Pro: higher intensities better statistics (higher sampling volumes, more grains diffracting) faster collection times easier to fit Cons: less details for complicated structures or samples less precision (not always less accuracy) not suitable for low symmetries compounds or determination of size-strain for highly crystallized samples These instruments are good for normal quantitative and qualitative analyses or when good statistic of grains is required (texture etc.).
A good overall instrument For quantitative analysis: medium resolution monochromator on the diffracted beam Cu radiation ? Structural refinements or structure determination high resolution (and high intensities => very long collection times) monochromator no Kα2 (structure determination) Microstructural analyses high resolution Texture and residual stress analyses medium to low resolution fast collection times extremely good statistic
Instrument assessment In most cases (or always) the instrument alignment and setting is more important than the instrument itself Be paranoid on alignment, the beam should pass through the unique rotation center and hits the detector at zero 2θ The background should be linear, no strange bumps, no additional lines and as low as possible Check the omega zero Collect regularly a standard for line positions and check if the positions are good both at low and high diffraction angle (check also the rest)
The data collection The range should always the widest possible compatible with the instrument and collection time (no need to waste time if no reliable informations are coming from a certain range)
How much informations from > 90º for the pattern on the right?
The step size The step size should be compatible with the line broadening characteristics and type of analysis. In general 5-7 points in the half upper part of a peak are sufficient to define its shape. Slightly more points are preferred in case of severe overlapping. A little more for size-strain analysis. Too much points (too small step size) do not increase our resolution, accuracy or precision, but just increase the noise at equal total collection time. The best solution is to use the higher step size possible that do not compromise the information we need. Normally highly broadened peaks => big step size => less noise as we can increase the collection time per step (> 0.05) very sharp peaks => small step size (from 0.02 to 0.05 for BraggBrentano)
Total collection time Ensure the noise is lower than the intensity of small peaks. If the total collection time is limited, better a lower noise than a smaller step size. Better to collect a little bit more than to have to repeat an experiment. If collection time is a problem go for line or 2D detectors: CPS 120: 2 to 5 minutes for a good spectrum of 120 degrees (good for quantitative analyses or follow reactions, transformations, analyses in temperature) Image plate or CCDs: very fast collection times when texture is needed or is a problem Data quality (not related to intensity) of these detectors is a little bit lower than the one from good point detectors. But sometimes intensity rules!
Sample characteristics (1) The sample should be sufficiently large that the beam will be always entirely inside its volume/surface (for Bragg-Brentano check at low angle and sample thickness/transparency). Zeolite sample, changing beam divergence, Krüger and Fischer, J. Appl. Cryst., 37, 472, 2004.
On the right pattern, at low angle the beam goes out of the sample reducing relative peaks intensities and increasing air scattering/ background
Sample characteristics (2)
Sample position is critical for good cell parameters (along with perfect alignment of the instrument). The number of diffracting grains at each position should be significant (> 1000 grains). Remember that only a fraction is in condition for the diffraction. Higher beam divergence or size increases this number. So the sample should have millions grains in the diffracting volume.
Grain statistics (sufficient)
Grain statistics (poor)
Sample characteristics The sample should be sufficiently large that the beam will be entirely inside its volume/surface (always) Sample position is critical for good cell parameters (along with perfect alignment of the instrument) The number of diffracting grains at each position should be significant (> 1000 grains). Remember that only a fraction is in condition for the diffraction. Higher beam divergence or size increases this number. Unless a texture analysis is the goal, no preferred orientations should be present. Change sample preparation if necessary. The sample should be homogeneous. Be aware of absorption contrast problems In Bragg-Brentano geometry the thickness should be infinite respect to the absorption. Quality of the surface matters.
Ambient conditions In some cases constant ambient condition are important: temperature for cell parameter determination or phase transitions humidity for some organic compounds or pharmaceuticals can your sample be damaged or modify by irradiation (normally Copper or not too highly energetic radiations are not)
There are special attachments to control the ambient for sensitive compounds
Non classical Rietveld applications Along with the refinement of crystal structures the concept of the Rietveld method has been extended to other diffraction analyses. Most of them more useful for people working on material science. These are: Quantitative phase analyses Amorphous quantification Microstructural analyses Texture and Residual stresses
Expert tricks/suggestion First get a good experiment/spectrum Know your sample as much as possible Do not refine too many parameters Always try first to manually fit the spectrum as much as possible Never stop at the first result Look carefully and constantly to the visual fit/plot and residuals during refinement process (no “blind” refinement) Zoom in the plot and look at the residuals. Try to understand what is causing a bad fit. Do not plot absolute intensities; plot at iso-statistical errors. Small peaks are important like big peaks. Use all the indices and check parameter errors. First get a good experiment/spectrum