understand… the whole system… Intervening is a way of causing trouble.”*. *
Lewis Thomas (biologist and essayist) quoted in Business Dynamics J Sterman ...
Introduction to Engineering
Systems, ESD.00
System Dynamics - I
Lecture 2 Dr. Afreen Siddiqi
• “You cannot meddle with one part of a complex system from
the outside without the almost certain risk of setting off off
disastrous events that you hadn’t counted on in other, remote parts. If you want to fix something you are first obliged to understand… the whole system… Intervening is a way of causing trouble.”*
*Lewis Lewis Thomas (biologist and essayist), essayist) quoted in Business Dynamics, Dynamics J. J Sterman, Sterman 2000
Systems Thinking
• Our world is complex and its elements are inter‐related. • We need to understand that “we can’t do just one thing” – things are interconnected and our actions have numerous effects that we often do not anti ticiipatte or realilize. • Many times our policies and efforts aimed towards some objective fail to produce the desired outcomes, outcomes rather we often make matters worse – For instance:
• Systems Thinking involves holistic consideration of our actions – it is needed to deal with the complexity of our world
What is System Dynamics?
• System Dynamics is a method that helps us learn and understand complex systems • It is fundamentally interdisciplinary and brings together tools and theories from a wide variety of traditional disciplines. • At its core, its foundations are on nonlinear dynamics and mathematical feedback control theory, and it draws from economics, social psychology and other sciences. • We use system dynamics to construct models of socio‐technical systems, and use computer simulation to determine how these systems may behave in the real‐ world
Law of Unintended Consequences
• Murphy’s Law
• “Counter Intuitive Behavior of Social Systems”
• Unexpected dynamics often lead to ‘policy resistance, i.e. the tendency f iinterventions for i to be b delayed, d l d diluted, dil d or d defeated f db by the h response off the system to the intervention itself’
• Our actions to solve some problem tend to make the problem worse or create new problems in its place (can you think of examples?)
Causes of Policy Resistance: The Serial View Eventt-oriented i t d view i off the th world ld Goals Problem
Decision
Results
Situation Image by MIT OpenCourseWare.
Ref: Figure 1-3, J. Sterman, Business Dynamics: Systems
Thinking and Modeling for a complex world world, McGraw Hill, Hill 2000 2000
We typically tend to think of things as chains of cause and effect and often ignore the time delays between them
The Feedback View
Decisions
In reality, there is feedback – the results of our present actions define our future situation
Goals
Environment Image by MIT OpenCourseWare.
Examples of feedback
Ref: Figure 1-4, J. Sterman, Business Dynamics: Systems Thinking and Modeling for a complex world, McGraw Hill, 000 2000
comparison Desired State
Control� Control Element
System�(or� System (or controlled� controlled Process)
Feedback signal
Actual State
The Feedback View
Decisions
Policy Policy resistance is often due to incomplete understanding and accounting of full range of feedbacks
Goals Side effects
Environment
Consider the pesticide problem… We will spend a lot of time thinking identifying and thinking, modeling these feedbacks in our system dynamics work
Goals of other agents
Actions of others
Image by MIT OpenCourseWare.
Ref: Figure 1-4, J. Sterman, Business Dynamics: Systems Thinking and Modeling for a complex world, McGraw Hill, 2000
Mental Models
Mental models are widely discussed in psychology and philosophy
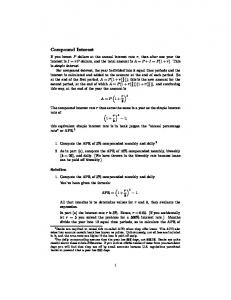
Current Supply Chain Cycle Time: 182 days Goal: 50% Reduction 182 Days
Concept of mental models is central in System Dynamics Forrester stresses that all decisions are based on models, usually mental models. models In System Dynamics, ‘mental models’ are our beliefs of networks of causes and effects that describe how a system operates – it is our framing or articulation of the problem
75 Days
22 Days
85 Days
Manufacturing lead time
Order fulfillment lead time
Customer acceptance lead time
Image by MIT OpenCourseWare.
Ref: Figure 1-10, J. Sterman, Business Dynamics: Systems Thinking and Modeling for a complex world, McGraw Hill, 2000
Double‐Loop Double Loop Learning
Syystems Thinkingg comes with replacing a narrow, static, short‐run view with a broad, dynamic and long‐term view of our systems and policies
Real world
Decisions
Strategy, structure, decision rules
Information feedback
Mental models of real world
Image by MIT OpenCourseWare.
Ref: Figure 1-11, J. Sterman, Business Dynamics: Systems Thinking and Modeling for a complex world, McGraw Hill, 2000
Bounded Rationality
“The capacity of the human mind for formulating and solving
complex problems is very small compared to the size of the
problem whose solution is required for objectively rational
behavior in the real world or even for a reasonable approximation to such objective reality”. (Herbert Simon,
1957)
Simulation
• Creating and simulating a model lets you make your mental model explicit, and then helps you see how your defined system structure will behave in time. • Formalizing qualitative models and testing via simulation often leads to radical changes in the way we understand reality. • Discrepancies between formal and mental models stimulate improvements in both, including changes in basic assumptions, time horizon and dyynamic hypothesis. yp
The Modeling Process
1. 2.
3. 4.
5.
What is the problem, what are the key variables, what is the time horizon? What are the current theories of the problematic behavior? Create causal maps.
Create a simulation model by specifying structure and decision rules. Check if model reproduces the problematic behavior behavior, check extreme extreme
conditions.
What future conditions may arise? What will be the effect of a policyy or strategy?
1. Problem articulation (boundary selection)
5. Policy formulation & evaluation
4. Testing
2. Dynamic hypothesis
3. Formulation
Image by MIT OpenCourseWare.
Ref: Figure 3-1, J. Sterman, Business Dynamics: Systems Thinking and Modeling for a complex world, McGraw Hill, 2000
Formulating a Hypothesis
• “A dynamic hypothesis is a working theory of how the problem arose” • System dynamics seeks endogenous explanations for phenomena. An endoggenous theoryy generates g the dyynamics of the syystem througgh the interaction of variables and agents represented in the model. chart, a list of endogenous endogenous, exogenous, exogenous and • Create a model boundary chart excluded variables that define the scope of the model
Causal Loop Diagrams (CLD)
• CLDs are maps that show links between variables with arrows that signify cause and effect. • They help in eliciting and capturing mental models
+ Eggs
R
Chickens
+
A system's feedback structure
Generates its dynamics
• CLDs describe the hypothesis about the causes of the dynamics
Chickens Eggs
Time
Ref: Figure 1-5a, J. Sterman, Business Dynamics: Systems Thinking and Modeling for a complex world world, McGraw Hill, Hill 2000
Image by MIT OpenCourseWare.
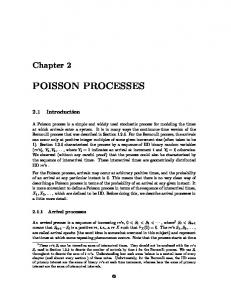
Diagram Notations
Ref: Fig gure 5-1,, J. Sterman,,Business D ynamics: Sy ystems Thinking and Modeling for a complex world, McGraw Hill, 2000
Variables are: Birth rate, population, death rate, fractional birth rate, average lifetime
+ Birth rate
Variables are connected by y ‘causal links’ (arrows) with assigned polarities
+
R
Population
Death rate
B
+
+
Fractional birth rate
-
Average lifetime Key
Causal link
Polarities indicate how the independent variable affects the dependent variable Loop identifiers indicate direction of circulation and type (balancing g) or reinforcing)
Link polarity + Birth rate variable
Population variable
+
or
R
Loop identifier: Positive (reinforcing) loop
-
or
B
Loop identifier: Negative (balancing) loop Image by MIT OpenCourseWare.
Link Polarity Symbol
+ X
X
Y
-
Y
Ref: Table 5-1, J. Sterman, Business Dynamics: Systems Thinking and Modeling for a complex world, McGraw Hill, 2000
Interpretation
Mathematics
All else equal, if X increases (decreases), then Y increases (decreases) above what it would have been.
∂Y/∂X>0 In the case of accumulations,
+ Product quality Effort
t0
Births
Y = ∫ (X+....)ds+ Yt0
All else equal, if X increases (decreases), then Y decreases (increases) below what it would have been.
∂Y/∂X