ISSE: An Interactive Source Separation Editor Nicholas J. Bryan1 , Gautham J. Mysore2 , Ge Wang1 2 1 CCRMA, Stanford University Adobe Research Stanford, CA, USA San Francisco, CA, USA {njb, ge}@ccrma.stanford.edu
[email protected]
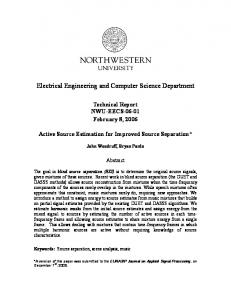
Figure 1. (First) A time-frequency display of sound depicting recorded speech mixed with a cell phone (horizontal lines) ringing in the background. (Second) Using ISSE, a user can separate distinct sound sources by roughly painting on time-frequency displays. Color is used to denote sound source and opacity is used as a confidence level. (Third) Once separated, fine-tuning is performed by painting on intermediate separation estimates or further painting on the input. Painting on one output track at a particular point pushes the sound into the other track(s) in an intelligent way. (Fourth) The final separated output recordings.
ABSTRACT
Traditional audio editing tools do not facilitate the task of sep arating a single mixture recording (e.g. pop song) into its re spective sources (e.g. drums, vocal, etc.). Such ability, how ever, would be very useful for a wide variety of audio appli cations such as music remixing, audio denoising, and audiobased forensics. To address this issue, we present ISSE–an interactive source separation editor. ISSE is a new opensource, freely available, and cross-platform audio editing tool that enables a user to perform source separation by painting on time-frequency visualizations of sound, resulting in an in teractive machine learning system. The system brings to life our previously proposed interaction paradigm and separation algorithm that learns from user-feedback to perform separa tion. For evaluation, we conducted user studies and compared results between inexperienced and expert users. For a variety of real-world tasks, we found that inexperienced users can achieve good separation quality with minimal instruction and expert users can achieve state-of-the-art separation quality. Author Keywords
Source separation; interactive machine learning; intelligent user interface; audio interface. ACM Classification Keywords
H.5.5 Sound and music computing: Methodologies and tech niques, signal analysis, synthesis, and processing, systems; I.5.4 Applications: Signal processing; I.5.5 Implementation: Interactive systems Permission to make digital or hard copies of all or part of this work for personal or classroom use is granted without fee provided that copies are not made or distributed for profit or commercial advantage and that copies bear this notice and the full citation on the first page. Copyrights for components of this work owned by others than ACM must be honored. Abstracting with credit is permitted. To copy otherwise, or republish, to post on servers or to redistribute to lists, requires prior specific permission and/or a fee. Request permissions from
[email protected]. CHI’14, April 26–May 1, 2014, Toronto, Canada.
Copyright is held by the owner/author(s). Publication rights licensed to ACM.
ACM 978-1-4503-2473-1/14/04$15.00.
http://dx.doi.org/10.1145/2556288.2557253
INTRODUCTION
Over the last several decades, audio editing, processing, and production has been revolutionized by digital editing soft ware and the drastic decrease in the cost of modern record ing equipment. In conjunction with digital audio effects such as compression, frequency equalization, pitch-shifting, timestretching, and reverberation, this technology has greatly improved a user’s ability to edit, process, and manipulate recorded sound. This increased ability has had far reaching consequences towards the aesthetic and artistic nature of mu sic creation and is the underlying motivation of this work. One of the single greatest advancements arose from the advent of the graphical user interface and interactive dis plays of sound. Typically, interactive displays visualize the time-domain waveform of a sound because it is simple and straightforward to implement from the perspective of the soft ware engineer. When more informative displays are required, time-frequency visualizations can be used as shown in Fig. 1. Such displays allow users to easily visualize, zoom, scroll, playback, and select regions of a recording all within a highly interactive feedback loop. This high degree of interactivity promotes and nourishes content creation in ways previously impossible, particularly in regard to the notion of selection. Selection or the ability to carefully choose a specific object (e.g. a snare drum) within a collection or sequence of objects (e.g. drum set recording) is central to a user’s ability to ma nipulate, process, and control recorded sound. Once audio objects are selected, any number of actions can be performed such as copying, pasting, or deleting. Traditional audio editing software, however, typically does not allow a user to independently edit multiple sound sources (e.g. drums, vocals, etc.) that occur simultaneously within a single recording (e.g. pop song). To perform this task, the single mixture recording must be separated into its respective sources. This process is referred to as single-channel source
separation and is useful for wide variety of music- and audiorelated tasks. These tasks include music remixing, where a user might want to extract only the vocals from one song and play it with the instrumental track of another; and audio denoising and forensics, where a user might want to remove background noise from recorded speech. In general, how ever, source separation is a technically very challenging prob lem, given the superposition property of sound as well as the large amplitude, time, and frequency variations of individual sources. To meet this challenge, a significant research effort has com menced over the past several decades to develop new algo rithms and methodologies for single-channel source separa tion. One approach in more recent editing tools is to allow se lection capabilities on time-frequency displays of sound such Ircam’s AudioSculpt [3], Melodyne, Adobe Audition, Audio Brush [4], Izotope’s RX, and Sony’s Spectral Layers. In some cases, these tools allow good-quality automatic separation, but, in many cases, tedious manual selection is required. This selection needs to be precise and requires significant work on behalf of the end-user, limiting the separation quality. Alternatively, one of the most promising approaches for source separation found in the research community is that of non-negative matrix factorization (NMF) [21, 31, 39, 12] and its probabilistic latent variable model counterparts (PLCA) [26, 33]. These methods learn individual sound models from spectrogram data or equivalently the short-time Fourier trans form (STFT) magnitude of an audio signal. A given model consists of a set of prototypical frequency components, which are inferred from data and used to explain and separate an un known mixture sound. In many cases, NMF/PLCA-based methods can achieve highquality separation results when isolated, training recordings are used to learn the individual sound models [34]. They also offer several key benefits compared to alternative methods in cluding the ability to “learn” from data and the ability to ex plicitly model sound as a mixture. These techniques, how ever, perform poorly when no isolated training data is given and do not allow users to correct for unsatisfactory results. In our recent work [5, 6], we proposed a combination of both manual and NMF/PLCA-based methods. The method oper ates by allowing a user to separate a single- or stereo-channel audio recording into its respective sources by roughly paint ing on time-frequency visualizations of sound as shown in Fig. 1. The technique incorporates painting annotations into NMF/PLCA-based techniques in a way that small, roughlyplaced annotations can globally improve separation quality. The method is also extendable in that it can operate with the use of isolated training data [6] or without [5]. Between these works, however, only minimal evaluation was performed and only a minimally functional proprietary Matlab interface was developed, significantly limiting the achievable separation quality, the usefulness of the method, and further study on interactive source separation. Also note, these works are related to our more recent work of using user-feedback for pitch-based separation [7], which uses a different more lim
ited algorithm (88 pre-defined sound sources) and modified interaction (time-domain displays). As a result, we build upon this prior work and proposed a new interactive software system called ISSE–an interactive source separation editor. ISSE is a free, open-source project that em bodies our past work within a carefully designed real-life sys tem. We outline our newly developed software system, dis cuss and frame the topic of source separation in the context of human-computer interaction (HCI) and interactive machine learning (IML), examine the interaction paradigm and inter active analogies, outline the employed separation algorithm, and then discuss user studies and further expert evaluation. Collectively, we hope that this more clearly demonstrates the usefulness of incorporating HCI ideas into multimedia pro cessing problems such as source separation, where the use of user-feedback can be extremely beneficial.
RELATED WORK
In addition to the audio editing tools listed above, there are several related prior works on the topic of user-guided source separation. In the work of Smaragdis and Mysore [30, 32], a user is employed to sing or hum an input query signal. Both the frequency content and timing information of the query signal are then used to select or separate a single source from a mixture. In the work of Ozerov et al. [24, 25], userannotated time activations from an input mixture recording are used to inform a separation algorithm. In Durrieu et al. [9], a user is asked to annotate the fundamental frequency on a pitch-based display to perform vocal (or related) separation. In the work of Lefe` vre et al. [22], a user is asked to annotate binary time-frequency patches, which are used with the inten tion of training an automatic, user-free system. While promising, these methods still leave room for improve ment for several reasons. Most notably, general-purpose, high-quality separation is always an issue for all methods, in cluding the proposed approach. Single-channel source sepa ration is an underdetermined mathematical problem and does not have a single, straightforward, optimal solution. As a re sult, nearly all algorithms are customized for various appli cations and can break down when applied to unforeseen sit uations. To mitigate this problem, we believe it is beneficial to embrace this fact and incorporate an ability for a user to correct for mistakes in the separation output. In other words, past user-guided approaches do not lever age end-users to their full potential. In particular, they do not stress iterative, user-feedback between the separation al gorithm and the end-user to improve separation quality over time. This is something that we are acutely interested in and believe is immensely beneficial. Our interest and belief in user-feedback stems from the emerging intersection between HCI and machine learning (ML) or interactive machine learning (IML), and its recent success across various domains. Early works citing success of IML include Fails and Olsen [11], who leverage userfeedback for image classification; and Cohn et al. [8], who use IML for document clustering and scientific discovery.
More recent works that are also encouraging include Stumpf et al. [36], who discuss the idea of IML in a broad ML context; Talbot et al. [37], who use an interactive visualiza tion tool for training multiple classifiers; Fogarty et al. [14], who leverage IML for image search; Fiebrink [13], who uses IML for musical instrument design; Settles [28], who lever ages IML for natural language processing tasks in conjunc tion with active learning; and Amershi et al., who leverage IML for aiding network alarm triage [1]. Given this prior work, we now outline our proposed software system. OVERVIEW
ISSE is a free, open-source interactive source separation editor that embodies our previously proposed interaction paradigm and algorithms for single-channel separation [5, 6]. The proposed software system allows a user to separate a sin gle recording of a mixture of sounds into two sources using drawing and painting-like tools and is useful for a wide vari ety of music- and audio-related tasks. The primary design goals of the project are to 1) provide a professional-level audio editing tool for recording engineers, musicians, and similar users to perform source separation for applications such as music remixing and audio denoising 2) employ drawing and painting-like tools to control the sepa ration process in an intuitive, precise, and deliberate manner 3) emphasize the use of interactive user-feedback to improve separation quality over time in an effort to remove the burden placed on the separation algorithm to be perfect the first time 4) achieve high-quality separation results, even if a signifi cant effort is required on behalf of the user and 5) evaluate the work with inexperienced and expert users alike. INTERACTION
To separate a single-channel recording with ISSE, a user is allowed to annotate or paint on a time-frequency or spectro gram display of a mixture sound as shown in Fig. 1 (second). As opposed to exactly annotating each pixel of the image, however, a user is instructed to roughly paint on salient, time, frequency, or time-frequency regions that appear to corre spond to one sound or another, following past work [5, 6]. Color is used to denote sound source (e.g. vocals, guitar, etc.) and opacity is used as a measure of confidence or strength, allowing a degree of robustness to imprecise annotations. Given the annotations, our system then performs an initial separation and allows the user to listen to the separated out puts as shown in Fig. 1 (third). If the results are unsatisfac tory, the user can then annotate errors in the output estimates or further annotate the input, and iteratively re-run the process in a quick, interactive manner (i.e. seconds) until a desired re sult is achieved as shown in Fig. 1 (fourth). As depicted, we focus on the task of separating one sound into two. To sepa rate more than two sources at a time (e.g. drums + vocals + guitar), the complete separation process can be repeated sev eral times (e.g. first separate drums from vocals + guitar, then separate vocals from guitar). This interaction paradigm can be viewed via two screenshots of our current user interface. The screenshots include the Multi Paint View in Fig. 2 and Single Paint View in Fig. 3.
Figure 2. The Multi Paint View. In this view, a user can view, zoom, listen and paint on both the input and outputs of the separation process.
Figure 3. The Single Paint View (w/zoomed inset). In this view, a user can view, zoom, listen, and paint on a single selected track.
In the Multi Paint View, a user can listen, view, zoom, and paint on the input mixture recording (top track) and the sep arated outputs (middle and bottom track). In the Single Paint View, a user can listen, view, zoom, and paint on a single, se lected track on a larger display (either the input or one of the two outputs). These two views encompass the central func tionality of ISSE, along with the Settings View (not shown), which allows a user to control specific parameters of the sep aration algorithm. All three main views are tabbed for easy navigation. Analogies
When considering the employed interaction, it is useful to think about two constructive analogies from related media content creation paradigms. In the first analogy, we can compare our proposed interaction to the process of extracting a layer (foreground, background, or other type of layer) in an image editing program. The pro cess of extracting an image layer begins by a user defining what they wish to separate, taking a selection tool, clicking on the background a few times, and then clicking extract. If the layer is not completely separated, the process is repeated over and over until a desirable result is achieved. This iter ative process, juxtaposed with smart or intelligent selection
Unlabeled! Data!
Learning Algorithm!
(a)
(b)
(c)
(d) User Correction!
Feedback to User!
Figure 5. Interactive machine learning feedback loop.
(e)
(f)
(g)
Figure 4. (Top) To extract a layer of an image, a user will separate small portions of the layer at a time in an iterative fashion to achieve the final, polished result (image license [15]). (Bottom) To sculpt a 3D animated character, a user will begin with primitive shapes, and then gradually add and subtract material to sculpt the geometric mesh. Only when the feedback loop between the user’s action and the computer’s response is sufficiently fast can a user effectively virtually sculpt.
tools, can be extremely powerful as demonstrated in the work of Rother et al. [27] and is something we strive towards for source separation. For the case of source separation, the “images” are timefrequency representations of sound. These sound images, however, are very different from natural images, making the use of standard computer vision-based methods very difficult. In particular, the images consist of objects or sources that can have physically disjoint parts caused by a source turning on and off and/or by harmonics (i.e. energy at integer multi ples of the fundamental frequency). Even worse, our images have transparency due to the superposition property of sound, which implies that multiple sound sources can be present at any given time-frequency point. As a result, we must estimate the proportion of each sound source per pixel from a mixture spectrogram. In the second analogy, we can liken our proposed interac tion to three-dimensional sculpting. In the process of threedimensional sculpting, such as those of Maya or Blender, a user will typically take primitive geometric shapes, carefully add and subtract material (using manual or more intelligent tools), and over the course of many hours, create their fin ished product. This iterative environment, which allows a user to push, pull, and generally manipulate content, is some thing we again strive towards with our proposed interaction and believe is critical in achieving high-quality separation re sults. Interactive User-Feedback
To further comment on the iterative process of the system, we outline the block diagram of the interactive feedback loop in Fig. 5 and discuss its essential benefits below. The first benefit of the user-feedback of our system is that it significantly improves separation quality. Without user-
guidance, the quality of the results would either be severely degraded [5] or require the use of isolated training data to perform separation and most likely still have inferior perfor mance [6]. Secondly, a priori, the problem of knowing which sources to separate is ill-defined because there are multiple ways of separating a given mixture sound. For example, given a pop song, a user might want to extract the vocals from the back ground, rather than separate each instrument. To get around this issue, some systems pre-define which sources are to be separated, as is the case in speech denoising and pitchedbased separation. In our case, however, we allow a user to define the concept of what a source is (e.g. source = drums, drums + bass, etc.) simply by annotating the correct regions of the mixture spectrogram, making the technique more gen eral. Thirdly, the ability to iterate removes the burden placed on the separation algorithm to be perfect the first time–a very strong assumption that is rarely achieved by automatic meth ods. This places a portion of the responsibility to achieve high-quality results back to the user. For the case of pro fessional level users for which we are interested in, this is acceptable and in many cases advantageous. Fourthly, the feedback loop allows a user to both learn how to interpret spectrogram displays and to understand how the sep aration algorithm reacts to their painting annotations. With this knowledge, users can then further improve how they op erate the system and more accurately map auditory stimuli to visual feedback. Given that sound is a perceptual domain and our method of interaction is indirect (i.e. painting on visu alizations of sound), this is critical. In a sense, human users must also learn and adjust their behavior alongside the sep aration algorithm to accomplish something neither could do independently. Lastly, the use of feedback allows us to constantly evaluate the separation quality and validate the results are improving. A user’s approval or disapproval is then used to update our optimization objective. In essence, the procedure indirectly incorporates a perceptual model into our separation algorithm without an explicit model of human hearing.
SEPARATION ALGORITHM
To algorithmically perform source separation, we follow our previously proposed algorithms [5, 6], which are based on probabilistic latent component analysis (PLCA) [26, 33]. We review both methods below.
P (f |z)
Basic Model
S
ut
ed
In nearly all real-word situations, however, such an ideal seg mentation almost never occurs, requiring the use of super vised or semi-supervised PLCA-based methods. These meth ods work as described above, but estimate the frequency com ponents of each source independently given isolated training data. The individual models are then combined to form a complete model and used to estimate the contribution of each source within a mixture sound. Once we know the propor tions of each source, we can then reconstruct each source in dependently and perform separation as before.
tn
This can be seen visually in Fig. 6, which depicts the use of PLCA to model a spectrogram of a piano playing “Mary Had a Little Lamb.” In this case, three frequency compo nents are used to model the three pitches (E, D, and C) of the two-measure passage. Notice how the frequency components P (f |z) ideally capture the harmonic structure of the pitches and the corresponding elements of P (t|z) and P (z) capture the timing and amplitude levels of each note. This approach allows us to perform a type of clustering that discovers re peating spectral patterns of a given sound and decouple the frequency content of a sound from the volume level.
V
When used to model a mixture sound and eventually perform separation, non-overlapping groups of frequency components are first associated with each sound source and then estimated using an iterative expectation-maximization (EM) optimiza tion procedure. Once estimated, the parameters can be used to compute the proportion of each source at each time-frequency point. These results are used to compute time-varying fil ters that are applied to the mixture signal to finally generate the separated sources (following standard practice and other Weiner filtering-based approaches).
re
where f and t are observed discrete random variables, z is a latent discrete random variable, P (f , t) is a two-dimensional multinomial probability distribution, P (f |z) is a multinomial distribution representing the prototypical frequency compo nents, and P (t|z) and P (z) are multinomial distributions that represent the volume of the frequency components.
is
(1)
no
P (z)P (f |z)P (t|z),
fo
z
AM
P (f, t) =
LT
Intuitively, PLCA is a data-driven approach that approximates ×T as a linear combination audio spectrogram data X ∈ RN + of prototypically frequency components over time. Mathe matically, PLCA models an audio spectrogram X via
P (z) BA
Probabilistic latent component analysis is a simple probabilis tic latent variable model used for a variety of audio analysis and separation tasks that involve mixture sounds. It is closely related to probabilistic latent semantic indexing/analysis [20], non-negative matrix factorization (NMF) [21, 31], and can be considered a generative time-varying mixture model.
P (t|z) Student Version of MATLAB
Student
Version
of
MATLAB
Figure 6. An illustration of using PLCA to model a spectrogram of a piano playing “Mary Had A Little Lamb.”
User-Feedback As Optimization Constraints
Student Version of MATLAB
To remove the requirement of isolated training data, userfeedback is incorporated into this separation procedure by leveraging the painting annotations as discussed above. This is done by adding (weak) supplementary constraints or regu larization parameters into the EM optimization objective. The painting annotations are then appropriately mapped to control the weighting of the parameters to encourage or discourage one group of frequency components to explain a given timefrequency point of the mixture sound. Once the regularization parameters are updated, the entire separation procedure is re estimated to best fit the data and incorporate the user-defined constraints. In this way, the annotations placed at one time-frequency point can propagate throughout the recording via the PLCAbased clustering procedure and have a global effect on the separation estimation. This minimizes the need for a com plete set of annotations as required by many past approaches. The specific type of constraint used is a form of posterior reg ularization [18]. Overall, the entire procedure can be thought of as a user-guided interactive clustering process and is, very generally speaking, similar to the work of Cohn et al. [8], Settles [28], and others. When employed in practice, the added regularization pa rameters are initially set to zero with clear painting annota tions. When the regularization parameters are zero, the pos terior regularized PLCA algorithm mathematically reduces to a standard unsupervised PLCA algorithm. Once a user starts to paint on the displays, the regularization parameters are reweighted based on the opacity and color of the paintbrush. All annotations across all tracks for a given sound source are rendered into a single matrix (i.e. two matrices for two sources). The annotation matrices for all sources are then used to update the separation estimates. The entire estima tion process is updated after each paintbrush stroke (mouse up event) or alternatively trigger from a button click. For short duration audio recordings, this results in a very speedy and efficient feedback loop and allows a user to quickly see the effect of their annotations.
USER STUDIES
To test the proposed system, we designed our evaluation with the following questions in mind: Can inexperienced users with a music and audio background use our software to achieve a reasonable level of separation quality? How does this separation quality compare to the quality achieved by ex perienced, expert users of the system? And what is the maxi mum achievable separation quality of the system? Methodology
To answer these questions, we first studied how inexperienced users (with music and audio backgrounds) performed on a variety of separation tasks using the proposed system. The specifics of the study are described below and were approved through standard institutional review board procedure. Participants
We recruited 10 participants from an email listserv from the first author’s academic center with the incentive of a $25 gift card. The participants had significant levels of musical train ing, audio editing skills, and knowledge of spectrogram dis plays of sound, but no experience with our system. The level of formal musical training varied between 0-30 years and av eraged ≈ 12 years. The level of music production varied between 1-15 years and averaged ≈ 4 years. And finally, the level of experience with spectrogram displays ranged be tween 12 -10 years and averaged ≈ 4 years. In addition to the 10 participants, an expert user (the first author) was also tested for comparison. The expert user had 10 years of music production and editing background and hundreds of hours of experience working and designing the system. Training
To train each participant, we presented him or her with a fiveminute introductory video. The video outlined the general functionality of the system and provided three demonstrative examples. Following the video, a standardized description of what would be required of the user was read aloud. This was followed by a five-minute question-and-answer section. Tasks
Once the training was complete, five real-world separation tasks were given to each user. Each of the five tasks required the user to separate a mixture recording of two sounds into its respective sources over the course of ten minutes. At the end of each task, the separation results were saved and stored for later analysis. At any time, a user was allowed to ask questions on the functionality of the system (mechanics of buttons, sliders, etc.). The mixture sounds used for each task were arranged in order of difficulty and include: (1) a cell phone + speech, (2) ambulance siren + speech, (3) bass guitar + drums, (4) cough + orchestra, and (5) vocals + guitar. Debrief
Once the tasks were completed, each user was given a ques tionnaire and debriefing survey. The survey was used to gauge the difficulty and satisfaction level of each task on a scale of one to five and record users’ overall experience us ing the system. Questions included: 1) Did you feel like your ability to separate sounds improved over time? 2) What was
the most difficult aspect of the system? 3) What was the most fun aspect of the system? 4) Additional comments? Scoring Success
To measure the separation quality achieved by our partici pants and compare the result to those of an expert user, we used the standard BSS-EVAL suite of objective source sepa ration evaluation metrics [38]. The suite includes three sepa rate measurements including the Source-to-Interference Ra tio (SIR), Source-to-Artifacts Ratio (SAR), and Source-toDistortion Ratio (SDR). The SIR measures the level of sup pression of the unwanted sources, the SAR measures the level of artifacts introduced by the separation process, and the SDR gives an average measure of separation quality that consid ers both the suppression of the unwanted sources and level of artifacts introduced by the separation algorithm compared to ground truth. All three of the metrics are statistical mea sures and are computed by comparing the estimated sepa rated source signals to the original unmixed recordings used to compose the given mixture sound. They have units of deci bels (dB) and consider higher values to be better. To make it easier to compare separation quality across differ ent tasks, we then normalize these metrics for a given task by computing the separation quality from an ideal soft mask algorithm (discussed in [5] and many others) by subtracting it off. The ideal soft mask results provide us with a level of near perfect separation quality and are typically considered to be an empirical pseudo upper bound of source separation performance for NMF/PLCA algorithms, although this is not always the case (it is possible for other methods to perform better). We do this because the BSS-EVAL metrics do not natively provide an upper bound score for separation quality. In addition to this empirical pseudo upper bound, we also provide a pseudo lower bound for comparison by computing the separation results given no interaction. Both benchmarks help us get a better idea of how well our participants per formed. Note, it is also possible for a user to perform worse than the lower bound as a result of ill-placed (e.g. very large, opaque, or discontinuous) annotations and similar issues that can cause audible artifacts. Results
The results of the user study are presented in two forms: using the BSS-EVAL metrics and via user responses. Objective Separation Quality
The computed SDR, SAR, and SIR results for each of participant/task are shown in Fig. 7, Fig. 8, and Fig. 9 respec tively. The results for each participant, the participant av erage, and the participant standard deviation, are reported alongside the results for the expert user, ground truth method, and no-interaction method. Out of these plots, the most notable is Fig. 7, which displays an overall measure of separation quality. From this figure, we can view several interesting observations. Firstly, as ex pected, the expert user outperformed nearly all inexperienced users in all tasks. What is unexpected, however, is that in
0 −10
SAR vs. Task 2
23 6 8 10 4 79 1
1
5
10
34 7 8 2 9 6
5
−20
3 2 1
4
10 6 9
5
7 8
9 135 4 67 10 8 2
8
23456 7 910 1
−30 1
2
3 Task
4
5
SIR vs. Task Normalized SIR (dB)
Student Version of MATLAB
−10
2 10 6 1 8 34 7 9
5 1 34
5
10 7 89
2
−20
10 6 9 45 7
3
6
1 2
9 13 45 2 678 10
3 68 45
2 1
10 79
8
−30 1
2
3 Task
4
0 −10
234 6 8910 7 1 5
5
Figure 8. Normalized SIR results. Inexperienced-user scores (black, dots/numbers), inexperienced-user average scores (black, star), inexperienced-user one standard deviation (black, line), expert-user scores (blue, x), ideal scores (red, plus), and no-interaction scores (ma genta, square) are shown for each task.
Student Version of MATLABac more than one instance, a select few inexperienced users tually outperformed the expert. Given our expert user evalu ation results (below), this is a very promising result.
Secondly, there are four tasks (1, 2, 3, and 4) in which one or more participants achieved separation results within 5dB of the ideal result. While this benchmark is difficult to translate into perceptual quality, this type of performance is similar to state-of-the-art separation quality reported in the communitybased signal separation evaluation campaign discussed be low, albeit for easier tasks. And thirdly, in four out of five tasks, the average inexperienced user outperformed the nointeraction baseline by over 5dB and in two cases outper formed the baseline by nearly 15dB or more. Similar phenomena are found in Fig. 8 and Fig. 9, and to gether these results give us an indication that inexperienced users can achieve good separation quality with minimal in struction. It should also be noted that in Fig. 9, the SAR without interaction is occasionally better than the user scores. This is because the results without interaction are almost identical to the input (no separation) resulting in minimal ar tifacts. The correspondingly low SIR scores reflect this fact. User Responses
In addition to the evaluation discussed above, it is also inter esting to look at the results from the debriefing surveys. We first discuss the participants’ rating of difficulty and satisfac-
1
5
10
8
13
6 4 7 5
34 7 8 2 6 9
10 9
5 9 13 4 6 10 7 8 2
8 2 34567 9 10 1
−20 −30 1
Figure 7. Normalized SDR results. Inexperienced-user scores (black, dots/numbers), inexperienced-user average scores (black, star), inexperienced-user one standard deviation (black, line), expert-user scores (blue, x), ideal scores (red, plus), and no-interaction scores (ma genta, square) are shown for each task.
0
Normalized SAR (dB)
Normalized SDR (dB)
SDR vs. Task
2
3 Task
4
5
Figure 9. Normalized SAR results. Inexperienced-user scores (black, dots/numbers), inexperienced-user average scores (black, star), inexperienced-user one standard deviation (black, line), expert-user scores (blue, x), ideal scores (red, plus), and no-interaction scores (ma genta, square) are shown for each task.
tion for each task in Fig. 10 and Fig. 11 and then address Student Version of MATLABthe follow-up questions. In Fig. 10, we can see a steep increase in the perceived dif ficulty of each task over the course of the entire experiment as intended by design. When we compare this to the separa tion quality discussed above, we see that while the perceived difficulty of each task increases, the average SDR stays more or less the same. This suggests that the average user was able improve their ability to separate sounds over the course of the study and additionally, this coincides with the fact that all users self-reported that their ability to separate sounds im proved. Both observations further suggest that inexperienced users can learn to use the system in a relatively short amount of time. In Fig. 11, we see users’ satisfaction per task. For the first two easier tasks, most users gave a satisfaction rating of four out of five. For the more difficult tasks, user satisfaction de creased to three out of five. This loosely suggests that the user-reported difficulty rating is correlated to user satisfac tion. Regarding the most difficult aspects of the system, nearly all users commented on the task of associating a sound to its visualization, as expected. Regarding the most fun aspects of the system, participants commented: “When it worked!”, “Interactively being able to control the separation,” “This was not possible with the tools of the past!”, and “The real timeness of the software made everything fun and engaging.” Regarding additional comments, participants stated: “This would be a useful teaching tool!”, “real great work, some in sight on what is actually happening may be useful for opti mizing user activity,” “Include progress of rendering in each window,” and “This is awesome.” In general, we found the users’ responses to be very positive. ADDITIONAL EVALUATION
In addition to the user studies above, we further tested our expert user and submitted separation results computed by the expert to the fourth community-based signal separation evalu ation (SiSEC) campaign [29]. Submitted categories included professionally produced music recordings and two-channel mixtures of speech and real-world background noise.
Difficulty Rating vs. Task
Difficulty
5
Audio and Video Demonstrations 2
4
34
3
2
2
13
1
3
7
9
35
1 3 6 8 10
12 5678 10
9
1 4 78
45 7 9
2
6
10
12 456
78
8910
456 910
1
2
3 Task
4
5
Figure 10. Reported user difficulty (black, dots/number) for each of the five separation tasks, along side the average (black, star) and standard deviation rated difficulty (black, line). Notice how the average difficulty rating increases for each task.
Satisfaction
46
4
1 3 5 789
10
45 8
3 Student Version of MATLAB 357
1 3 67 910
3
1
2
579
6 8910
1
24
1
2
1
2
78
68 4
2
23 56 10
1 4
910
2
3 Task
4
We also produced several short “mini-mashups” to show how the system can be useful for music production and remixing. To make the mini-mashups, we used ISSE to perform vocal separation on several popular songs (20-30 second clips of about 8 measures of music per song). We then remixed the separated vocals with new instrumental music. IMPLEMENTATION DETAILS
Satisfaction Rating vs. Task 5
Furthermore, to demonstrate the system, we posted an in troductory demonstration video and several sound examples. Examples include separation of vocals + guitar, drums + bass, Neil Armstrong’s speech + noise, piano chords + wrong note, orchestra + cough, phone ring + speech, and vocals + drums + bass + other.
5
Figure 11. Reported user satisfaction (black, dots/number) for each of the five separation tasks, along side the average (black, star) and stan dard deviation rated satisfaction (black, line).
For the task of professionally produced music recordings, which we are more acutely interested in, the evaluation in Student Version of MATLAB volved separating a test set of nine pop/rock music record ings. Seven out of nine recordings are short 20-30 second snippets. Two out of nine recordings are full-length versions of two of the shorter recordings. Each recording consists of 2 4 sources such as vocals, guitar, bass, and piano. We submit ted results to all sources of all short duration clips, resulting in 24 subtasks. We compared our results to the 15 other submissions using the standard BSS-EVAL and PEASS scores [10]. The PEASS scores attempt to measure the perceived quality of the esti mated source signal using four individual measures, including the Overall Perceptual Score (OPS), the Interference-related Perceptual Score (IPS), the Artifact-related Perceptual Score (APS), and the Target-related Perceptual Score (TPS). The OPS, IPS, and APS are analogous to the SDR, SIR, and SAR, respectively, and the TPS corresponds to something called the image-to-spatial distortion ratio (ISR), which measures spa tialization accuracy. In the end, we achieved: highest SDR 16/24 times (next closest algorithm 4/24), highest SAR 12/24 times (next closest 8/24), highest SIR 17/24 times (next clos est 2/24), highest ISR 11/24 times (next closest 6/24), the highest OPS 9/24 times (next closest 5/24), and the highest average overall SDR, SAR, SIR, ISR, and OPS. Please also see the summary of Ono et al. [23]. All results and sound examples from the evaluation are available online [29].
The proposed system is written in the C++ programing lan guage. It is built for OSX, Windows, and Linux operating systems (32 and 64-bit), and licensed under the GNU Gen eral Public License Version 3 [16]. Features include audio playback/transport control, spectrogram viewing with zoom controls, paintbrush tools, undo/redo, file saving/loading, mute/solo/volume control, and a fully multithreaded user in terface and processing architecture. Current painting tools include time select, frequency select, box select, infinity time select (used to select isolated training data if available), and a spray-paint brush. In addition to the application and source code, a user forum, wiki, and user manual are also available to encourage both user and developer community involvement. Development Process
The current implementation is the result of several alpha ver sions of the software that were released starting in July 2013. Using feedback from the user study, the user forum, and the authors’ experience, we updated and improved the initial in terface design. Improvements since the initial release include: cross-platform compatibility, adding a processing progress bar (without this several users became frustrated when the separated sources would updated unexpectedly), added the Single Paint View and the tabbed display, clarified and up dated the icons, added stereo processing capabilities, sepa rated the audio transport buttons from the painting and dis play controls, and consolidated and reorganized the paint brush controls. Since the initial release, tens of community users have been active in the user forum and, to date, the ap plication has been downloaded over 8,000+ times across 80+ different countries. Third Party Libraries
The software is heavily dependent on several third-party open-source libraries including JUCE [35], Eigen [19], and FFTW [17]. JUCE, or Jules Utility Class Extensions, is a large, open source, cross-platform, C++ class library and is used for all user interface and audio playback functionality. Eigen is a high-performance, open-source, cross-platform, C++ template library for linear algebra, matrices, vectors, solvers, and related algorithms and is used for the core sig nal processing/machine learning-based separation algorithm. FFTW is an open-source, cross-platform, C subroutine li brary for computing discrete Fourier transforms and is used
Computation Time (Sec)
Computation Speed vs. Audio File Length
25
CONCLUSION AND FUTURE WORK
20 15 345
10
2
1
5 0 1
5
10
15
20
Audio File Length (Sec)
25
30
35
Figure 12. Computation Speed. Overall time (black, x, solid line), PLCA time (red, circle, dash-dot line), STFT time (blue, plus, dashed line) and user studies tasks (black, star, numbers) are shown for high qual ity (slower lines) and low-quality (faster lines) audio sample rate.
Student Version of MATLAB for all fast Fourier transform operations needed for both the spectrogram displays and the separation algorithm.
Computation Speed
Finally, because of our emphasis on interactivity, we briefly comment on the computational speed of our proposed ap proach. Fig. 12 depicts the time it takes our system to react to a user annotation, re-estimate the separation results, and present the results back to the user. We call this a single iter ation or execution of the algorithm (note, the parameter esti mation is also an iterative procedure). Results are shown as a function of the input file length using a high-quality (44.1kHz sample rate) and low-quality (16kHz sample rate) setting of the algorithm. We also plot the file lengths and computation time of the five tasks of our user study. As shown, our algorithm is unfortunately linearly dependent on the input file length. Even though our algorithm is faster than real-time, this limits the degree of interactively for files longer than 20-30 seconds. Fortunately, however, the recent work of Battenberg and Wessel [2] shows that graphics pro cessing unit (GPU) implementations of similar separation al gorithms can increase computation speed over 30x, given the highly parallelizable nature of PLCA-based algorithms. This could potentially allow a much higher-degree of interactivity in future implementations. In addition to the computation speed for a single complete iteration of our algorithm, it is also interesting to note how many complete iterations are necessary for an expert user to perform typical separation tasks (in our user study, we ar tificially limited the time allowed per separation task). For both the SiSEC submissions and the additional produced au dio demonstrations, it took us anywhere from 10-60 minutes per task. We should also note that, in general, the complete separation time is highly dependent on the source material. Some tasks can take a few minutes, while others can take several hours. Within this time frame, the separation algorithm is comput ing (almost) continuously in the background. As a result, the separation algorithm is executed hundreds or even thousands of times to adequately perform high-quality separation. This fact, in itself, is a testament to the benefit of iteration and user-feedback.
We have presented a new open-source, freely available, crossplatform audio editing tool that allows a user to perform single-channel source separation. The software system works by allowing a user to provide feedback into the separa tion process by painting on spectrogram displays of both the input and output sounds of the separation process. The painting annotations are then used to inform a NMF/PLCA based separation system and iteratively improve separation quality as noted in past work. Evaluation and demonstra tions were presented for a wide variety of sounds, show ing promise that the system can be used in many real-world audio and music editing scenarios. To download the ap plication, code, and audio/video demonstrations, please see isse.sourceforge.net/. For future work, we hope to extend the software with a vari ety of features including: 1) a plugin architecture to allow for third-party developers to create and implement new separa tion algorithms without the worry of user interface develop ment 2) intelligent audio object selection such as smart select and harmonic select tools 3) GPU support for increased pro cessing efficiency and 4) new tools for managing the separa tion of multi-channel recordings as well as longer recordings. REFERENCES
1. Amershi, S., Lee, B., Kapoor, A., Mahajan, R., and
Christian, B. Cuet: Human-guided fast and accurate
network alarm triage. In Proc. CHI (2011), 157–166.
2. Battenberg, E., and Wessel, D. Accelerating non-negative matrix factorization for audio source separation on multi-core and many-core architectures. In Proc. ISMIR (2009), 501–506. 3. Bogaards, N., Ro¨ bel, A., and Rodet, X. Sound analysis and processing with audiosculpt 2. In Proc. ICMC (2004). 4. Boogaart, C. G. v. d., and Lienhart, R. Audio brush: a tool for computer-assisted smart audio editing. In ACM Workshop on Audio and Music Computing Multimedia (2006), 115–124. 5. Bryan, N. J., and Mysore, G. J. An efficient posterior
regularized latent variable model for interactive sound
source separation. In Proc. ICML (2013).
6. Bryan, N. J., and Mysore, G. J. Interactive refinement of supervised and semi-supervised sound source separation estimates. In Proc. ICASSP (2013). 7. Bryan, N. J., Mysore, G. J., and Wang, G. Source
separation of polyphonic music with interactive
user-feedback on a piano roll display. In Proc. ISMIR
(2013).
8. Cohn, D., Caruana, R., and Mccallum, A.
Semi-supervised clustering with user feedback. In
Constrained Clustering: Advances in Algorithms, Theory, and Applications, S. Basu, I. Davidson, and K. Wagstaff, Eds. Chapman & Hall/CRC, 2008.
9. Durrieu, J.-L., and Thiran, J.-P. Musical audio source
separation based on user-selected f0 track. In Proc.
LVA/ICA (2012), 438–445.
10. Emiya, V., Vincent, E., Harlander, N., and Hohmann, V. Subjective and objective quality assessment of audio source separation. IEEE Transactions on Audio, Speech, and Language Processing 19, 7 (2011), 2046–2057. 11. Fails, J. A., and Olsen, Jr., D. R. Interactive machine learning. In Proc. IUI (2003), 39–45. 12. Fe´ votte, C., Bertin, N., and Durrieu, J.-L. Nonnegative matrix factorization with the itakura-saito divergence: With application to music analysis. Neural Computation 21, 3 (2009), 793–830. 13. Fiebrink, R. Real-time Human Interaction with Supervised Learning Algorithms for Music Composition and Performance. PhD thesis, Princeton University, 2011. 14. Fogarty, J., Tan, D., Kapoor, A., and Winder, S. Cueflik: interactive concept learning in image search. In Proc. CHI (2008), 29–38. 15. Fowler, T. Giraffe (modified). http: //www.flickr.com/photos/j33pman/7701103436/,
2012. Attribution-NonCommercial-ShareAlike 2.0 Generic License.
25. Ozerov, A., Vincent, E., and Bimbot, F. A general flexible framework for the handling of prior information in audio source separation. IEEE Transactions on Audio, Speech, and Language Processing 20, 4 (2012), 1118–1133. 26. Raj, B., and Smaragdis, P. Latent variable decomposition of spectrograms for single channel speaker separation. In Proc. IEEE WASPAA (2005), 17 – 20. 27. Rother, C., Kolmogorov, V., and Blake, A. ”grabcut”: interactive foreground extraction using iterated graph cuts. Proc. SIGGRAPH 23, 3 (2004), 309–314. 28. Settles, B. Closing the loop: Fast, interactive semi-supervised annotation with queries on features and instances. In Proc. EMNLP (2011), 1467–1478. 29. SiSEC Audio Committee. Signal separation evaluation campaign (sisec). http://sisec.wiki.irisa.fr/tiki-index.php, 2013. 30. Smaragdis, P. User guided audio selection from complex sound mixtures. In Proc. UIST (2009), 89–92. 31. Smaragdis, P., and Brown, J. Non-negative matrix factorization for polyphonic music transcription. In IEEE WASPAA (2003), 177 – 180.
16. Free Software Foundation. GPL Version 3. http://gplv3.fsf.org/, 2007.
32. Smaragdis, P., and Mysore, G. J. Separation by “humming”: User-guided sound extraction from monophonic mixtures. In Proc. IEEE WASPAA (2009), 69–72.
17. Frigo, M., and Johnson, S. G. The design and implementation of FFTW3. Proc. of the IEEE Special Issue on Program Generation, Optimization, and Platform Adaptation 93, 2 (2005), 216–231.
33. Smaragdis, P., Raj, B., and Shashanka, M. A probabilistic latent variable model for acoustic modeling. In NIPS Workshop on Advances in Modeling for Acoustic Processing (2006).
18. Ganchev, K., Grac¸a, J., Gillenwater, J., and Taskar, B. Posterior regularization for structured latent variable models. Journal of Machine Learning Research 11 (2010), 2001–2049.
34. Smaragdis, P., Raj, B., and Shashanka, M. Supervised and semi-supervised separation of sounds from single-channel mixtures. In Proc. LVA/ICA (2007), 414–421.
19. Guennebaud, G., Jacob, B., et al. Eigen v3. http://eigen.tuxfamily.org, 2010.
35. Storer, J. JUCE (Jules’ Utility Class Extensions). http://rawmaterialsoftware.com/juce.php, 2013. online.
20. Hofmann, T. Probabilistic latent semantic indexing. In Proc. SIGIR (1999), 50–57.
36. Stumpf, S., Rajaram, V., Li, L., Burnett, M., Dietterich, T., Sullivan, E., Drummond, R., and Herlocker, J. Toward harnessing user feedback for machine learning. In Proc. IUI (2007), 82–91.
21. Lee, D. D., and Seung, H. S. Algorithms for non-negative matrix factorization. In Proc. NIPS (2001), 556–562. 22. Lefe` vre, A., Bach, F., and Fe´ votte, C. Semi-supervised nmf with time-frequency annotations for single-channel source separation. In Proc. ISMIR (2012). 23. Ono, N., Koldovsky, Z., Miyabe, S., and Ito, N. The 2013 signal separation evaluation campaign. In Machine Learning for Signal Processing (MLSP), 2013 IEEE International Workshop on, IEEE (2013), 1–6. 24. Ozerov, A., F´evotte, C., Blouet, R., and Durrieu, J.-L. Multichannel nonnegative tensor factorization with structured constraints for user-guided audio source separation. In Proc. ICASSP (May 2011), 257 –260.
37. Talbot, J., Lee, B., Kapoor, A., and Tan, D. Ensemblematrix: Interactive visualization to support machine learning with multiple classifiers. In Proc. CHI (2009). 38. Vincent, E., Gribonval, R., and Fe´ votte, C. Performance measurement in blind audio source separation. IEEE Transactions on Audio, Speech, and Language Processing 14, 4 (2006), 1462 –1469. 39. Virtanen, T. Monaural Sound Source Separation by Nonnegative Matrix Factorization With Temporal Continuity and Sparseness Criteria. IEEE Transactions on Audio, Speech and Language Processing 15, 3 (2007), 1066–1074.