The levels at which E2EMon detects failures are: © Network level: connection between client and JAGR closed, connection refused, timeout while reading data.
Appears in Proceedings of the 5th International Workshop on Active Middleware Services, Seattle, WA, June 2003
JAGR: An Autonomous Self-Recovering Application Server George Candea, Emre Kıcıman, Steve Zhang, Pedram Keyani, Armando Fox Stanford University Computer Systems Lab Stanford, CA 94305, USA candea,emrek,steveyz,pkeyani,fox � @cs.stanford.edu
Abstract
for failure detection and recovery that are external to the application and do not rely on a priori fault models or models of the application’s semantics; examples include recursive restarts as a form of recovery [4] and anomaly detection in runtime path analysis as a form of failure detection [7]. Given the emergence of popular middleware platforms for Internet/Web-based applications, such as Java 2 Enterprise Edition (J2EE), we believe these techniques can be applied today to the middleware platform implementation itself, so that all applications written to that platform will benefit. In this paper we describe progress toward just such a goal; we present an integrated system that leverages several pieces of our prior work. We have augmented JBoss, an open-source implementation of the J2EE middleware platform. By adding a plug-in architecture for failure monitoring and a recovery manager that reacts to failures by using component-level microreboots for recovery, we enable JBoss, along with any J2EE-compliant application running on top of it, to automatically detect and recover from a variety of transient failures. The result is an end-to-end selfrecovering system which is application-generic with respect to this class of failures. Past work [14, 6] has painted a grim picture regarding application-generic recovery, showing that general-purpose transparent recovery is unlikely to work. But this conclusion derives in part from the fact that a fully generic recovery system cannot make any assumptions about application structure, and therefore about what constitutes safe (correctness-preserving) generic recovery. We argue that for the specific class of applications we’re targeting— interactive Internet services deployed in a traditional multitier configuration—we can make assumptions about their structural properties, and these assumptions make it possible to obtain application-generic benefits solely by modifying the middleware. Although we do exploit applicationspecific fault propagation information to guide recovery, the process for collecting this information is itself applicationgeneric, automatic, and relatively fast to perform (on the order of hours).
This paper demonstrates that the dependability of generic, evolving J2EE applications can be enhanced through a combination of a few recovery-oriented techniques. Our goal is to reduce downtime by automatically and efficiently recovering from a broad class of transient software failures without having to modify applications. We describe here the integration of three new techniques into JBoss, an open-source J2EE application server. The resulting system is JAGR—JBoss with Application-Generic Recovery—a self-recovering execution platform. JAGR combines application-generic failure-path inference (AFPI), path-based failure detection, and microreboots. AFPI uses controlled fault injection and observation to infer paths that faults follow through a J2EE application. Path-based failure detection uses tagging of client requests and statistical analysis to identify anomalous component behavior. microreboots are fast reboots we perform at the sub-application level to recover components from transient failures; by selectively rebooting only those components that are necessary to repair the failure, we reduce recovery time. These techniques are designed to be autonomous and application-generic, making them well-suited to the rapidly changing software of Internet services.
1. Introduction We would like ������� Internet applications to be able to automatically recover from a variety of transient failures, freeing system operators to focus on higher-leverage tasks and requiring fewer operators to oversee largersized systems. Our Recovery-Oriented Computing (ROC) project [19] embraces the philosophy that failures will happen—whether due to hardware, software, or operator error—and fast recovery is the key to maintaining high availability in the face of these failures. To this end, ROC researchers and others have been investigating techniques 1
E2EMon
HTTP Server
(clients)
Servlet / JSP Container
J2EE [21] is a standard for constructing enterprise applications from reusable Java modules, called Enterprise Java Beans (EJBs). An EJB is a Java component that conforms to a particular programmatic interface and provides services to local and remote clients. The EJB architecture runs distributed components within a special container, which is provided and serviced by the application server (see Figure 1). A J2EE application server provides a standard environment and set of runtime services specified by J2EE, including naming and directory services, authorization and authentication, state management, integration with a Web server, etc. To run a J2EE application, one must boot the operating system, start the J2EE application server (e.g., JBoss), start any necessary additional components required by the application (e.g., a database used for persistent state storage), and finally instruct the application server to deploy and instantiate the beans associated with the application. We chose J2EE because it is widely used and enjoys good developer infrastructure. The J2EE APIs provide a useful level of indirection between the applications and the underlying platform, which we exploit to do instrumentation and recovery from which all applications can benefit. Among the various commercial and open-source implementations of J2EE application servers, we chose JBoss [11] because it is open source, performs well, and is very popular: it has been downloaded from SourceForge [20] over 3 million times, and received JavaWorld 2002 Editors’ Choice Award in its product category over several commercial competitors. More than 100 corporations, including WorldCom and Dow Jones, are using JBoss for demanding computing tasks.
Web Browsers
Stall Proxy
1.1. J2EE and JBoss
J2EE Application EJB
EJB EJB
EJB
EJB
EJB
Database EJB Containers
Naming Dir Txn Svc
Messaging Security Mgr AFPI Fault Recovery Injector Agent
Application Server
ExcMon PPMon
f-map Recovery Mgr
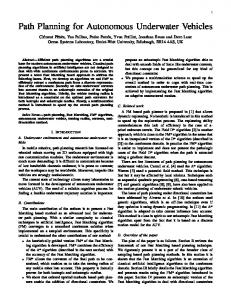
Figure 1. JBoss with Application-Generic Recovery (JAGR): A J2EE application server that can self-recover. Dark gray boxes indicate components we added to JBoss.
Mon), and one based on detecting end-user-visible failures (E2EMon). Each plug-in failure monitor is responsible for sending failure notifications to the recovery manager (RM). For PPMon and ExcMon, we modified JBoss to allow request tracing and exception tracking. Request tracing allows PPMon to follow the “path” of any request through the system [8], recording which EJB’s are invoked in satisfying a request. Exception tracking allows us to observe exceptions thrown by EJB’s and report them to the recovery manager, which can then attempt immediate microrebooting. The recovery manager oversees the whole recovery process and resides outside the application server proper; this design choice allows us to fortify it, which is important given the degree to which fast recovery of the application server depends on accurate RM actions. When the RM suspects that one or more components have failed, it instructs a recovery agent, inside the JBoss application server, to microreboot the suspect components [2].
1.2. From JBoss to JAGR
To keep clients from failing while parts of the system are rebooting, our stall proxy will intercept new client connections and force them to wait up to 8 seconds while the recovery process completes.
As shown in Figure 1, we have augmented JBoss in a number of ways: we added a modular monitoring plugin infrastructure (the figure shows three sample monitors, E2EMon, ExcMon, and PPMon), a recovery manager, a recovery agent, a stall proxy, and a fault injector used for automated failure-path inference. Since these changes were made in the J2EE execution platform, they can be used for any J2EE-compliant application. Accommodating multiple failure monitors reflects the observation that no single type of monitoring will detect all types of failures, and that failure monitors themselves are likely to be imperfect. In this paper we report on three implemented failure monitors: one based on tracking Javalevel exceptions in the middleware and the failures that may cause them (ExcMon), one based on detecting behavioral anomalies in the application relative to historical data (PP-
Finally, we have added a fault injection mechanism used by the automatic failure-path inference algorithm [3] to obtain a graph that guides the RM in deciding which specific components or J2EE services to recover. We call this graph a failure-propagation map (f-map). In the next sections we describe the extensions we have made to JBoss in more detail: section 2 describes our failure monitoring infrastructure; section 3 presents the recovery manager and agent, along with the automated failurepath inference procedure. Section 4 describes our use of microreboots and the stall proxy. In section 5 we show experimental evidence for JAGR’s efficient self-recovery abilities. We conclude with related work and future directions. 2
1.3. Testbed Applications
itor correctly tracks faults across component boundaries. They also showed that a variety of low-level failures unrelated to the application, such as the hard failure of a remote node hosting a needed service, ultimately manifest as Java exceptions [3]. While developing ExcMon, we found that not all of the exceptions ExcMon catches are definitive signs of failure. Many exceptions are thrown, caught, and handled as part of the normal behavior of our testbed applications. For example, when a client tries to log into the RUBiS auction site using a non-existent user name, it cannot be found in the database and javax.ejb.FinderException is thrown. This exception is caught by a servlet and a suitable informational page is generated; this is correct behavior. To distinguish between these acceptable exceptions and those exceptions which cause an end-to-end failure, we have to combine ExcMon’s reports with those of other failure monitors.
We used two J2EE applications, Petstore and RUBiS, to test the work described here. PetStore 1.1 [22] is a freely available sample application that implements an ecommerce site, complete with personalized web pages, product catalogs, and shopping carts. It consists of 233 Java files and about 11K lines of code. It uses 14 database tables, contains 28 different kinds of items (pets) and 2 suppliers RUBiS [5] implements a web-based auction service modeled on eBay. Its features include user accounts, customized summary information, item bidding, and comments pages. RUBiS contains 582 Java files and about 26K lines of code; it uses MySQL for the database back-end, and stores 7 tables.
2. Failure Monitoring The first step of the recovery process is detecting that a failure has occurred and what components require recovery action. Often, we can recover from a failure without solving the harder problem of deducing the root-cause of the fault. Individual monitors are not required to be perfect, as we cross-reference reports from multiple failure monitors. Rather than trying to mask a specific failure from the end user, which would likely require application-specific knowledge, our goal is to report the failure and initiate generic recovery actions to eliminate it quickly, before the failure impacts a large number of end users. This approach of sacrificing a small number of user sessions for the good of the majority of the user population is appropriate for Internet services; for large sites, one would expect the number of concurrent users to be in the thousands or more, and the servers to handle hundreds to thousands of requests per second [18].
2.2. E2EMon: An End-to-End Failure Monitor The end-to-end failure monitor is a module that simulates a real client; in fact, our current implementation is colocated with our client emulator. E2EMon submits HTTP requests to the application through the web front end, according to a trace of such requests specific to the application under consideration. The monitor detects end-to-end failures, as experienced by an end user, at three different levels, and reports these failures to the recovery manager. As an end-to-end monitor, E2EMon only reports that a request appears to be failing, and cannot tell which components in the system might be at fault. E2EMon’s reports do, however, give us enough information to validate the component failures reported by ExcMon. Our current implementation of E2EMon can be used for both the PetStore and RUBiS applications with minimal modifications, because E2EMon is not very sophisticated. The levels at which E2EMon detects failures are:
2.1. ExcMon: An Exception Monitor The first failure monitor we have implemented tracks and reports Java exceptions (ExcMon). This monitor instruments the JAGR internals to intercept any Java exceptions thrown by application and platform components. Once an exception has been intercepted, the exception monitor reports the error and the offending component to the recovery manager. The kinds of failures that the exception monitor can detect include many application-level failures (e.g., dereferencing null pointers), resource failures (e.g., out-of-memory errors), and network failures. Of course, the exception monitor cannot detect failures that do not manifest as Java exceptions. Among others, this includes failures that cause the whole Java virtual machine to crash or hang. Previous experiments involving fault injection confirmed that our mon-
Network level: connection between client and JAGR closed, connection refused, timeout while reading data from server, etc. HTTP level: inspects all HTTP return codes, and reports those that indicate failure, such as HTTP 403 (“Forbidden”) or HTTP 500 (“Internal Server Error”). HTML level: empty HTML page returned, or page contains certain keywords that have been observed to correspond to failure or error pages (in our case erro and fail).
By definition, an end-to-end monitor cannot be entirely application-generic. For example, our generic approach of 3
searching for keywords needs to be tailored to the application under consideration. E2EMon searches for the erro and fail string prefixes, catching keywords such as error, erroneous, failed, failure, failing, etc. However, PetStore 1.1 has a help page which contains some of these keywords (as in “if you encounter an error, then sign out and...”); we needed to special-case this page to not signal an end-to-end failure. The more sophisticated the end-to-end detection gets, the more application-specific this monitor becomes. For instance, placing a bid in RUBiS and then verifying that it is correctly reflected in that item’s bid history requires semantic understanding of what an auction site does; we have not implemented this functionality. There are certain failures, however, that E2EMon cannot catch. Generally, these are either masked failures where the application attempts to hide the failure behind a plausible response; or Byzantine failures, such as subtly corrupt data. For example, a failure in Petstore’s TheInventory EJB results in the web catalog masking the failure with an innocuous (and incorrect) “Not in stock” message. Regardless of the level of sophistication we embed in E2EMon, these kinds of failures cannot be reliably diagnosed; even a human user would have difficulty realizing something went wrong. The failure monitor described in the next section, however, can notice some of these failures by looking for anomalous behavior in the application.
various EJBs and found that it correctly identified faulty components in most of the cases. When we injected declared exceptions, 80% of the time Pinpoint correctly identified the failed components; for both undeclared exceptions and fail-silent component behavior, 90% of the failures were detected. The remainder were either mis-diagnosed or not detected. The modifications made to JBoss to trace requests for Pinpoint adds a latency penalty of 2-40ms to each client request, depending on the number of components used, and degrades overall throughput by 17% on a mixed workload. Pinpoint’s analysis engine operates on a separate machine and does not directly impact application performance.
3. The Recovery Manager and Recovery Agent As shown in Figure 1, the recovery manager (RM) is an entity external to the application server. It attempts automated recovery and only involves system administrators when automated recovery is unsuccessful. We rely on microreboots for recovery; microrebooting is a good way to recover from most transient failures in Internet systems [4]. The recovery manager listens on a UDP port for failure notifications from the monitors. Using failure information, it builds up a representation of the failure propagation paths through the system in the form of a graph, whose structure is described in section 3.1. After updating the graph, the recovery manager decides which components might have been affected, by determining the connected graph component in which the failed component resides. The RM then activates the stall proxy, simultaneously reboots all the nodes in that connected component, and deactivates the proxy. To effect the reboots, the recovery manager sends reboot signals to a recovery agent. We have one recovery agent at the moment, which resides inside JAGR. It is in charge of microrebooting EJBs by undeploying and redeploying them, upon receiving orders from the RM. In the general case, we expect to have recovery agents for various domains of control, each of them being in charge of rebooting the entities that run in their “jurisdiction.” These entities could range from EJBs to entire Java Virtual Machines (JVMs), or even real machines, in which case the recovery agent would be an IP-addressable power supply. If targetted reboot-based recovery does not work, our framework is designed to employ the notion of recursive reboots [2]. The recovery manager is responsible for initiating coarser grained reboots when it recognizes that previous reboots have not cured a failure. If the recovery manager ends up rebooting the entire system to no avail, it can notify a sysadmin by pager, email, etc. Right now we only have two levels of rebooting: microreboot a small subset of EJBs, or restart the entire application. The RM keeps track
2.3. PPMon: A Pinpoint-Based Monitor The third failure monitor we have implemented is based on Pinpoint [7, 8]. To detect failures, Pinpoint uses coarsegrained tagging of client requests, following their path through the system and tracing their component and resource usages. Using statistical and data mining techniques, Pinpoint analyzes these traced client requests, or paths, to capture the aggregate behavior and structure of the whole system. Pinpoint then compares this behavior and structure to the historically-observed “good” behavior of the system. By looking for anomalies relative to past behavior, Pinpoint is able to detect likely failures without requiring any application-specific knowledge or semantics. Also, because Pinpoint traces every client request separately, it can explicitly compensate for changes in system structure, though not performance, caused by variations in the workload mix. To detect failures, Pinpoint studies the communication patterns of components, looking at which components are calling one another. When the pattern of calls being made to and by a component changes significantly, Pinpoint tags the component as an anomaly and reports it to the recovery manager as a likely failing component. We evaluated standalone Pinpoint by injecting faults into 4
of the previously-rebooted subset of EJB’s and, if the new subset is the same, it chooses to restart the entire application instead of the subset of EJBs. In our limited experiments, however, we have not yet encountered the need for recursive reboots. The RM is also in charge of recognizing repeating patterns and preventing JAGR from going into infinite reboot loops. Though we have not yet seen it occur in our testbed, it is possible for two or more components to form an undetected reboot-failure cycle; e.g., where rebooting one component causes a second to fail, and rebooting the second component causes the original component to fail again, repeating the process. Since we have not encountered this situation in practice, we have not implemented the detection and avoidance of these reboot loops.
consuming manual inspection or by analysis of readilyavailable static application descriptions [3]. estore/control/validatenewaccount estore/control/signout estore/control/verifysignin
MainServlet
estore/control/commitorder
ShoppingCartEJB
estore/control/updateaccount ProfileMgrEJB estore/control/language ShoppingClientControllerEJB
OrderEJB CustomerEJB
CatalogEJB
AccountEJB HttpJspBase SignOnEJB InventoryEJB
3.1. Determining Failure Propagation Paths
InventoryDB EStoreDB
Since the RM reboots failed components along with the components it thinks a fault may have propagated to, it needs to have a representation of the system’s fault propagation paths. However, relying on humans to identify ways in which faults propagate in their systems is unreliable: large scale systems are notorious for exhibiting unexpected failure modes. This section describes in more detail how the RM obtains a failure dependency graph in an application-generic fashion, with no human intervention. Our technique, automatic failure-path inference (AFPI) [3], uses systematic injection of Java exceptions to discover dependencies between EJBs. AFPI is a two-stage process. The first stage is invasive, and relies on controlled, systematic fault injection to cause system components to fail; it takes on the order of hours to run, but requires no a priori knowledge of the application. Monitors report all observed failures to the recovery manager, which then constructs a graph containing components as nodes and inter-component fault propagation as edges. The second, non-invasive stage continues to passively monitor the production system after fault injection has completed, and updates the graph as new failures are observed. This second phase has essentially no performance overhead. During the first phase, the monitors and the RM are not aware that faults are being injected purposely—they react as if the faults were “naturally occurring” and do exactly what they would do during the second phase. Every time the RM receives a failure notification, it augments the fmap, and then decides what to reboot based on the updated f-map. The recovery agent(s) can be selectively disabled during the initial AFPI phase. In applying AFPI to J2EE, we injected Java exceptions into two applications, PetStore and RUBiS. The AFPIgenerated graphs of exception propagation are more detailed and accurate than what could be derived by time-
Figure 2. The AFPI-generated failure propagation map for PetStore 1.1. This is more complete and accurate than a map obtained based on the application’s deployment descriptors. The boxes in the diagram are EJBs, Java Server Pages (JSPs), and/or servlets. Two databases are used, and are shown at the bottom.
In Figure 2 we show one of the maps obtained by AFPI for the e-commerce application. AFPI was able to find components and edges that were not represented in the static deployment information that came with the application. In addition, AFPI ignored several edges incorrectly contained in the deployment information, which could not propagate faults because the components involved did not reference each other. We obtained similar results when applying AFPI to RUBiS. We did not illustrate in Figure 2 the additional information that the recovery manager maintains in the f-map: for each node, it keeps track of how many times the corresponding component was microrebooted, as well as the number of times the components has failed. For each edge in the fmap, the RM keeps track of how many times a fault was detected as having propagated along that edge. This historical information will be used in future versions of the recovery manager to avoid previously-encountered reboot mistakes.
4. Microreboots Rebooting a single component, as opposed to the entire system, is what we refer to as a microreboot. Three-tier Internet systems in general, and J2EE applications in particular, have two structural properties that make rebooting relatively safe: important, persistent state is managed sepa5
rately from temporary state, and the workload is characterized by short-lived, mostly-independent requests.
4.1. Delaying Client Requests
By managing the persistence of important state exclusively in a dedicated persistence tier, three-tier Internet systems guarantee the safety of restarting nodes in the other tiers of the service. This lets us simply (and safely) recover from a range of transient failures in the relatively complicated software of the presentation and application tiers.
During the recovery process, we delay incoming requests with a stall proxy. This keeps clients from seeing failures due directly to the recovery process; instead of a failure, clients perceive an increased latency in the request. This induced latency is finite, as we stall requests for a maximum of 8 seconds (consistent with the “distraction thresholds” identified in [17, 1]), after which we return a failure to the client if recovery has not completed and the request cannot be admitted to the system. This feature is not directly part of the self-management aspect of JAGR, and is not needed for correctness. However, it allows automatic microreboots to happen with minimal impact on the end user. Some failures resulting in recovery will be masked by short delays; the user whose request triggered the failure will still experience an error, but other users may only experience a performance hiccup.
Since the workload on an Internet service consists of many short-lived, mostly-independent requests, the work a service must do is well-partitioned; even if a few requests fail, most clients are unaffected. Additionally, the underlying protocol (HTTP) and most of the application logic is stateless and, except for marked, non-idempotent requests, end-users can safely retry failed requests until they succeed. This lets us reboot components in the system, knowing that any users affected will face only a minor inconvenience. Microrecovery vs. whole-system recovery is meant to reduce time-to-recovery, which in Internet systems is often more important than increasing time-between-failures [9]. We showed in [2] how microreboots can reduce recovery time in a small Java system by up to a factor of four. To see whether a similar benefit could be observed for J2EE applications, we augmented the existing EJB componentization with coarser reboot boundaries, by splitting the application server into three separate subsystems: the JNDI naming service, the Cloudscape database, and the remainder of JAGR.
5. Experimental Validation of JAGR To validate our approach to building a self-recovering application server, we used fault injection to trigger failures and allow JAGR to recover from them1 . The faults we injected were Java exceptions, as these are a high level manifestation of a wide range of underlying faults. We deliberately inject application-level failures, in contrast to work that injects low-level hardware faults. Determining which (if any) application-visible failures result from particular low-level hardware faults requires the construction of a fault dictionary [12], which has proven difficult. The construction of the dictionary is complicated by the many software layers between low-level hardware and the application [10]. While applying the faultload to our system, we replay a workload that exercises the application under consideration. In order to gather these workloads and replay them, we used a combination of a recording proxy and a load generator. The proxy intercepts the interaction of a human user with the application’s web site, and records all these interactions to a workload trace file. The load generator plays back the recorded traces, simulating any number of concurrent clients by forking a separate thread for each one. The clients do not have any think time inbetween requests: as soon as a response is received, the following request is issued. The PetStore trace we used for the experiments shown in this paper captures a multi-hour interaction with the pet store, comprising account creation operations, purchases, account updates, browsing, etc. Since we could not find publicly-available request traces for this application, one
According to informal, empirical observations made by system administrators running large scale J2EE installations, a frequent failure mode is one in which JVMs run out of memory; to recover from this failure, it is often necessary to reboot the affected node. We performed a simple experiment where we compared the time to reboot a whole server node to the times to reboot the various combinations of our subsystems plus the PetStore application; the results are shown in Table 1. All measurements were made on a 4-way multiprocessor (4x550 MHz Intel Xeon), with 1 GB ECC RAM, and 3 SCSI disks. We performed 5 trials for each measurement, and had a variance of less than 1%. Restarted unit Reboot server+JAGR+Petstore Restart JAGR+PetStore Restart PetStore microreboot EJB
Duration 357 seconds 47 seconds 9 seconds
1 second
Fraction 100.0% 13.2% 2.5% 0.2%
Table 1. Restart times at various granularities; microrebooting the smallest application component (EJB) is more than 2 orders of magnitude faster than rebooting the whole server, and 1 order of magnitude faster than restarting the application.
1 All experimental data behind the graphs and anlysis presented here is available at http://www.cs.stanford.edu/˜candea/ papers/jagr.
6
of our colleagues created one by interactively performing a range of operations typical of e-commerce site interactions, though we do not claim that the resulting mix is particularly “representative” (in the benchmarking sense) of an e-commerce workload. For RUBiS, we recorded several traces played by the RUBiS load generator that comes with the software. The workload presented by the load generator simulates a trace of several distinct user sessions executed serially. A session consists of the user logging in, performing various operations, and then leaving the site. Each individual operation is an HTTP request to the service, and its success or failure can be unambiguously detected. When a request fails, our load generator retries that request up to a maximum of 3 times for our experiments, with a 2-second interval between retries. If all attempts fail, the load generator abandons the current session and moves to the next, simulating a customer that re-logs in, or a new customer arriving. In the rest of this section, we will describe two categories of experiments: section 5.1 provides quantitative evidence that JAGR is able to recover automatically, in an application-generic fashion, for both PetStore and RUBiS; the results in section 5.2 suggest that such recovery can improve the end users’ experience.
Figure 3. The client-perceived instantaneous availability of JBoss/PetStore and JAGR/PetStore under three different faultloads. Faults are injected every minute; JAGR manages to successfully and autonomously recover PetStore every time.
pages and images, which are served directly by the front end. All requests that involved application logic embedded in EJBs failed; this means the user was not able to do any useful work, despite sporadic successful requests. To verify that our approach is indeed applicationgeneric, we ran similar experiments on RUBiS, the on-line auction application, after running the automated failurepath inference algorithm to obtain a corresponding f-map. Without making any modifications to either of the two applications, we were able to obtain the same encouraging results. We report here on a more interesting case of selfrecovery. During the experimentation, we noticed that one of our workload traces would cause RUBiS to deadlock often, especially when a large number of users accessed the application simultaneously. Such hangs resulted in the application becoming unresponsive, and the client connections timing out. We did not investigate which specific operations in the workload caused the hangs, but instead relied on JAGR to autonomously recover from the hangs. Its chosen form of recovery was a microreboot of all EJBs in the application, due to the way RUBiS is packaged: all EJBs are in one JAR file. In Figure 4 we show results from running 4 concurrent clients against RUBiS; each client ran on a dedicated CPU. Unlike the experiment shown in Figure 3, here we do not inject any faults, but wait for the application to “naturally” fail, and then allow JAGR to recover. Using a similar illustration method as in Figure 3, we show vanilla JBoss/RUBiS’s behavior in the top part, and our JAGR/RUBiS’s behavior in the bottom part. In each diagram there are four timelines, one for each client (shown as C0, C1, C2, and C3). Although the workload is identical
5.1. Application-Generic Recovery Our first goal was to determine whether JAGR is able to recover correctly from observed failures. We chose three different faultloads that exercise different parts of PetStore, and injected them into both unmodified “vanilla” JBoss and JAGR. Each faultload consisted of 5 faults, and we injected one fault every minute. Figure 3 illustrates the instantaneous availability for the systems, when placed under faultload and workload. Time runs left to right, and we show a total of six timelines, two for each faultload. The top timeline within each faultload is for vanilla JBoss, while the bottom timeline is for JAGR. The bands indicate how the test client perceived the system at each point in time: a solid band indicates the system appears to be available and successfully executing client requests, and a gap indicates the server is perceived as being down. This experiment suggests that JAGR is able to selfrecover and allow its clients to continue doing useful work after recovery. While JAGR was able to fully recover after every injected fault, vanilla JBoss/PetStore no longer functioned correctly after the first injected fault. Human intervention or a coarse reboot, which has a higher latency than our self-recovery, would be needed to resolve these failures. The sparse impulses of availability on JBoss’s post-failure timelines correspond to some requests completing successfully even after failure; these are requests for static HTML 7
Figure 5. JAGR can improve end user experience by offering them the illusion of continuous availability. Fast and effective recovery helps mask the injected fault from clients C1 and C2.
already noticed the exception. The recovery manager instructed the stall proxy to hold up the other requests; once recovery completed, the stalled requests were admitted to the system and user C0 successfully retried her failed request. The net effect on users C1 and C2 was a delay of 3.3 seconds in serving their requests. Since this is below the 8-second distraction threshold discussed in section 4.1, it is fair to say these users did not notice the failure. Hence, fast recovery in conjunction with a brief stall was able to mask the failure from some of the system’s users. If a more heavy weight, non-microreboot recovery had been employed, the delay would have been perceptable and would have resulted in end-to-end visible failures. To characterize these effects in more general terms, we compared the performability [16] of JAGR/RUBiS to that of JBoss/RUBiS. To do so, we measured the successful request throughput, or “goodput,” while the system was under load and experiencing faults. The faultload was the same for both platforms and the three faults were injected every 2 minutes. The workload consisted of 10 users executing exclusively read-only requests, to avoid the deadlock problems described in section 5.1. In Figure 6 we plot the goodput for JBoss (left side) and JAGR (right side). We computed average throughput over 10-second intervals, to amortize the variability resulting from our relatively small user population. The area under the throughput curve represents the number of requests that were successfully completed during that interval. In the vanilla JBoss case, as soon as our monitors detect a problem, the JBoss server automatically gets rebooted. For a human-administered system, this is very optimistic: detection time is practically zero and it assumes the administrator does not fumble with the system before rebooting. Unlike JAGR, the system does not have enough time to ramp back up to its original performance after reboot. This is in part due to the rebooted server having to page in Java classes, recompile servlets, etc. as well as due to the clients, who have difficulty picking up the work where they left off, because of the highly disruptive reboot. JAGR au-
Figure 4. JAGR recovers on its own from naturally occurring deadlocks in RUBiS. The top half shows instantaneous service availability of JBoss/RUBiS, as perceived by each of the 4 clients; the bottom half shows the same for JAGR/RUBiS. Deadlock occurred 3 times when running on JAGR, and it was able to recover every time, unlike JBoss/RUBiS, which hung right after the first deadlock, denying application access to all clients throughout the remainder of the run.
in the two runs, the precise sequence of events inside the server and application is not the same, because of nondeterministic interleaving of client requests and potential race conditions inside the application. This explains why the occurrence of the first deadlock does not line up for the two different systems. The condition that causes the hangs is the same every time, and the server logs indicate that the hang in the JBoss/RUBiS case is the same type as the 3 hangs experienced in the JAGR/RUBiS case.
5.2. Self-Recovery Improves End User Experience The experiments in the previous section illustrated JAGR’s ability to recover unassisted, and they suggested that users may be able to get more work done when the server recovers on its own. In this section we try to see just how much better a self-recovering application server can be. In one of our RUBiS runs, we encountered a case where one user’s detection of a failure enabled the complete masking of that failure from all other users. Figure 5 shows three timelines corresponding to three concurrent clients, C0, C1, and C2. We injected a fault into the server (specifically, a NullPointerException to simulate a real-life data corruption error) during one of C0’s requests. Since E2EMon is embedded in the load generator, this failure was detected and reported to the recovery manager, which had 8
JAGR: automatic self-recovery
70
70
60
60
Requests/sec
Requests/sec
JBoss: manual recovery
50 40 30 20 10 0
50 40 30 20 10
1
2
3
4 5 Time [minutes]
6
7
0
8
1
2
3
4 5 Time [minutes]
6
7
8
Figure 6. JAGR improves service performability. The shaded area under the curve represents the total number of requests that succeeded; JAGR/RUBiS did 78% better than JBoss/RUBiS, and maintained a goodput of at least 20 requests/sec, even in the face of faults.
tomatically microreboots RUBiS’s EJBs, without affecting the server; notice how JAGR’s goodput never drops below 20 requests/sec, because recovery is fast and the stall proxy maintains the illusion of availability for part of the client population. To compute the total number of requests successfully completed during the observation period, we simply need to compute the area under the throughput curve. This yields a total of 14,243 requests for JBoss-managed RUBiS, and 25,295 requests for JAGR-managed RUBiS, which represents a 78% improvement for this particular experiment. If we assume that an increase in successful requests translates somehow into an increase in end user satisfaction, we can argue that running J2EE applications on JAGR, our enhanced version of JBoss, can offer service providers a competitive advantage.
ager) the policy decisions as to what should be rebooted to attempt recovery. Since we are interested in supporting any unmodified J2EE applications, which are not written to any checkpointing API, our recovery is generic—successively reboot larger subsystems until the fault goes away or we have rebooted the entire system—but our failure detection offers room for refinement. The SEDA [23] project recognized the value of moving certain behaviors (admission control, load balancing, etc.) into the runtime system, such that all applications running on that platform would benefit. In SEDA’s case, applications had to be written in an event-driven continuationpassing style; admission control and load balancing could then be done implicitly by the SEDA middleware. However, this requires recoding the application in a somewhat nonintuitive programming style. In JAGR, no application modifications are required. Since we have implemented a pluggable monitoring framework in JAGR, the monitors presented here are strictly complementary to other failure detection techniques. The most common techniques for detecting failures in Internet services are low-level monitoring, such as heartbeats and pings, and periodic high-level, end-to-end application checks [15]. Heartbeats and pings have the advantage of being simple to implement and easy to maintain. However, they lack the ability to detect many application-level failures. Complex, end-to-end tests that make use of detailed application semantics are able to detect applicationlevel failures, but, since they must be redeveloped for individual applications, they are expensive to build. In addition, they require significant maintenance to keep up-to-date with rapidly evolving applications.
6. Related Work Redundancy and failover [15] are a staple of Internet services and the most popular tool in reducing downtime. The techniques presented here are complementary to that strategy, since failed nodes must eventually be recovered to restore system throughput, as well as close the “window of vulnerability” associated with operating under partial failure. The CNN.com meltdown on 9/11/01 [13] is a good example of how slow node-level recovery time can lead to the entire service collapsing. ARMOR [24] provides some application-generic services, such as liveness monitoring and reboot, to distributed applications. It provides checkpoint-based recovery to applications written to ARMOR’s micro-checkpointing API, including ARMOR itself (i.e., the ARMOR middleware modules can recover from their own checkpoints). Compared to ARMOR, we are attempting to detect more classes of failures via the use of different types of plug-in failure monitors, and collecting in one place (the recovery man-
7. Conclusion We have presented an initial implementation of JAGR— JBoss with Application-Generic Recovery. JAGR com9
bines application-generic failure-path inference (AFPI), path-based failure detection, and microreboots. AFPI uses controlled fault injection and observation to infer paths that faults follow through a J2EE application. Path-based failure detection uses tagging of client requests and statistical analysis to identify anomalous component behavior. microreboots are fast reboots we perform at the sub-application level to recover components from transient failures; by selectively rebooting only those components that are necessary to repair the failure, we reduce recovery time. These techniques are designed to be autonomous and applicationgeneric, making them well-suited to the rapidly changing software of Internet services. We have shown that JAGR can improve the availability of two J2EE applications. Although E2EMon, one of our monitors, is not entirely application-generic, the JAGR infrastructure itself is application-agnostic. We expect that, as more plug-ins are developed, we will be able to broaden the class of failures from which automated recovery is possible. In the future we also intend to take JAGR to the realm of clusters and explore the benefits it can offer in that context. We also want to enable the recovery manager to better utilize historical information about its own actions (such as “rebooting component � has never cured failures in the past”) in its decision making. Internet applications, our domain of choice, have been increasing in complexity at a rapid pace, and are subject to continuous evolution even after deployment. Under such circumstances, we hope that JAGR’s self-healing property can insulate service administrators and users from the intricacies of the applications they run and use. We hope to bring such self-recovering software to a wider user community by making JAGR available in a future JBoss release.
[7]
[8]
[9] [10] [11] [12]
[13] [14]
[15] [16] [17] [18]
[19]
References [1] N. Bhatti, A. Bouch, and A. Kuchinsky. Integrating userperceived quality into web server design. In Proc. 9th International World Wide Web Conference, Amsterdam, Holland, 2000. [2] G. Candea, J. Cutler, and A. Fox. Improving availability with recursive microreboots: A soft-state system case study. Performance Evaluation Journal, 56(1-3), March 2004. [3] G. Candea, M. Delgado, M. Chen, and A. Fox. Automatic failure-path inference: A generic introspection technique for software systems. In Proc. 3rd IEEE Workshop on Internet Applications, San Jose, CA, 2003. [4] G. Candea and A. Fox. Recursive restartability: Turning the reboot sledgehammer into a scalpel. In Proc. 8th Workshop on Hot Topics in Operating Systems, Elmau/Oberbayern, Germany, 2001. [5] E. Cecchet, J. Marguerite, and W. Zwaenepoel. Performance and scalability of EJB applications. In Proc. 17th Conference on Object-Oriented Programming, Systems, Languages, and Applications, Seattle, WA, 2002. [6] S. Chandra and P. M. Chen. Whither generic recovery from application faults? A case study using open-source software.
[20] [21] [22] [23]
[24]
10
In Proc. International Conference on Dependable Systems and Networks, New York, NY, 2000. M. Chen, E. Kiciman, A. Accardi, A. Fox, and E. Brewer. Using runtime paths for macro analysis. In Proc. 9th Workshop on Hot Topics in Operating Systems, Lihue, Hawaii, 2003. M. Chen, E. Kiciman, E. Fratkin, E. Brewer, and A. Fox. Pinpoint: Problem determination in large, dynamic, Internet services. In Proc. International Conference on Dependable Systems and Networks, Washington, DC, June 2002. A. Fox and D. Patterson. When does fast recovery trump high reliability? In Proc. 2nd Workshop on Evaluating and Architecting System Dependability, San Jose, CA, 2002. C. Fu and R. M. et al. Compiler-directed program-fault coverage for highly available internet applications. Technical report, Rutgers University Computer Science Dept., 2003. JBoss. Homepage. http://www.jboss.org/docs, 2002. Z. Kalbarczyk, R. K. Iyer, G. Ries, J. Patel, M. Lee, and Y. Xiao. Hierarchical simulation approach to accurate fault modeling for system dependability evaluation. IEEE Transactions on Software Engineering, 25(5):619–632, September/October 1999. W. LeFebvre. CNN.com—Facing a world crisis. In 15th USENIX Systems Administration Conference, 2001. Invited Talk. D. E. Lowell, S. Chandra, and P. M. Chen. Exploring failure transparency and the limits of generic recovery. In Proc. 4th USENIX Symposium on Operating Systems Design and Implementation, San Diego, CA, 2000. E. Marcus and H. Stern. Blueprints for High Availability. John Wiley & Sons, Inc., New York, NY, 2000. J. F. Meyer. On evaluating the performability of degradable computer systems. IEEE Transactions on Computers, C29:720–731, Aug 1980. R. Miller. Response time in man-computer conversational transactions. In Proc. AFIPS Fall Joint Computer Conference, volume 33, 1968. V. S. Pai, A. L. Cox, V. S. Pai, and W. Zwaenepoel. A flexible and efficient application programming interface for a customizable proxy cache. In Proc. 4th USENIX Symposium on Internet Technologies and Systems, Seattle, WA, 2003. D. Patterson, A. Brown, P. Broadwell, G. Candea, M. Chen, J. Cutler, P. Enriquez, A. Fox, E. Kiciman, M. Merzbacher, D. Oppenheimer, N. Sastry, W. Tetzlaff, and N. Treuhaft. Recovery oriented computing (ROC): Motivation, definition, techniques, and case studies. Technical Report UCB/CSD-02-1175, UC Berkeley, Berkeley, CA, March 2002. SourceForge.Net. The world’s largest open source software development repository. http://www.sourceforge.net/, 2003. Sun Microsystems. J2EE platform specification. http://java.sun.com/j2ee/, 2002. Sun Microsystems. Java Pet Store Demo. http://developer.java.sun.com/developer/releases/petstore/, 2002. M. Welsh, D. Culler, and E. Brewer. SEDA: An architecture for well-conditioned, scalable Internet services. In Proc. 18th ACM Symposium on Operating Systems Principles, Banff, Canada, 2001. K. Whisnant, S. Bagchi, B. Srinivasan, Z. Kalbarczyk, and R. Iyer. Incorporating reconfigurability, error detection, and recovery into the Chameleon ARMOR architecture. Technical Report CRHC-98-13, University of Illinois at UrbanaChampaign, 1998.