Run-Time Monitoring for Dependable Systems an Approach and a Case Study Jorge Rady de Almeida Jr. USP / Escola Politécnica - São Paulo, Brasil
[email protected] Abstract This paper describes a run-time monitoring system designed for same functionality systems installed in different places that use equivalent hardware configurations, but with slightly different implementations. These systems exhibit common characteristics. They are large software systems, they depend on hardware to execute theirs functions, and they are usually adjusted to meet new user needs. In this scenario it is unreasonable to assume that software testing will uncover all latent errors. Besides gathering information about a target program as it executes the run-time monitoring system proposed provides information about the target operating system and the target hardware in order to improve availability by reducing time to diagnose failures and provide a system with the reactive capability of reconfiguring and reinitializing after the occurrence of a failure. A case study for an Automatic Teller Machine system is discussed as an application of the run-time monitoring system and the results from this application are presented.
1. Introduction Reliability and availability are essentials characteristics for computer systems operation. A runtime monitoring system contributes for improving reliability and availability, respectively, by continuous failure detection and by reducing time to diagnose failures. In most systems, the savings in ground support and maintenance costs offset the initial cost of hardware and software monitoring system in a year [2]. Savings in ground support costs are achieved by reducing manual diagnostic costs. The run-time monitoring system will automatically identify failures as they happen in normal operation. Thus, support personnel spend less time and money in troubleshooting failures. This also results in reduced turn-around times and improved system availability. The work described in this paper was carried out at the STABE, Banco Itaú S.A., São Paulo, Brasil.
Sérgio Ricardo Rota Banco Itaú S.A. / STABE - São Paulo, Brasil
[email protected] Savings in maintenance are achieved by reducing the number of errors that are not easily reproducible in laboratory conditions. Certain failures manifest only under determined specific operational modes or stress conditions, e.g., at a certain resonant frequency. Such conditions are difficult to be duplicated off-line. Consequently, current maintenance procedures may fail to diagnose them, resulting in the need for re-certification of possibly faulty systems and recurring test expenses. The run-time monitoring system will be able to detect a failure when it manifests itself in actual operation. This paper describes a run-time monitoring system designed for same functionality systems installed in different places that use equivalent hardware configurations, but with slightly different implementations. Typical examples of systems like these are Automatic Teller Machines (ATM), Automatic Response Unit (ARU), and Point of Sales terminals (POS). The most common way to validate a software system is testing. Systematic testing activities can uncover errors and thereby improve the resulting software’s quality. However, testing cannot be used to guarantee that the system is error-free, since its infeasible to completely test the entire system due to the large number of behaviors [19, 20]. Also, as the functionality and structure of software becomes complex in order to satisfy a broad range of needs, testing itself needs to be sophisticated enough to check according to diverse criteria. For example, for testing a mathematical function, it is usually sufficient to check the produced outputs against the inputs, but when we test a real-time application, we also have to check the timing behavior. In this scenario, besides gathering information for debugging and test purposes, the use of a run-time monitoring system can increase the availability of a system by detecting and recovering it from errors [2, 3, 10, 15, 18]. Section 2 describes the monitoring classification and approaches. Section 3 presents the run-time monitoring system architecture. Section 4 discusses a case study for an Automatic Teller Machine system. Section 5 presents the main results obtained from a run-time monitoring system application.
2. Background Monitoring gathers information about a computational process as it executes and can be classified by its functionality. Dependability includes fault tolerance and safety. Performance enhancement includes dynamic system configuration, dynamic program tuning, and online steering. Correctness checking is the monitoring of an application to ensure consistency with a formal specification. It can be used to detect run-time errors or as a verification technique. Security monitoring attempts to detect security violations such as illegal login or attempted file access. Debugging and testing employs monitoring techniques to extract data values from an application being tested. Performance evaluation uses monitoring to extract data from a system that is later analyzed to assess system performance [15, 16]. We focus on two of these six functional areas: dependability, and debugging and testing. Furthermore, we can classify the monitoring approaches as hardware, software, and hybrid monitoring [15, 17]. Hardware monitoring requires an instrumentation of the hardware platform on which the target program runs. The monitoring system consists of the monitoring hardware and a software monitoring control module and is separated from the target system. The execution of the target program is monitored directly via the monitoring hardware, which is connected to the system buses without any embedded instrumentation code. The monitoring system and the target system do not share any computational resources. Consequently, the hardware monitoring approach causes no intrusion or minimum monitoring intrusion on the execution of the target program and is the most suitable approach for systems with stringent real-time constraints. The disadvantage of hardware monitoring is the cost and the inherent limitations of hardware. Hardware monitoring is usually machine dependent or at least processor architecture dependent [12, 15, 17]. Software monitoring requires an instrumentation of the application source code. The instrumentation code is inserted into the target program by means of instrumentation software. The generated events of interest are detected as well as processed by the target system. Because the monitoring system is part of the target system, software monitoring will introduce an overhead on the target system’s processing time and memory space, as a result of the execution of additional instrumentation code and the execution of event detection and event processing. This intrusion may change the event ordering and timing of the target program, which is unacceptable in many hard real-time systems. The advantage of the software monitoring approach is that it is flexible and requires no additional hardware [1, 15, 17].
In hybrid monitoring both software and hardware are used to perform monitoring activities. Hybrid monitoring approach employs software to specify the events to be detected in the monitored target program in conjunction with dedicated hardware devices to identify and to process these events. Hybrid monitoring approach brings together the non-intrusive nature of hardware monitoring approach and the flexibility of software monitoring approach. In this approach, the instrumentation code is executed as a part of the of the target system, while event detection and processing are performed by a separate monitoring hardware [6, 15, 17].
3. Run-time monitoring system Monitoring target systems that do depend on hardware to execute theirs functions and must present high availability degree is the goal of the run-time monitoring system described in this paper. Thus, the monitored information includes the run-time behavior of the monitored program and pertinent information from the operating system, from the hardware platform and from the computing resource consumption. The run-time monitoring system must attend to the following requirements: to monitor the target program execution, to collect target hardware platform information, to monitor the computing resource consumption, to increase the target system availability, and to be a flexible monitoring framework.
3.1. Monitoring approach selecting Event detection and processing can be performed in a number of different ways, each of them causing a different amount of interference with the system under monitoring. The optimal solution for monitoring with respect to interference is a hardware monitor that is able to detect events without affecting the activity of the system under monitoring. This is accomplished usually by passively monitoring the target processor’s data, address, and control buses. However, most state changes of the software are not reflected by signals on externally accessible signal lines, but they result only in some on-chip operations. Often, a lot of different logical events are mapped to the same measurable physical event, for example, access to the same memory location from different contexts. If the internal state of the system context must be known to detect an event, software monitoring approach is needed. To overcome these problems a hybrid approach could be used. This approach suffers the same architecture adaptability limitations as the hardware monitoring approach, though. So, the monitoring system ends up being target specific and therefore very expensive in the
most of cases. Besides that, the observations will be on a very low level of detail. In order to test and debug a system at satisfactory levels of reliability we fundamentally need to observe the system. Including instrumentation code in the software (application and kernel), we can observe significantly more than possible with hardware monitoring approaches. Also, to properly execute this function, the monitoring system must be an integral part of the target system. Thus, for most application domains, pure software monitoring seems to be the better solution. Different from hardware monitoring systems, software monitoring systems are easier to change, and many changes can be made without adding new components. When a system is replicated or located in a physical place that is hard to reach, it is far easier to make changes in software than in hardware. Besides that, software monitoring approach flexibility makes it possible to provide more information to programmers and to provide information in a more useful form.
3.2. Monitoring framework contributions The monitoring framework intend to present the following main contributions: 1) To outline the run-time monitoring utilization importance: Besides being a useful testing and debugging tool, to improve availability by reducing time to diagnose failures and provide a system with the reactive capability of reconfiguring and reinitializing after the occurrence of a failure is the main goal of the run-time monitoring system [18, 21]. 2) To collect hardware platform information: Sometimes a software error arises from a hardware failure. The more hardware technologies evolve the more difficult to reproduce all the system’s combinations of hardware components. In this context, hardware platform information can be valuable debugging information. 3) To monitor the computing resource consumption: During its execution, a system can face abnormal resources consumption and can fails in these stress conditions. Such conditions are hardly reproduced in laboratory. Incorrect use of resources, especially memory, can compromise the target system availability. Information obtained from the monitoring log files can be used to implement program mechanisms to treat these situations.
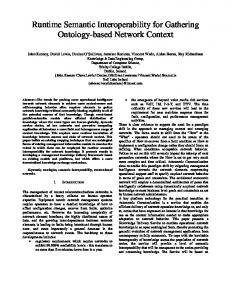
3.3. Architecture overview The run-time monitoring system architecture presented in Figure 1 consists of five major components and some interactions between them. In the following, we identify the functionality of each component and describe the interactions among them.
Figure 1. Run-time monitoring system architecture The hardware information collectors are responsible for obtaining target hardware platform information. Every hardware subsystem (CPU, memory, disks, etc) has a specific hardware information collector module. From this information we can improve the hardware management process, what means to evaluate the impact caused by an obsolete or faulty hardware component replacement, to follow up hardware component replacement, to determine the amount of equipment that supports new capabilities or enhancements like higher video monitor resolution and power energy save, to detect the use of hardware components not homologated, and to verify if hardware components are not being replaced for others with lower levels of performance and capacity. The sensors represent the instrumentation code, they are small code stretches inserted in the target program in order to detect events of interest. A sensor observes the behavior of a small part of the target program state space. A sensor is activated by a change on the entity it is observing such program variables, functions calls, interruptions occurrence, etc. Thus, the sensors are placed in the points where changes in the entities under observation can occur. The run-time monitor adopts the statically and manual instrumentation. That is, the programmer reads the program source code and inserts the sensors before the system is executed [7, 9]. Considering the event detection, whose occurrence is generated by the target operating system, as long as the source code of the operating system kernel is available, e.g. Linux, the code can be analyzed and the sensors can be placed at the right locations. Thus, this newinstrumented kernel can be used as the target operating system. As long as the kernel provides hooks, that means, debugging API, e.g. VxWorks, the operating system instrumentation can be done by using this API. If neither
approach is available, e.g. Windows NT, the operating system instrumentation must be done by using kernel device drivers. The filter receives the events detected by the sensors and it is responsible for selection, reduction and storage of trace data pertinent to the events of interest. Event record descriptions and selection rules are used to specify the criteria for data selection and reduction. Thus, users can save only the events that match certain criteria. For example, one user may only want to save events generated by a specific process, or events generated at a specific time interval. The filter interprets the selection criteria and decides which event traces are to be kept and which are to be discarded. Among the information associated to the events we can mention the following: source code file name, line number, event occurrence instant, event type (error, warning, or information), event source process identification and specific information like variable values and control flow information. The monitoring script describes how the target system requirements are monitored. In order to monitor and to verify the fulfillment of the target system requirements, referring information about the events that occur in the target system and about the states covered for the target system execution must be collected and the relations between the events and the states must be explicitly specified in the monitoring script. For example, a system execution can be expressed in terms of its processes execution. So, one form to monitor the system execution is to verify if its processes are being executed correctly. Figure 2 shows a system composed of three processes Pa, Pb, and Pc that must execute in a specific sequence. In this sequence of execution, the regions R1, R2, R3, and R4 represent states that must be crossed by the system inside specifics intervals of time: t1, t2, t3, and t4, respectively. If the system remains in some of the states represented by regions R1, R2, R3, and R4 for an interval of time bigger than the biggest value in the set t1, t2, t3, and t4, that means an error in the system execution.
Thus, monitoring the system execution with a sample period bigger than the biggest value in the set t1, t2, t3, and t4 is enough to verify the system execution. Figure 3 represents a monitoring script stretch used to verify the example discussed above. As shown in Figure 3, the sample period value for the state represented by region R1 is 40 seconds and the error code for this situation is E0h.
Figure 3. Monitoring script stretch The run-time checker verifies if a system execution belongs to a set of acceptable behaviors based on the requirements specification. This component congregates the information about event occurrence generated by the target system execution, the hardware platform information, and computing resource consumption information in order to check the target system execution. The log information repository is responsible for the event occurrence information storage. It can be as simple as a buffer or a queue or as sophisticated as a relational database.
4. Case study This case study presents the results obtained from the run-time monitor system utilization for an Automatic Teller Machine (ATM) system. The ATM system has been chosen as the target system because it must present high availability levels, it must be a reliable system, it depends on hardware to execute its functions, and it is usually adjusted to meet new user needs. As shown in Figure 4, the monitoring system comprises the run-time monitoring system, a TCP/IP communication infrastructure (one instance per monitored ATM), and a remote monitoring user console. Figure 2. System execution example
Figure 5. ATM diagram Figure 4. Monitoring system components The remote communication infrastructure represented in Figure 4 allow transferring log files from each monitored ATM system to the central monitoring console, transferring a specific monitoring script from the central monitoring console to a particular ATM system, and ATM remote initialization.
4.1. Target system description As shown in Figure 5, an ATM system can be seen as a computer attached to some peripherals (journal printer, magnetic stripped card reader, cash dispenser, etc). The ATM system described in this case study uses Intel x86 architecture as hardware platform and Microsoft Windows 2000 as software platform. From the technical point of view, Windows 2000 can be considered one of the most difficult target operating system for instrumentation, as its monitoring tools are not sufficient to provide detailed traces of system events with accurate time-stamps, it does not include predefined hooks for installing sensor code (like VxWorks), and it is not available in source code (like Linux). As the ATM system depends on hardware to execute their functions, the system design is based on WOSA/XFS (Windows Open Services Architecture Extensions for Financial Services) that defines a general architecture for access to service providers from Windows-based applications. Since these devices are often complex, difficult to manage and proprietary, the development of a standardized interface between them and both Windows-based applications and Windows operating systems can offer for financial institutions and their solution providers immediate enhancements to productivity and flexibility.
4.2. Target system monitoring requirements In the target system requirements specification phase the following requirements have been chosen to be monitored: ATM system availability, peripherals reliability, hardware configuration, and resources consumption (CPU, memory, and disk space). The ATM system availability can be measured by monitoring some events: abnormal processes sequence execution, time out from peripherals, deadlock, endless loop, abnormal use behaviors, loss of events and messages, etc. Peripherals reliability can be measured by monitoring relating peripherals firmware versions to the errors presented by each peripheral model. Thus, adjusting maintenance efforts, peripherals reliability can be improved. Besides that, this function guarantees that only homologated peripherals are used. The hardware configuration monitoring aims to guarantee the quality of service to the ATM system’s users, that is, to offer a satisfactory system performance. Also, hardware configurations below the minimum recomendation hardware configuration can result in errors whose analysis is difficult to make. So, the starting point for the debugging process is the minimum hardware configuration verification. In addition, this monitoring allow evaluating the impact caused by an obsolete or faulty hardware component replacement. Finally, the CPU, memory, and disk space consumption monitoring aims to detect a bad use of the computing resources that can compromise the target system performance. Among the problems that can be detected we have: memory leakage, unnecessary generation of log information, exaggerated use of visual resources, unnecessary execution of code stretches, and use of inefficient code constructions, e.g. polling instead interruptions, messages or events. In addition, the computing resources monitoring can detect errors in the operating system execution.
4.3. Design and implementation The hardware information collectors are implemented as a set of DLLs, one for each hardware subsystem (CPU, memory, disks, peripherals, etc) and the Registry of each equipment is used as hardware information repository data. In order to reduce the interference in the target system execution, the collection of hardware information is made during the system initialization and seeking a reduction in the network traffic this information is updated only when some alteration occurs. Figure 6 shows hardware information repository data.
Figure 8. Instrumented target program method
Figure 6. Hardware information repository data Sensors at target program level collect information such as source file name, line number in the source file, event occurrence time, event type (error, warning, or information), process identification and specific messages to monitor data variable values or control flow. Figure 7 shows sensor code example and Figure 8 shows an instrumented target program method.
Figure 7. Sensor code example
To reduce the interference in the target system execution, the instrumentation sensors code (at target program level and at target operating system level) are designed acording the following rules: all function calls are replaced by the inline specifier, information associated to the events of interest are stored directly in a local memory and the number of system calls, instructions, access to the memory and execution in protecting states are reduced to the lowest possible amount. The log information repository is implemented through the Event Viewer. This design option reduces the interference caused by the run-time monitoring system, once the log information is stored in memory. Also, Event Viewer has an intrinsic discrimination mechanism that allows seeing graphically error, warning, and information events. Finally, this component is available since operating system starting. As previously discussed, the monitoring script is implemented as a XML file. In order to guarantee that all events of interest can be monitorated since system starting, the run-time checker is implemented as a set of operating system services and devices drivers. Thus, the run-time checker has unrestrictedly access to all system components.
4.4. Results The ATM system makes over 500 different banking transactions types. So, excepting common operations (cash, balance verification, payments, etc), the users exhibit a very diversified profile, that is, even if a specific transaction presents an error, the great part of the ATM system's users can make their transactions normally. In this scenario, three forms to recovery errors can be used by the run-time monitoring system.
The first form comprises the system restarting after its reconfiguration, that is, once the run-time monitoring system detects a transaction that is causing an error, this transaction is deactivated and the system is restarted [18, 21]. The second form comprises only the system restarting for errors whose occurrence cannot be determined in a deterministic way. Typical errors like this are endless loops, deadlocks, exceptions, and abnormal use behaviors. Some behaviors can be classified as an abnormal use behavior. For example, if many ATM system’s users pass the magnetic stripped card to start a session and after that they deliberately abandon the session in the inquiry password screen, probably the touch screen is not working properly. Besides that, this recovery form covers errors related to strange hardware conditions (rare or transient device fault), limit conditions (out of storage, counter overflow, lost interrupt, etc), and race conditions [5]. Finally, the third form comprises peripherals restarting if events and messages are missed and excessive time outs from peripherals are occurring. As shown in Figure 9, these three recovery forms had revealed efficient. In the unavailability ATM system curve we can see that ATM system unavailability had been decreasing at 0,06% per month. When the run-time monitoring system was introduced the unavailability fell down from values between 2,75% to 3,00% to values between 1,75% to 2,00%.
Figure 10. Errors per peripheral tax [8] In addition, as the run-time monitoring system collects hardware platform information, it is possible to make an ATM system inventory and thereby control all hardware components and software modules present in the ATM system. This feature has been shown very important for technical assistance personnel. As shown in Figure 11, this feature allows verifing if there is an ATM system making use of not homologated hardware components, to follow up a faulty hardware component replacement, and to know the ATM system profile.
Figure 11. ATM system inventory Figure 9. ATM system unavailability curve [8] From the data gathered by the run-time monitoring system it is possible to verify if an error is associated to a particular peripheral and to focus the maintenance efforts in this peripheral. As shown in Figure 10, this approach produced a decrease in the tax of errors per peripheral.
5. Conclusions The run-time monitoring system has reached its primary objectives. As seen in the case study, the ATM system availability has increased. Also, savings in ground support and maintenance costs have been achieved by reducing manual diagnostic costs and by reducing the number of errors that are not easily reproducible in laboratory conditions, once the system dynamic behavior is logged by the run-time monitoring system. Considering
a medium port development team (15 developers), where the average cost is almost US$ 25/hour/developer, and a reduction by 30% in the average time for debugging errors, run-time monitoring system has saved US$ 19,800/month diagnostic costs. Besides that, the overall system reliability has increased because peripherals operation monitoring allows increasing their reliability.
5.1. Run-time monitoring system interference Another important result is the run-time monitoring system applicability. The goal in the run-time monitoring system design and implementation was the interference minimization as far as possible. However, as shown in Table 1, a benchmark realized on a 733 MHz Pentium III with 128 Mb of RAM and 10 Gb disk, outlined that the interference is significant. Table 1. Run-time monitoring system interference Time Time With Without Monitor Overhead Monitor Monitoring at target program level
Operation
Write 1 kb file Read 1 kb file
839,68 µs
933,72 µs
11,2%
9,5% 238,71 µs 261,39 µs Inquiry a 10,7% 193,64 µs 214,36 µs peripheral Create one 14,9% 81,38 µs 93,52 µs registry key Monitoring at target operating system level Map memory to user mode Install a device filter
3,64 µs
3,75 µs
3,0%
2,28 µs
2,34 µs
2,6%
Despite this interference, the run-time monitoring system architecture proposed can be an attractive monitoring tool in order to support development and maintenance activities. Mainly for Windows 2000 equivalent operating systems that are not available in source code neither provides sufficient debugging API, but are an attractive software platform solution for many soft real-time and embedded systems solutions. Besides that, the run-time monitoring system contributes to increase the overall system availability and reliability [4]. 5.2 Future work The time needed to develop the run-time monitoring system (2,640 hours) represents 9.6% of the time needed to develop the ATM system (27,456 hours). Mainly, two
factors contribute for this. First, some parts of the runtime monitoring system are device drivers and operating system services, whose development is considerably complex. Second, the run-time monitoring system test phase deserves special attention. In this scenario, to transform some parts of the runtime monitoring system in Commercial-Off-The-Shelf (COTS) software modules would represent lower development costs and shorten development cycles. Two directions in which research must advance are target system intrusion analysis and testing methods for these COTS [11, 13]. Run-time monitoring systems are especially well suited to known, expected hazardous conditions. Detection of unexpected, hazardous scenarios is more difficult. The use of a run-time monitoring system to compare a system's expected state with its sensed state and request action if the difference is unacceptable offers promise in this field. Besides that, run-time monitoring techniques can identify evolving conditions that may threaten the system, deviations from safety requirements, and operational usage that is inconsistent with the safety assumptions [13, 14]. Acknowledgments. Conversations with many people have helped to develop the run-time monitoring system described in this paper. Among them are Flávio Kitahara Sousa, Roberto Santos Castro, Júlio Cézar Boix do Nascimento, Eduardo Hideki Ito, Mário Bonini Biazzi and Roberto Hitoshi Takeda. In addition, we are thankful to Paulo Sérgio Muniz Silva and Selma Shin Shimizu Melnikoff for their constructive suggestions.
6. References [1] CHODROW, S. E.; JAHANIAN F.; DONNER, M. RunTime Monitoring of Real-Time Systems. Proceedings of the 12th Real-Time Systems Symposium, p.74–83, Dec. 1991. [2] DEB, S.; GHOSHAL, S.; MALEPATI, V. N.; KLEINMAN, D. L. Tele-Diagnosis: Remote Monitoring of Large-Scale Systems. Proceedings of IEEE Aerospace Conference, Mar. 2000. [3] FINKELSTEIN, A.; KRAMER, J. Software Engineering: a Roadmap. Proceedings of the Conference on The Future of Software Engineering, p.3–22, May 2000. [4] GERGELEIT, M.; NETT, E. JewelNT: Monitoring of Distributed Real-Time Application on Windows NT. Proceedings of the 3rd Annual IASTED International Conference on Software Engineering and Applications, p.325– 328, Oct. 1999. [5] GRAY, J. Why Do Computers Stop and What Can Be Done About It? Proceedings of the 5th Symposium on Reliability in Distributed Software and Database Systems, p.3–12, Jan. 1986. [6] HABAN D.; WYBRANIETZ, D. A Hybrid Monitor for Behavior and Performance Analysis of Distributed Systems.
IEEE Transactions on Software Engineering, v.16, n.2, p. 197– 211, Feb. 1990. [7] HARKEMA, M.; QUARTEL, D.; GIJSEN, B. M. M.; VAN DER MEI, R. D. Middleware Performance Analysis: Performance Monitoring of Java Applications. Proceedings of the 3rd International Workshop on Software and Performance, p.114–127, Jul. 2002. [8] ITAÚ Self-Service Equipment Errors Report. São Paulo, Banco Itaú S.A., 2003. s.n.t. [9] KIM, M.; VISWANATHAN, M.; BEN-ABDALLAH, H.; KANNAN, S.; LEE, I.; SOKOLSKY, O. MaC: A Framework for Run-Time Correctness Assurance of Real-Time Systems. Philadelphia: Department of Computer and Information Science, University of Pennsylvania, Jan. 1999. [10] LEVENSON, N. G. Software Safety: Why, What, and How. ACM Computing Surveys (CSUR), v.18, n.2, p.125–163, Jun. 1986. [11] LITTLEWOOD, B.; STRIGINI, L. Software Reliability and Dependability: a Roadmap. Proceedings of the Conference on The Future of Software Engineering, p.175–188, May 2000. [12] LIU, A.-C.; PARTHASARATHI, R. Hardware Monitoring of a Multiprocessor System. IEEE Micro, v.9, n.5, p.44–51, Sep./Oct. 1989. [13] LUTZ, R. R. Software Engineering for Safety: a Roadmap. Proceedings of the Conference on The Future of Software Engineering, p.213–226, May 2000. [14] PETERS, D. K.; PARNAS, D. L. Requirements-Based Monitors for Real-Time Systems. ACM SIGSOFT Software Engineering Notes, Proceedings of the International Symposium on Software Testing and Analysis, v.25, n.5, p.77–85, Aug. 2000. [15] SCHROEDER, B. A. On-Line Monitoring: A Tutorial. Computer, v.28, n.6, p.72–78, Jun. 1995. [16] SNODGRASS, R. A Relational Approach to Monitoring Complex Systems. ACM Transactions on Computer Systems (TOCS), v.6, n.2, p.157–195, May 1988. [17] TSAI, J. J. P.; YANG, S. J. H. Monitoring and Debugging of Distributed Real-Time Systems. California: IEEE Computer Society Press, 1995. [18] VOAS, J. Roundtable – Fault Tolerance. IEEE Software, v.18, n.4, p.54–57, Jul./Aug. 2001. [19] WEYUKER, E. J.; VOKOLOS, F. I. Experience with Performance Testing of Software Systems: Issues, an Approach, and Case Study. IEEE Transactions on Software Engineering, v.26, n.12, p.1147–1156, Dec. 2000. [20] WHITTAKER, J. A. What Is Software Testing? And Why Is It So Hard? IEEE Software, v.17, n.1, p.70–79, Jan./Feb. 2000. [21] YURCIK, W.; DOSS, D. Achieving Fault-Tolerant Software with Rejuvenation and Reconfiguration. IEEE Software, v.18, n.4, p.48–52, Jul./Aug. 2001.