Aug 2, 2007 - developed turbulent velocity field from the Lagrangian point of view is a ...... 1 S. B. Pope, âLagrangian PDF methods for turbulent flows,â Annu. Rev. ... 422, 207 (2000). 9 A. La Porta, G. A. Voth, A. M. Crawford, J. Alexander.
Lagrangian Structure Functions in Turbulence: A Quantitative Comparison between Experiment and Direct Numerical Simulation L. Biferale,1, 2 E. Bodenschatz,1, 3, 4, 5, 6 M. Cencini,1, 7, 8 A. S. Lanotte,1, 9 N. T. Ouellette,1, 3, 4, 10 F. Toschi,1, 11 and H. Xu1, 3, 4 1
International Collaboration for Turbulence Research Dip. Fisica and INFN, Universit` a di “Tor Vergata” Via della Ricerca Scientifica 1, 00133 Roma, Italy. 3 Max Planck Institute for Dynamics and Self-Organization, Am Fassberg 17, D-37077 Goettingen, Germany 4 Laboratory of Atomic and Solid-State Physics, Cornell University, Ithaca, NY 14853, USA 5 Sibley School of Mechanical and Aerospace Engineering, Cornell University, Ithaca, NY 14853, USA 6 Inst. for Nonlinear Dynamics, U. Goettingen, Bunsenstrasse 10, D-37073 Goettingen, Germany 7 INFM-CNR, SMC Dipartimento di Fisica, Universit` a di Roma “La Sapienza”, p.zle A. Moro 2, 00185 Roma, Italy 8 Istituto dei Sistemi Complessi - CNR, via dei Taurini 19, 00185 Roma, Italy 9 CNR-ISAC and INFN, Sezione di Lecce, Str. Prov. Lecce-Monteroni, 73100 Lecce, Italy. 10 Department of Physics, Haverford College, Haverford, PA 19041, USA 11 Istituto per le Applicazioni del Calcolo CNR, Viale del Policlinico 137, 00161 Roma, Italy and INFN, Sezione di Ferrara, Via G. Saragat 1, I-44100 Ferrara, Italy.
arXiv:0708.0311v1 [nlin.CD] 2 Aug 2007
2
A detailed comparison between data from experimental measurements and numerical simulations of Lagrangian velocity structure functions in turbulence is presented. By integrating information from experiments and numerics, a quantitative understanding of the velocity scaling properties over a wide range of time scales and Reynolds numbers is achieved. The local scaling properties of the Lagrangian velocity increments for the experimental and numerical data are in good quantitative agreement for all time lags. The degree of intermittency changes when measured close to the Kolmogorov time scales or at larger time lags. This study resolves apparent disagreements between experiment and numerics. PACS numbers: 47.27.Eq ,47.27.Gs, 02.50.-r, 47.27.Jv
I.
INTRODUCTION
the Lagrangian Velocity Structure Functions (LVSF), defined as
Understanding the statistical properties of a fully Sp (τ ) = h(δτ v)p i = h[v(t + τ ) − v(t)]p i , (1) developed turbulent velocity field from the Lagrangian point of view is a challenging theoretical and experimenwhere v denotes a single velocity component. tal problem. It is a key ingredient for the development In the past, the corresponding Eulerian quantities, of stochastic models for turbulent transport in such i.e. the moments of the spatial velocity increments, have diverse contexts as combustion, pollutant dispersion, attracted significant interest in theory, experiments, and cloud formation, and industrial mixing.1,2,3,4 Progress numerical studies (for a review see Ref. 35). It is now has been hindered primarily by the presence of a wide widely accepted that spatial velocity fluctuations are inrange of dynamical timescales, an inherent property termittent in the inertial range of scales, for η ≪ r ≪ L, of fully developed turbulence. Indeed, for a complete L being the largest scale of the flow. By intermittency description of particle statistics, it is necessary to we mean anomalous scaling of the moments of the velocfollow their paths with very fine spatial and temporal ity increments, corresponding to a lack of self-similarity resolution, on the order of the Kolmogorov length and of their probability density functions (PDFs) at different time scales η and τη . Moreover, the trajectories should scales. In an attempt to explain Eulerian intermittency, be tracked for long times, order the eddy turnover many phenomenological theories have been proposed, eitime TL , requiring access to a vast experimental meather based on stochastic cascade models (e.g. multifractal surement region. The ratio of the above timescales descriptions36,37,38 ), or on closures of the Navier-Stokes equations.39 Common to all these models is the presence can be estimated as TL /τη ∼ Rλ , and the microscale of non-trivial physics at the dissipative scale, r ∼ η, inReynolds number Rλ ranges from hundreds to thoutroduced by the complex matching of the wild fluctuasands in typical laboratory experiments. Despite these tions in the inertial range and the dissipative smoothing difficulties, many experimental and numerical studies mechanism at small scales.40,41 Numerical and experiof Lagrangian turbulence have been reported over the 5,6,7,8,9,10,11,12,13,14,15,16,17,18,19,20,21,22,23,24,25,26,27,28,29,30,31,32,33,34 mental observations show that clean scaling behavior for years. the Eulerian structure functions is found only in a range Here, we present a detailed comparison between state10η ≤ r ≪ L (see Ref.42 for a collection of experimental of-the-art experimental and numerical studies of high and numerical results). For spatial scales r < 10η, multiReynolds number Lagrangian turbulence. We focus on scaling properties, typical of the intermediate dissipative single particle statistics, with time lags ranging from range, are observed due to the superposition of inertial smaller than τη to order TL . In particular, we study
2
Sp (τ ) = h(δτ v)p i ∼ τ ξ(p) ,
(2)
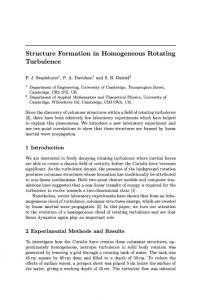
mainly due the desire to extract a single number, i.e. the scaling exponent ξ(p), over a range of time lags. Measurements using acoustic techniques10,15 gave the first values of the exponents ξ(p), measuring scaling properties in the range 10τη < τ < TL . Subsequently, experiments based on CMOS sensors26,28 provided access to scaling properties for shorter time lags, 2τη ≤ τ ≤ 6τη , finding more intermittent values, though compatible with Ref. 10. DNS data, obtained at lower Reynolds number, allowed simultaneous measurements in both of these ranges.23,29 For 10τη ≤ τ ≤ 50τη , scaling exponents were found to be slightly less intermittent than those measured with the acoustic techniques, though again compatible within error bars. On the other hand, DNS data29,34,43 for small time lags, 2τη ≤ τ ≤ 6τη , agree with scaling exponents measured in Ref. 26. The primary goal of this paper is to critically compare state-of-the-art numerical and experimental data in order to analyze intermittency at both short and long time lags. This is a necessary step both to bring Lagrangian turbulence up to the same scientific standards as Eulerian turbulence and to resolve the conflict between experiment and simulations (see also Refs. 34,43,44). To illustrate some of the difficulties discussed above, in Fig. 1 we show a compilation of experimental and numerical results for the second-order Lagrangian structure function at various Reynolds numbers (see later for details). The curves are compensated with the dimensional prediction given by the classical Kolmogorov dimensional theory in the inertial range45, S2 (τ ) = C0 ǫτ , where ǫ is the turbulent kinetic energy dissipation. The absence of any extended plateau and the trend with the Reynolds number indicate that the inertial range, if any, has not developed yet. The same trends have been observed in other DNS studies27 and by analyzing the tem-
7 6 5 S2(τ)/ε τ
range and dissipative physics.41 Similar questions can be raised in the Lagrangian framework: (i) is there intermittency in Lagrangian statistics? (ii) is there a range of time lags where clean scaling properties (i.e. power law behavior) can be detected? (iii) are there signatures of the complex interplay between inertial and dissipative effects for small time lags τ ∼ O(τη )? In this paper we shall address the above questions by comparing accurate Direct Numerical Simulations (DNS) and laboratory experiments. Unlike Eulerian turbulence, the study of which has attracted experimental, numerical and theoretical efforts since the last thirty years, Lagrangian studies become available only very recently mainly due to the severe difficulty of obtaining accurate experimental and numerical data at sufficiently high Reynolds numbers. Consequently, the understanding of Lagrangian statistics is still poor. This explains the absence of consensus on the scaling properties of the LVSF. In particular, there have been different assessments of the scaling behavior
4
DNS1 DNS2 EXP1 EXP2 EXP3 EXP4
3 2 1 0 -2 10
10
-1
0
10 τ/τη
10
1
10
2
FIG. 1: Log-log plot of the second-order LVSF (averaged over the three components) normalized with the dimensional prediction, i.e. S2 (τ )/(ǫτ ), at various Reynolds numbers and for all data sets. Details can be found in Tables 1 and 2. EXP2 and EXP4 refer to the same Reynolds number (Rλ = 690), but with different measurement volumes (larger in EXP4); in particular EXP2 and EXP4 better resolve the small and large time lag ranges, respectively, and intersect for τ /τη ≈ 2. We indicate with a solid line the resulting data set made of data from EXP2 (for τ /τη < 2) and EXP4 (for τ /τη > 2); a good overlap among these data is observed in the range 2 < τ /τη < 8. For all data sets, a extended plateau is absent, indicating that the power law regime typical of the inertial range has not yet been achieved, even at the highest Reynolds number, Rλ ∼ 815, in experiment.
poral behavior of signals with a given power-law Fourier spectrum.46 We stress that assessing the actual scaling behavior of the second (and higher) order Lagrangian velocity structure functions is crucial for the development of stochastic models for Lagrangian particle evolution. Indeed, these models are based on the requirement that the secondorder LVSF scales as S2 (τ ) ∝ ǫτ . The issues of whether the predicted scaling is ever reached and ultimately how the LVSF deviate as a function of the Reynolds numbers remains to be clarified. Moreover, an assessment of the presence of Lagrangian intermittency calls for more general questions about phenomenological modeling. For instance, multifractal models derived from Eulerian statistics can be easily translated to the Lagrangian framework,10,23,47,48 with some degree of success.10,13,18 The material is organized as follows. In Section II, we describe the properties of the experimental setup and the direct numerical simulations, detailing the limitations in both sets of data. A comparison of Lagrangian velocity structure functions is considered in Section III. Section III A presents a detailed scale-by-scale discussion of the local scaling exponents, which is the central result of the paper. Section IV draws conclusions and offers perspectives for the future study of Lagrangian turbulence.
3 II.
EXPERIMENTS AND NUMERICAL SIMULATIONS
Before describing the experimental setup and the DNS we shall briefly list the possible sources of uncertainties in both experimental and DNS data. In general this is not an easy task. First, it is important to discern the deterministic from the statistical sources of errors. Second, we must be able to assess the quantitative importance of both types of uncertainties on different observables. Deterministic uncertainties. For simplicity, we report in this work the data averaged over all three components of the velocity for both the experiments and the DNS. Since neither flows in the experiments nor the DNS are perfectly isotropic, a part of the uncertainty in the reported data comes from the anisotropy. In the experiments the anisotropy reflects the generation of the flow and the geometry of the experimental apparatus. The anisotropy in DNS is introduced by the finite volume and by the choice of the forcing mechanism. In general, the DNS data are quite close to statistical isotropy, and anisotropy effects are appreciable primarily at large scales. This is also true for the data from the experiment, especially at the higher Reynolds numbers. An important limitation of the experimental data is that the particle trajectories have finite length due both to finite measurement volumes and to the tracking algorithm, which primarily affect the data for large time lags. It needs to be stressed, however, that in the present experimental set up due to the fact that the flow is not driven by bulk forces, but by viscous and inertial forces at the blades, the observation volume would anyhow be limited by the mean velocity and the time it takes for a fluid particle to return to the driving blades. At the blades the turbulence is strongly influenced by the driving mechanism. Therefore, in the experiments reported here the observation volume was selected to be sufficiently far away from the blades to minimize anisotropy. For short time lags, the greatest experimental difficulties come from the finite spatial resolution of the camera and the optics, the image acquisition rate, data filtering and post-processing, a step necessary to reduce noise. For DNS, typical sources of uncertainty at small time lags are due to the interpolation of the Eulerian velocity field to obtain the particle position, the integration scheme used to calculate trajectories from the Eulerian data, and the numerical precision of floating point arithmetic. The statistical uncertainties for both the experimental and DNS data arise primarily from the finite number of particle trajectories and–especially for DNS–from the time duration of the simulations. We note that this problem is also reflected in a residual, large-scale anisotropy induced by the non-perfect averaging of the forcing fluctuations in the few eddy turnover times simulated. The number of independent flow realizations can also contribute to the statistical convergence of the data. While it is common to obtain experimental measurements separated by many eddy turnover times, typical DNS results
contain data from at most a few statistically independent realizations. We stress that, particularly for Lagrangian turbulence, only an in-depth comparison of experimental and numerical data will allow the quantitative assessment of uncertainties. For instance, as we shall see below, DNS data can be used to investigate some of the geometrical and statistical effects induced by the experimental apparatus and measurement technique. This enables us to quantify the importance of some of the above mentioned sources of uncertainty directly. DNS data are, however, limited to smaller Reynolds number than experiment; therefore only data from experiments can help to better quantify Reynolds number effects.
A.
Experiments
The most comprehensive experimental data of Lagrangian statistics are obtained by optically tracking passive tracer particles seeded in the fluid. Images of the tracer particles are analyzed to determine their motion in the turbulent flow.6,7,49 Due to the rapid decrease of the Kolmogorov scale with Reynolds number in typical laboratory flows, previous experimental measurements were often limited to small Reynolds numbers.6,8 The Kolmogorov time scale at Rλ ∼ O(103 ) in a laboratory water flow was so far resolved only by using four high speed silicon strip detectors originally developed for high-energy physics experiments.9,11 The one-dimensional nature of the silicon strip detector, however, restricted the three dimensional tracking to a single particle at a time, limiting severely the rate of data collection. Recent advances in electronics technology now allow simultaneous three dimensional measurements of O(102 ) particles at a time, by using three cameras with two-dimensional CMOS sensors. High-resolution Lagrangian velocity statistics at Reynolds numbers comparable to those measured using silicon strip detectors are therefore becoming available.26 Lagrangian statistics can also be measured acoustically. The acoustic technique measures the Doppler frequency shift of ultrasound reflected from particles in the flow, which is directly proportional to their velocity.10,15 The size of the particles needed for signal strength in the acoustic measurements can be significantly larger than the Kolmogorov scale of the flow. Consequently, the particles do not follow the motion of fluid particles,11 and this makes the interpretation of the experimental data more difficult.15 The experimental data here presented are discussed in much detail in Refs. 26,28. In the following, we only briefly recall the main aspects of the experimental technique and data sets, whose parameters are summarized in Table I. Turbulence was generated in a swirling water flow between counter-rotating baffled disks in a cylindrical container. The flow was seeded with polystyrene particles of size dp = 25µm and density ρp = 1.06g/cm3 that
4 No.
Rλ
EXP1 EXP2 EXP3 EXP4
350 690 815 690
′ vrms (m/s) 0.11 0.42 0.59 0.42
ε (m2 /s3 ) 2.0×10⁻² 1.2 3.0 1.2
η (µm) 84 30 23 30
τη (ms) 7.0 0.90 0.54 0.90
TL (s) 0.63 0.16 0.11 0.16
Nf (f/τη ) 35 24 15 24
meas. vol. in (L3 ) 0.4×0.4×0.4 0.3×0.3×0.3 0.3×0.3×0.3 0.7×0.7×0.7
∆x (µm/pix) 50 80 80 200
NR
Ntr
500 480 500 1200
9.3×10⁵ 9.6×10⁵ 1.7×10⁶ 6.0×10⁶
′ TABLE I: Parameters of the experiments. Column three gives the value of the root-mean-square velocity fluctuations vrms , 3 ′ averaged over the three components. The integral length scale L ≡ vrms /ε = 7cm was determined to be independent of ′ Reynolds number. TL ≡ L/vrms is the eddy turnover time. Nf is the temporal resolution of the measurement, in units of frames per τη . The measurement volume was nearly a cube in the center of the tank and its linear dimensions are given in units of the integral length scale L. ∆x is the spatial discretization of the recording system. The spatial uncertainty of the position measurements is roughly 0.1∆x. NR is the number of independent realizations recorded (see text). Ntr is the number of Lagrangian trajectories measured.
follow the flow faithfully for Rλ up to 103 .11 The particles were illuminated by high-power Nd:YAG lasers, and three cameras at different viewing angles were used to record the motion of the tracer particles in the center of the apparatus. Images were processed to find particle positions in three-dimensional physical space; the particles were then first tracked using a predictive algorithm to obtain the Lagrangian trajectories.49 Due to fluctuations in laser intensity, the uneven sensitivity of the physical pixels in the camera sensor array, plus electronic and thermal noise, images of particles sometimes fluctuate and appear to blink. When the image intensity of a particle was too low, the tracking algorithm lost that particle. Consequently, the trajectory of that particle was terminated. When the image intensity is high again, the algorithm started a new trajectory. The raw trajectories therefore contained many short segments that in reality belonged to the same trajectory. It is, however, possible to connect these segments by applying a predictive algorithm in the six-dimensional space of coordinates and velocities.50 The trajectories discussed in this paper were obtained with the latter method which allows for much longer tracks. The Lagrangian velocities were calculated by smoothing the measured positions and subsequently differentiating. A Gaussian filter has been used to smooth the data. Smoothing and differentiation can be combined into one convolution operation by integration by parts; the convolution kernel is simply the derivative of the Gaussian smoothing filter.16 The width of the Gaussian kernel was chosen to remove the noise in position measurements, but not to suppress the fluctuations, whose characteristic time scale is O(τη ) or above. The velocity statistics have been found to be insensitive to the width σ of the Gaussian filter, provided it is between τη /6 and τη /3 (see also below). The temporal resolution of the camera system in the experiments reported here was sufficiently high to ensure that the fluctuations with time scale greater than τη /6 were well resolved. The uncertainty in position measurement, or the spatial resolution, is directly proportional to the size of the
spatial discretization determined by the optical magnification and by the size of the pixels on the CMOS sensor. Larger magnification gives better spatial resolution but also a smaller measurement volume. Indeed the number of pixels of the camera sensor array is fixed by the chip-size and, at higher speeds, by the imaging rate. The dynamic range of the cameras is not sufficient to cover the entire range of scales of the turbulence at the Reynolds numbers of interest. Therefore, two sets of experiments with different magnifications have been performed. The former set has high spatial resolution and focuses on the small scale quantities, though with a relatively small measurement volume (EXP1,2,3 in Table I). Then, in order to probe longer times and larger scales, the size of the measurement volume in the second set of measurements was chosen to be slightly smaller than the integral scale (EXP4 in Table I). In this data set, however, the uncertainty in position was larger and the short-time statistics were severely affected. As a result, in order to have experimental data covering a wide range of time lags (τη ≤ τ ≤ 100τη ) at a given Reynolds number, one needs to merge data from the two different experiments. This could be done at Reλ = 690, by using data from the small measurement volume (EXP2) up to times τ ∼ (6 ÷ 7)τη , and using data from large measurement volume (EXP4) at larger times. The procedure is well justified as the two data sets match for intermediate time lags. One noticeable difference between experiments and numerical simulations is the number of independent realizations included in the statistics. While it is difficult to have many statistically independent DNS results at one Reynolds number, the experimental data usually contained O(103 ) records separated by a time interval of about 102 TL . Each of these records lasted for (1 ÷ 2) TL . The variation of the velocity fluctuations calculated from the statistics of many records is shown in Figure 2(a). As it is clear from the figure, the three components do not fluctuate about the same value, indicating the presence of anisotropy which does not average away even after many eddy turnover times. These effects are introduced by the flow generation in the apparatus. In the following
5
˙ X(t) = v(X(t), t) .
(3)
Of course, high-order interpolation schemes such as thirdorder Taylor series interpolation or cubic splines partially remove this problem. Cubic splines give higher interpolation accuracy, but they are more difficult to use in implementations that rely on secondary storage.54,55 It has been reported56 that cubic schemes may resolve the most intense events better than linear interpolation, especially for acceleration statistics; the effect, however, appears to be rather small especially as far as velocity is concerned. More crucial than the order of the interpolation scheme is the resolution of the Eulerian grid in terms of the Kolmogorov length scale. To enlarge the inertial range as
0.6 0.5 0.4 0.3
2
Nowadays state-of-the-art numerics19,23,51,52 best suited for Eulerian statistics is able to reach Taylor scale Reynolds numbers of the order of Rλ ∼ 1000 by using up to 40963 mesh points.52 Such extremely high Reynolds number DNS is, however, limited by the impossibility of integrating the flow for long time durations, due to the extremely high computational costs. In Lagrangian studies it is necessary to highly resolve the Eulerian velocity field to obtain precise out-of-grid interpolation. The maximum achievable Reynolds number, on the fastest computers, is currently limited to Rλ ∼ 600 in order to accurately calculate the particle positions and to achieve sufficiently long integration times.4,19,23,27 Typically, such Lagrangian simulations last for a few large-scale eddy turnover times, implying some unavoidable remaining anisotropy at large scales, even for nominally perfectly isotropic forcing. The simulations analyzed here were forced by fixing the total P energy of the first two Fourier-space shells53 : E(k1 ) = |k|∈I1 |ˆ v (k)| P and E(k2 ) = |k|∈I2 |ˆ v (k)|, where I1 = [0.5 : 1.5] and I2 = [1.5 : 2.5] (the |k| = 0 mode is fixed to zero to avoid a mean flow). The three velocity components can instantaneously be quite different: when one of the three fluctuates, the others must compensate in order to keep the total amplitude fixed (see, for instance, Fig. 2(b) for a visualization of this effect). However, by averaging over many eddy turn over times - when possible, as for the lower-resolution DNS shown in the inset of Fig. 2(b), the forcing produces a perfectly statistically isotropic flow. As the remaining large-scale anisotropy is the main source of uncertainty in the DNS results, we will estimate confidence intervals from the difference between the three components. In the simulations, the main systematic error for small time lags comes from the interpolation of the Eulerian velocity fields needed to integrate the equation for particle positions,
v’i (m/s)
Direct Numerical Simulations
0.2 0.1 0 0
0.5
1
1.5 2 2.5 time (hours) (a)
3
3.5
0
10
15
20
3
3.5
4
1.5
2
1
1.8
0.5 1.6
2
B.
much as possible, typical Eulerian simulations tend to poorly resolve the smallest scale velocity fluctuations by choosing a grid spacing ∆x larger then the Kolmogorov scale η. Since this strategy may be particularly harmful to Lagrangian analysis, here it has been chosen to better resolve the smallest fluctuations by choosing ∆x ≃ η and to use the simple and computationally less expensive linear interpolation. We stress that having well resolved dissipative physics for the Eulerian field is also very important for capturing the formation of rare structures on a scale r ≈ η. Moreover, as discussed in Ref. 57, such structures, because of their filamentary geometry, may influence not only viscous but also inertial range physics.
v’i (a.u.)
the uncertainties in the data sets due to anisotropy were estimated by the difference between measurements made on different components of the velocity field.
5
1.4 1.2 1 0.8 0.6 0
0.5
1
1.5
2
2.5 t (a.u.) (b)
4
4.5
FIG. 2: (b) Time evolution of the components of the velocity fluctuation vx′2 (dashed line), vy′2 (thick black line) and vz′2 (solid line) for EXP2. (a) Time evolution of vi′2 , with i = x, y, z, for DNS2. In the inset we show the same time evolution for a DNS at a smaller Rλ ≈ 75 (obtained with a spatial resolution of 1283 grid points and the same forcing), which was integrated for a much longer time. In the latter case, the three components fluctuate around the same value, showing the recovery of isotropy for long enough time.
6 No. DNS1 DNS2
Rλ 183 284
′ vrms 1.5 1.7
ε 0.886 0.81
ν 0.00205 0.00088
η 0.01 0.005
L 3.14 3.14
TL 2.1 1.8
τη 0.048 0.033
T 5 4.4
∆x 0.012 0.006
N3 5123 10243
Np 0.96×10⁶ 1.92 ×10⁶
TABLE II: Parameters of the numerical simulations. Taylor microscale Reynolds number Rλ , root-mean-square velocity ′ fluctuations vrms , energy dissipation ε, viscosity ν, Kolmogorov length scale η = (ν 3 /ε)1/4 , integral scale L, large-eddy turnover ′ time TL = L/vrms , Kolmogorov time scale τη = (ν/ε)1/2 , total integration time T , grid spacing ∆x, resolution N 3 , and the number of Lagrangian tracers Np .
10
3
10
2
10
1
10
0
rms
2
ReλS2(τ)/v’
Another possible source of error comes from the loss of accuracy in the integration of Eq. (3) for very small velocities due to round-off errors. This problem can be overcome by adopting higher-order schemes for temporal discretization. For extremely high Reynolds numbers it may also be necessary to use double precision arithmetic, while for moderate Rλ , single precision, which was adopted in the present DNS, is sufficient for accurate results (see, e.g., Ref. 56). Details of the DNS analyzed here can be found elsewhere23 ; here, we simply state that the Lagrangian tracers move according to Eq. (3), in a cubic, triply periodic domain of side B = 2π. DNS parameters are summarized in Table II.
10
-1
10
-2
10
DNS1 DNS2 EXP1 EXP2 EXP3 EXP4 -2
10
-1
0
10 τ/τη
10
1
10
2
10
2
(a)
A.
Local Scaling Exponents
A common way to assess how the statistical properties change for varying time lags is to look at dimensionless quantities such as the generalized flatness F2p (τ ) =
S2p (τ ) . [S2 (τ )]p
2
Let us now compare the experimental and numerical measurements of the Lagrangian velocity structure functions directly. Figures 3(a) and 3(b) show a direct comparison of LVSFs of order p = 2 and p = 4 for all data sets. The curves are plotted using the dimensional normalization, assuming that S2 (τ ) = C0 ǫτ ∝ 2 ′3 v ′ rms Rλ−1 (τ /τη ) (where we use ǫ ≈ vrms /L and TL /τη ∝ Rλ ). Such a rescaling can be generalized as Sp (τ ) ∝ −p/2 p v ′ rms Rλ (τ /τη )p/2 . Both the 2nd and 4th order moments show a fairly good collapse, especially in the range of intermediate time lags. However, some dependence can be observed both on Rλ (see Fig. 3(b)) and on the size of the measurement volume (compare EXP2 and EXP4). Both effects call for a more quantitative understanding.
rms
COMPARISON OF LAGRANGIAN STRUCTURE FUNCTIONS
ReλS4(τ)/v’
III.
10
7
10
6
10
5
10
4
10
3
10
2
10
1
10
0
10
DNS1 DNS2 EXP1 EXP2 EXP3 EXP4
-1
10
-2
10
-1
0
10 τ/τη
10
1
(b)
FIG. 3: (a) Log-log plot of the second-order structure function 2 ′ compensated as Rλ S2 (τ )/vrms vs τ /τη for all data sets, at several Reynolds numbers. (b) The same for the fourth-order 4 ′ structure function Rλ2 S4 (τ )/vrms . The solid line is made to guide the eye through the two data sets (EXP2 and EXP4) obtained at the same Reynolds number in two different measurement volumes, as explained in Sect. II A.
(4)
We speak of intermittency when such a function changes its behavior as a function of τ : this is equivalent to the PDF of the velocity fluctuations δτ v, normalized to unit variance, changing shape for different τ .35
When the generalized flatness varies with τ as a power law, F2p (τ ) ∼ τ χ(2p) , the scaling laws are intermittent. Such behavior is very difficult to assess quantitatively, since many decades of scaling are typically needed to remove the effects of sub-leading contributions (for in-
F2p(τ)
7
10
4
10
3
10
2
10
1
10
0
DNS2 EXP2 EXP4
p=3
p=2
10
-1
10
0
10
1
10
2
τ/τη
FIG. 4: Generalized flatness F2p (τ ) of order p = 2 and p = 3, measured from DNS2, EXP2, and EXP4. Data from EXP2 and EXP4 are connected by a continuous line. The Gaussian values are given by the two horizontal lines. The curves have been averaged over the three velocity components and the error bars are computed from the scatter between the three different components as a measure of the effect of anisotropy. Statistical errors due to the limitation in the statistics are evaluated by dividing the whole data sets in sub samples and comparing the results. These statistical errors are always smaller than those estimated from the residual anisotropy.
stance, it is known that Eulerian scaling may be strongly affected by slowly decaying anisotropic fluctuations58 ). We are interested in quantifying the degree of intermittency at changing τ . In Fig. 4, we plot the generalized flatness F2p (τ ) for p = 2 and p = 3 for the data sets DNS2, EXP2 and EXP4. Numerical and experimental results are very close, and clearly show that the intermittency changes considerably going from low to high τ . The difficulty in trying to characterize these changes quantitatively is that, as shown by Fig. 4, one needs to capture variations over many orders of magnitude. For this reason, we prefer to look at observables that remain O(1) over the entire range of scales and which convey information about intermittency without having to fit any scaling exponent. With this aim, we measured the logarithmic derivative (also called local slope or local exponent) of structure function of order p, Sp (τ ), with respect to a reference structure function,59 for which we chose the second-order S2 (τ ): ζp (τ ) =
d log (Sp (τ )) . d log (S2 (τ ))
(5)
We stress the importance of taking the derivative with respect to a given moment: this is a direct way of looking at intermittency with no need of ad hoc fitting procedures and no request of power law behavior. This procedure,59 which goes under the name of Extended Self Similarity59 (ESS), is particularly important when assessing the statistical properties at Reynolds numbers not too high
and/or close to the viscous dissipative range. A non-intermittent behavior would corresponds to ζp (τ ) = p/2. In the range of τ for which the exponents ζp (τ ) are different from the dimensional values p/2, structure functions are intermittent and correspondingly the � normalized PDFs of δτ v/h(δτ v)2 i1/2 change shape with τ . Figures 5(a) and 5(b) show the logarithmic local slopes of the numerical and experimental data sets for several Reynolds numbers for p = 4 and p = 6 versus time normalized to the Kolmogorov scale, τ /τη . These are the main results of our analysis. The first observation is that for both orders p = 4 and p = 6, the local slopes ζp (τ ) deviate strongly from their non-intermittent values ζ4 = 2 and ζ6 = 3. There is a tendency toward the differentiable non-intermittent limit ζp = p/2 only for very small time lags τ ≪ τη . In the following, we shall discuss in detail the small and large time lag behavior. Small time lags. For the structure function of order p = 4 (Fig. 5(a)), we observe the strongest deviation from the non-intermittent value in the range of time 2τη ≤ τ ≤ 6τη . It has previously been proposed that this deviation is associated with particle trapping in vortex filaments.23 This fact has been supported by DNS investigations of inertial particles.14,17,29 The agreement between the DNS and the experimental data in this range is remarkable. For p = 6 (Fig. 5(b)), the scatter among the data is higher due to the fact that, with increasing order of the moments, inaccuracies in the data become more important. Still, the agreement between DNS and the experimental data is excellent. Differently from the p = 4 case, a dependence of mean quantities on the Reynolds number is here detectable, though it lies within the errorbars. The experimental data set for p = 6, at the highest Reynolds number (Rλ = 815), show a detectable trend in the local slope toward less intermittent values in the dip region, 2 ≤ τ /τη ≤ 6. This change may potentially be the signature of vortex destabilization at high Reynolds number – which would reduce the effect of vortex trapping. It is more likely, however, that at this very high Reynolds number both spatial and temporal resolution of the measurement system may not have been sufficient to resolve the actual trajectories of intense events.23 We consider this to be an important open question for future studies. Larger time lags. For τ > (6 ÷ 7)τη up to TL , the experimental data obtained in small measurement volumes (EXP1,2,3), are not resolving the physics, as they develop both strong oscillations and a common trend toward smaller and smaller values for the local slopes for increasing τ . This may be attributed to finite volume corrections (see also Sect. III A 1). For these reasons, the data of EXP1,2,3 are not shown for these time ranges. On the other hand, the data from EXP4, obtained from a larger measurement volume, allow us to compare experiment and simulation. Here the local slope of the experimental data changes slower very much akin to the simulations. This suggests that in this region high Reynolds
8
2 1.9
ζ4(τ)
1.8 1.7 1.6 1.5 1.4
DNS1 DNS2 EXP1 EXP2 EXP3 EXP4
1.3 1.2
10-1
100
101 τ/τη
(a)
3
ζ6(τ)
2.5
2
1.5
DNS1 DNS2 EXP1 EXP2 EXP3 EXP4
10-1
100
101 τ/τη
(b)
FIG. 5: Logarithmic derivatives ζp (τ ) of structure functions Sp (τ ) with respect to S2 (τ ) for orders p = 4 (a) and p = 6 (b). The curves are averaged over the three velocity components and the error bars are computed from the statistical (anisotropic) fluctuations between LVSFs of different components. The horizontal lines are the non-intermittent values for the logarithmic local slopes, i.e. ζp = p/2. We stress that the curves for EXP1,2,3 are shown in the time range 1 ≤ τ /τη ≤ 7, while the curves for EXP4 (large measurement volume) are shown in the time range 7 ≤ τ /τη ≤ 50.
number turbulence may show a plateau, although the current data can not give a definitive answer to this question. For p = 6, a similar trend is detected, though with
larger uncertainties. The excellent quantitative agreement between DNS and the experimental data gives us high confidence into the local slope behavior as a function
9
1.
Finite volume effects at large time lags
As noted above, the EXP4 data for ζ4 (τ ) develop an apparent plateau at a smaller value than the DNS data. In this section, we show how the DNS data can be used to suggest a possible origin for this mismatch. We investigate the behavior of the local slopes for the simulations, when the volume of size L3 , where particles are tracked, is systematically decreased. Essentially only trajectories which stay in this sub-volume are considered in the analysis, mimicking what happens in the experimental measurement volume. We considered volume sizes L in the range which goes from the full box size B to B/7, and we average over all the sub-boxes to increase the statistical samples. In Fig. 6, we plot the statistics of the trajectory durations for both the experiment and DNS by varying the measurement volume size. For L = B/4, the modified DNS statistics are essentially indistinguishable from the experimental results. It is now interesting to look at the LVSF measured from these finite length numerical trajectories. This shows that the
10
-1
10
-2
10
-3
10
-4
10
-5
P(t)
of time lag. In light of these results, we can finally clarify the recent apparent discrepancy between measured scaling exponents of the LVSFs in experiments26 and DNS,23 which have lead to some controversy in the literature.34,43,44 In the experimental work26 , scaling exponents were measured by fitting the curves in Fig. 5 in the range 2τη ≤ τ ≤ 6τη , where the compensated second order velocity structure functions reach a maximum, as shown in Fig. 1 (measuring the fourth and sixth order scaling exponents ζp (τ ) to be 1.4 ± 0.1 and 1.6 ± 0.1, respectively). On the other hand, in the simulations23 scaling exponents were measured in the regions in the range of times 10τη ≤ τ ≤ 50τη (finding the values ζ4 = 1.6 ± 0.1 and ζ6 = 2. ± 0.1). It needs to be emphasized, however, that the limits induced by the finiteness of volume and of the inertial range extension in both DNS and experimental data do not allow for making a definitive statement about the behavior in the region τ > 10τη . We may ask instead if the relative extension of the interval where we see the large dip at τ ∼ 2τη and the possible plateau, observed for τ > 10τη both in the numerical and experimental data (see EXP4 data set), becomes larger or smaller at increasing the Reynolds number.33 If the dip region –the one presumably affected by vortex filaments– flattens, it would give the asymptotically stable scaling properties of Lagrangian turbulence. If instead the apparent plateau region, at large times, increases in size while the effect of high intensity vortex remains limited to time lags around (2 ÷ 6)τη , the plateau region would give the asymptotic scaling properties of Lagrangian turbulence. This point remains a very important question for the future because, as of today, it can not be answered conclusively neither by experiments nor by simulations.
1/2 1/4 1/6 1/7 EXP2
0
10
20
30
40 t/τη
50
60
70
80
FIG. 6: Comparison of the probability P(t) that a trajectory lasts a time t vs t/τη for the experiment EXP2 and for DNS2 trajectories in different numerical measurement domains L/B = 1, 1/2, 1/4, 1/6, 1/7.
method we devised is able to mimic the presence of a finite measurament volume as in experiments. In Fig. 7(a), we show the fourth-order LVSF obtained by considering the full length trajectories and the trajectories living in a sub-volume as explained above. What clearly appears from Fig. 7(a) is that the finite length of the trajectories lowers the value of the structure functions for time lags of the order of 20τη ≤ τ ≤ 40τη . Indeed, the finite-length statistics give a signal that is always lower than the full averaged quantity: this effect may be due to a bias to slow, less energetic particles, which have a tendency to linger inside the volume for longer times than fast particles, introducing a systematic change in the statistics. Note that this is the same trend detected when comparing EXP2 and EXP4 in Figs. 3. In Fig. 7(b), we also show the effect of the finite measurement volume on the local slope for p = 4. By decreasing the observation volume, we observe a trend towards a shorter and shorter plateau with smaller and smaller values. This could be the source of the small offset between the plateaux developed by the EXP4 data and the DNS data in Fig. 5. For the sake of clarity, we should recall that in the DNS particles can travel across a cubic fully periodic volume, so during their full history they can reenter the volume several times. In principle, this may affect the results for long time delays. However, since the particle velocity is taken at different times we may expect that possible spurious correlations induced by the periodicity to be very small, if not absent. This is indeed confirmed in Fig. 7(b) where we can notice the perfect agreement between data obtained by using periodic boundary conditions or limiting the analysis to subvolumes of size L = B (i.e. not retaining the periodicity) and even L = B/2.
10
10
1
-1
10
-3
10
-5
DNS2 DNS2a DNS2b DNS2c
2 10
2
10
1
1.8 ζ4(τ)
S4(τ)
10
2.2
p.b.c 1/4 1/7
1.6 1.4
1 1 10 10
-1
10
0
10 10
1
2
10
1.2
2
10
-1
10
0
10
τ/τη
1
10
2
10
2
t/τη
(a)
(a) 2.2
EXP2 1/6 EXP2 1/3 EXP2 2/3 EXP2 4/3
2 1.9
2
1.8
1.8 ζ4(τ)
ζ4(τ)
1.7 1.6
1.6 p.b.c. 1 1/2 1/4 1/7
1.5 1.4 1.3
1.4 1.2
1.2 0.1
1
10 τ/τη
10
-1
10
0
10
1
τ/τη
(b)
(b)
FIG. 7: (a) The fourth-order structure function S4 (τ ) vs τ /τη measured from DNS trajectories, for both full length trajectories (and with periodic boundary conditions) and for trajectories in smaller measurement volumes L/B = 1/4, 1/7. (b) The logarithmic local slope ζ4 (τ ) measured from DNS trajectories, for both the full length trajectories (periodic boundary conditions) and for trajectories in smaller measurement volumes L/B = 1, 1/2, 1/4, 1/7. Note the tendency toward a less developed plateau, at smaller and smaller values, as the measurement volume decreases.
FIG. 8: (a) Logarithmic local slope ζ4 (τ ) for the DNS2 data set. The symbol DNS2a,b, and c denote the DNS2 trajectories modified by noise and filter effects, mimicking what was done in the experiments. In particular, DNS2a refers to the introduction of noise in the particle position of the order of δx ∼ η/10 and with a Gaussian filter width σ ∼ τη /3, DNS2b to the same filter width but with much larger spatial noise (δx ∼ η/4), and DNS2c to the same spatial noise but a large filter width σ ∼ 2τη /3. Note how when the filter is not very large and with large spatial errors we have strong non-monotonic behavior for the local slopes (DNS2b). (b) The effect of filter width on data from EXP2 experiment (Rλ = 690, small measurement volume). We tested 4 different filter widths: σ/τη = 1/6, 1/3, 2/3, and 4/3.
2.
Filtering and measurement error effects at small time lags
As discussed in Sect. II, results at small time lags can be slightly contaminated by several effects both in DNS and experiments. DNS data can be biased by resolution effects due to interpolation of the Eulerian velocity field at the particle position. In experiments uncorrelated experimental noise needs to be filtered to recover the trajectories.7,11,16 To understand the importance of such effects quantitatively, we have modified the numerical Lagrangian trajectories in the following way. First, we have intro-
duced a random noise of the order of η/10 to the particle position, in order to mimic the noise present in the experimental particle detection. Second, we have implemented the same Gaussian filter of variable width used to smooth the experimental trajectories x(t). We also tested the effect of filtering by processing experimental data with filters of different length. In Figs. 8(a) and 8(b), we show the local scaling exponents for ζ4 (τ ) as measured from these modified DNS tra-
11 jectories together with the results obtained from the experiment, for several filter widths. The qualitative trend is very similar for both the DNS and the experiment. The noise in particle position introduces non-monotonic behavior in the local slopes at very small time lags in the DNS trajectories. This effect clearly indicates that small scale noise may strongly perturb measurements at small time lags, but will not have important consequences for the behavior on time scales larger than τη . On the other hand, the effect of the filter is to increase the smoothness at small time lags slightly (notice the shift of local slopes curves toward the right for τ ∼ τη for increasing filter widths). A similar trend is observed in the experimental data (Fig. 8(b)). In this case, choosing the filter width to be in the range τ ∈ [1/6, 1/3]τη seems to be optimal, minimizing the dependence on the filter width and the effects on the relevant time lags. Understanding filter effects may be even more important for experiments with larger particles, on the order of or comparable with the Kolmogorov scale. In those cases, the particle size naturally introduces a filtering by averaging velocity fluctuations over its size, i.e., those particles are not faithfully following the fluid trajectories.11,15 IV.
CONCLUSION AND PERSPECTIVES
A detailed comparison between state-of-the-art experimental and numerical data of Lagrangian statistics in turbulent flows has been presented. The focus has been on single-particle Lagrangian structure functions. Only due to the critical comparison of experimental and DNS data it is possible to achieve a quantitative understanding of the velocity scaling properties over the entire range of time scales, and for a wide range of Reynolds numbers. In particular, the availability of high Reynolds number experimental measurements allowed us to assess in a robust way the existence of very intense fluctuations, with high intermittency in the Lagrangian statistics around τ ∈ [2 : 6]τη . For larger time lags τ > 10τη , the signature of different statistics seems to emerge, with again good agreement between DNS and experiment (see Fig. 5). Whether the trend of logarithmic local slopes at large times is becoming more and more extended at larger and larger Reynolds number is an issue for further research. Both experiments and numerics show in the ESS local slope of the fourth and sixth order Lagrangian structure functions a dip region at around time lags (2÷ 6)τη and a flattening at τ > 10τη . As of today, it is unclear whether the dip or the flattening region give the asymptotic scaling properties of Lagrangian turbulence. The question of
1
2
S. B. Pope, “Lagrangian PDF methods for turbulent flows,” Annu. Rev. Fluid Mech. 26, 23 (1994). S. B. Pope, Turbulent Flows, (Cambridge University Press,
which region will extend as a function of Reynolds number can not be resolved at present, and remains open for future research. It would also be important to probe the possible relations between Eulerian and Lagrangian statistics as suggested by simple phenomenological multifractal models.13,23,47,48 In these models, the translation between Eulerian (single-time) spatial statistics and Lagrangian statistics is made via the dimensional expression of the local eddy turnover time at scale r: τr ∼ r/δr u. This allows predictions for Lagrangian statistics if the Eulerian counterpart is known. An interesting application concerns Lagrangian acceleration statistics,23 where this procedure has given excellent agreement with experimental measurements. When applied to single-particle velocities, multifractal predictions for the LVSF scaling exponents are close to the plateau values observed in DNS at time lags τ > 10τη . It is not at all clear, however, if this formalism is able to capture the complex behavior of the local scaling exponents close to the dip region τ ∈ [2 : 6]τη , as depicted in Fig. 5. Indeed, multifractal phenomenology, as with all multiplicative random cascade models,35 does not contain any signature of spatial structures such as vortex filaments. It is possible that in the Lagrangian framework a more refined matching to the viscous dissipative scaling is needed, as was proposed in Ref. 13, rephrasing known results for Eulerian statistics.41 Even less clear is the relevance for Lagrangian turbulence of other phenomenological models, based on super-statistics44 , as recently questioned in Ref. 60. The formulation of a stochastic model able to capture the whole shape of local scaling properties from the smallest to the largest time lag, as depicted in Fig. 5, remains an open important theoretical challenge. EB, NTO and HX gratefully acknowledge financial support from the NSF under contract PHY-9988755 and PHY-0216406 and by the Max Planck Society. LB, MC, ASL and FT acknowledge J. Bec, G. Boffetta, A. Celani, B. J. Devenish and S. Musacchio for discussions and collaboration in previous analysis of the numerical dataset. LB acknowledges partial support from MIUR under the project PRIN 2006. Numerical simulations were performed at CINECA (Italy) under the “keyproject” grant: we thank G. Erbacci and C. Cavazzoni for resources allocation. LB, MC, ASL and FT thank the DEISA Consortium (co-funded by the EU, FP6 project 508830), for support within the DEISA Extreme Computing Initiative (www.deisa.org). Unprocessed numerical data used in this study are freely available from the iCFDdatabase.61
3
Cambridge UK, 2000) B. Sawford, “Turbulent relative dispersion,” Annu. Rev. Fluid Mech. 33, 289 (2001).
12 4
5
6
7
8
9
10
11
12
13
14
15
16
17
18
19
20
21
22
23
24
P. K. Yeung, “Lagrangian investigations of turbulence,” Annu. Rev. Fluid Mech. 34, 115 (2002). P. K. Yeung and S. B. Pope, “Lagrangian statistics from direct numerical simulations of isotropic turbulence,” J. Fluid Mech. 207, 531 (1989). M. Virant and Th. Dracos, “3D PTV and its application on Lagrangian motion,” Meas. Sci. Technol. 8, 1539 (1997). G. A. Voth, K. Satyanarayan and E. Bodenschatz, “Lagrangian acceleration measurements at large Reynolds numbers,” Phys. Fluids. 10, 2268 (1998). S. Ott and J. Mann, “An experimental investigation of the relative diffusion of particle pairs in three-dimensional turbulent flow,” J. Fluid Mech. 422, 207 (2000). A. La Porta, G. A. Voth, A. M. Crawford, J. Alexander and E. Bodenschatz, “Fluid particle accelerations in fully developed turbulence,” Nature 409, 1017 (2001). N. Mordant, P. Metz, O. Michel and J. F. Pinton, “Measurement of Lagrangian velocity in fully developed turbulence,” Phys. Rev. Lett. 87, 214501 (2001). G. A. Voth, A. La Porta, A. M. Crawford, J. Alexander and E. Bodenschatz, “Measurement of particle accelerations in fully developed turbulence,” J. Fluid Mech. 469, 121 (2002). B. L. Sawford, P. K. Yeung, M. S. Borgas, P. Vedula, A. La Porta, A. M. Crawford, and E. Bodenschatz, “Conditional and unconditional acceleration statistics in turbulence,” Phys. Fluids 15, 3478 (2003). L. Chevillard, S.G. Roux, E. Leveque, N. Mordant, J.F. Pinton and A. Arneodo, “Lagrangian velocity statistics in turbulent flows: Effects of dissipation,” Phys. Rev. Lett. 91, 214502 (2003). I. M. Mazzitelli, D. Lohse and F. Toschi, “Effect of microbubbles on developed turbulence,” Phys. Fluids 15, L5 (2003). N. Mordant, E. Leveque and J.-F. Pinton, “Experimental and numerical study of the Lagrangian dynamics of high Reynolds turbulence,” New J. Phys. 6, 116 (2004). N. Mordant, A.M. Crawford and E. Bodenschatz, “Experimental Lagrangian acceleration probability density function measurement,” Physica D 193, 245 (2004). I. M. Mazzitelli and D. Lohse, “Lagrangian statistics for fluid particles and bubbles in turbulence,” New J. Phys. 6, 203 (2004). L. Biferale, G. Boffetta, A. Celani, B. J. Devenish, A. Lanotte and F. Toschi, “Multifractal statistics of Lagrangian velocity and acceleration in turbulence,” Phys. Rev. Lett. 93, 064502 (2004). P. K. Yeung, D. A. Donzis and K. R. Sreenivasan, “HighReynolds-number simulation of turbulent mixing,” Phys. Fluids 17, 081703 (2005). B. Luthi, A. Tsinober, W. Kinzelbach, “Lagrangian measurement of vorticity dynamics in turbulent flow,” J. Fluid Mech. 528, 87 (2005) L. Chevillard, SG. Roux, E. Leveque, N. Mordant, J.-F. Pinton, A. Arneodo, “Intermittency of velocity time increments in turbulence,” Phys. Rev. Lett. 95, 064501 (2005) K. Hoyer, M. Holzner, B. Luthi, M. Guala, A. Liberzon, W. Kinzelbach, “3D scanning particle tracking velocimetry,” Exp. Fluids 39, 923 (2005) L. Biferale, G. Boffetta, A. Celani, A. Lanotte and F. Toschi, “Particle trapping in three dimensional fully developed turbulence,” Phys. Fluids. 17, 021701 (2005). N.T. Ouellette, H. Xu, M. Bourgoin, and E. Bodenschatz, “Small-scale anisotropy in Lagrangian turbulence,” New J.
25
26
27
28
29
30
31
32
33
34
35
36
37
38
39
40
41
42
43
44
45
Phys. 8, 102 (2006). J. Bec, L. Biferale, G. Boffetta, A. Celani, M. Cencini, A. Lanotte, S. Musacchio, and F. Toschi, “Acceleration statistics of heavy particles in turbulence,” J. Fluid Mech. 550, 349 (2006). H. Xu, M. Bourgoin, N.T. Ouellette and E. Bodenschatz, “High order Lagrangian velocity statistics in turbulence,” Phys. Rev. Lett. 96, 024503 (2006). P. K. Yeung, S. B. Pope and B. L. Sawford, “Reynolds number dependence of Lagrangian statistics in large numerical simulations of isotropic turbulence,” J. Turbul. 7, 58 (2006). N.T. Ouellette, H. Xu, M. Bourgoin and E. Bodenschatz, “An experimental study of turbulent relative dispersion models,” New J. Phys. 8, 109 (2006). J. Bec, L. Biferale, M. Cencini, A. Lanotte and F. Toschi, “Effects of vortex filaments on the velocity of tracers and heavy particle in turbulence,” Phys. Fluids 18, 081702 (2006). J. Berg, “Lagrangian one-particle velocity statistics in a turbulent flow,” preprint arXiv:physics/0610155 M. Guala, A. Liberzon, A. Tsinober, W. Kinzelbach, “An experimental investigation on Lagrangian correlations of small-scale turbulence at low Reynolds number,” J. Fluid Mech. 574, 405 (2007). S. Ayyalasomayajula, A. Gylfason, L. R. Collins, E. Bodenschatz, Z. Warhaft, “Lagrangian Measurements of Inertial Particle Accelerations in Grid Generated Wind Tunnel Turbulence,” Phys. Rev. Lett. 97, 144507 (2007). P. K. Yeung, S. B. Pope, E. A. Kurth and A. G. Lamorgese, “Lagrangian conditional statistics, acceleration and local relative motion in numerically simulated isotropic turbulence,” J. Fluid. Mech. 582, 399 (2007). H. Homann, R. Grauer, A. Busse and W. C. M¨ uller, “Lagrangian Statistics of Navier-Stokes- and MHDTurbulence,” preprint arXiv:physics/0702115v1 U. Frisch, Turbulence: the legacy of A.N. Kolmogorov (Cambridge University Press, Cambridge UK, 1995) R. Benzi, G. Paladin, G. Parisi and A. Vulpiani, “On the multifractal nature of fully developed turbulence and chaotic systems,” J. Phys. A 17, 3521 (1984). Z. S. She and E. Leveque, “Universal scaling laws in fully developed turbulence,” Phys. Rev. Lett. 72, 336 (1994). B. Castaing, Y. Gagne and E. J. Hopfinger, “Velocity probability density functions of high Reynolds number turbulence,” Physica D 46, 435 (1990) V. Yakhot, “Mean-field approximation and a small parameter in turbulence theory,” Phys. Rev. E 63, 026307 (2001). R. Benzi, L. Biferale, G. Paladin, A. Vulpiani and M. Vergassola, “Multifractality in the statistics of the velocity gradients in turbulence,” Phys. Rev. Lett. 67, 2299 (1991). U. Frisch and M. Vergassola, “A prediction of the multifractal model – The intermediate dissipation range,” Europhys. Lett. 14, 439 (1991). A. Arneodo et al. “Structure functions in turbulence, in various flow configurations, at Reynolds number between 30 and 5000, using extended self-similarity,” Europhys. Lett. 34, 411 (1996). F. G. Schmitt, “Relating Lagrangian passive scalar scaling exponents to Eulerian scaling exponents in turbulence,” Physica A 48, 129 (2005). C. Beck, “Statistics of three-dimensional Lagrangian turbulence,” Phys. Rev. Lett. 98, 064502 (2007). A. S. Monin and A. M. Yaglom, Statistical Fluid Mechan-
13
46
47
48
49
50
51
52
53
ics, Vol. II, (MIT Press, Cambridge, MA, 1975). ´ R.-C. Lien and E. A. DAsaro, “The Kolmogorov constant for the Lagrangian spectrum and structure function,” Phys. Fluids 14, 4456 (2002). M. S. Borgas, “The Multifractal Lagrangian Nature of Turbulence,” Phil. Trans. R. Soc. London A 342, 379 (1993). G. Boffetta, F. De Lillo and S. Musacchio, “Lagrangian statistics and temporal intermittency in a shell model of turbulence,” Phys. Rev. E 66, 066307 (2002). N.T. Ouellette, H. Xu and E. Bodenschatz, “A quantitative study of three-dimensional Lagrangian particle tracking algorithms,” Exp. Fluids 40, 301 (2006). H. Xu and E. Bodenschatz, “Tracking Lagrangian trajectories in physical-velocity space,” submitted (2007). T. Gotoh, D. Fukayama and T. Nakano, “Velocity field statistics in homogeneous steady turbulence obtained using a high-resolution direct numerical simulation,” Phys. Fluids 14, 1065 (2002). Y. Kaneda, T. Ishihara, M. Yokokawa, K. Itakura and A. Uno, “Energy dissipation rate and energy spectrum in high resolution direct numerical simulations of turbulence in a periodic box,” Phys. Fluids 15, L21 (2003). S. Chen, G. D. Doolen, R. H. Kraichnan and Z.-S. She, “On statistical correlations between velocity increments and locally averaged dissipation in homogeneous turbu-
54
55
56
57
58
59
60
61
lence,” Phys. Fluids A 5, 458 (1993). P. K. Yeung and S.B. Pope, “An algorithm for tracking fluid particles in numerical simulations of homogeneous turbulence,” J. Comput. Phys. 79, 373 (1988). A. L. Rovelstad, R. A. Handler and P. S. Bernard, “The effect of interpolation errors on the Lagrangian analysis of simulated turbulent channel flow,” J. Comput. Phys. 110, 190 (1994). H. Homann, J. Dreher and R. Grauer, “Impact of the floating-point precision and interpolation scheme on the results of DNS of turbulence by pseudo-spectral codes,” e-arXiv:0705.3144 to appear in Comp. Phys. Comm. V. Yakhot and K. R. Sreenivasan, “Anomalous scaling of structure functions and dynamic constraints on turbulence simulations,” J. Stat. Phys. 121, 823 (2005). L. Biferale and I. Procaccia, “Anisotropy in turbulent flows and in turbulent transport,” Phys. Rep. 414 43, (2005). R. Benzi, S. Ciliberto, R. Tripiccione, C. Baudet, F. Massaioli and S. Succi, “Extended self-similarity in turbulent flows,” Phys. Rev. E 48, R29 (1993) T. Gotoh and R. H. Kraichnan, “Turbulence and Tsallis statistics,” Physica D 193, 231 (2004). iCFDdatabase http://cfd.cineca.it.