Learning-based Hypothesis Fusion for Robust Catheter Tracking in 2D X-ray. Fluoroscopy. Wen Wu â .... rigid model deformation and online template update. These steps are ... The catheter segment is approximated as a degree two or three polynomial ..... However, the paper focuses on the tracking tech- nology for a pure ...
Learning-based Hypothesis Fusion for Robust Catheter Tracking in 2D X-ray Fluoroscopy Wen Wu ∗
Terrence Chen ∗ Adrian Barbu † Peng Wang ∗ ∗ Shaohua Kevin Zhou Dorin Comaniciu ∗
Norbert Strobel ‡
∗
Image Analytics and Informatics, Siemens Corporate Research, Princeton, NJ 08540, USA † Department of Statistics, Florida State University, Tallahassee, FL 32306, USA ‡ Siemens AG, Forchheim, Germany
Abstract Catheter tracking has become more and more important in recent interventional applications. It provides real time guidance for the physicians and can be used as motion compensated reference for other guidance, e.g. a 3D anatomical model. Tracking the coronary sinus (CS) catheter is effective to compensate respiratory and cardiac motion for 3D overlay to assist positioning the ablation catheter in Atrial Fibrillation (Afib) treatments. During interventions, the CS catheter performs rapid motion and non-rigid deformation due to the beating heart and respiration. In this paper, we model the CS catheter as a set of electrodes. Novelly designed hypotheses generated by a number of learning-based detectors are fused. Robust hypothesis matching through a Bayesian framework is then used to select the best hypothesis for each frame. As a result, the tracking achieves very high robustness against challenging scenarios such as low SNR, occlusion, foreshortening, non-rigid deformation, as well as the catheter moving in and out of ROI. Quantitative evaluation has been conducted on a database of 13221 frames from 1073 sequences. Our approach obtains 0.50mm median error and 0.76mm mean error. 97.8% of evaluated data have errors less than 2.00mm. The speed of our tracking algorithm reaches 5 frame-per-second on most data. Our approach is not limited to the catheters in CS but can be extended to track other types of catheters, such as ablation catheters or circumferential mapping catheters.
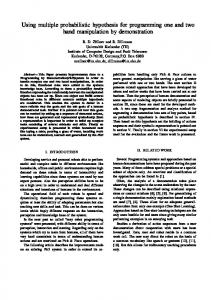
Figure 1. Examples of CS catheters in 2D X-ray fluoroscopy. Catheters demonstrate various appearance and shapes in different contexts. Cyan and red arrows point at the catheter tip and the most proximal electrode (PCS) and in between are other electrodes.
pies have become common procedures in many major hospitals throughout the world today [4]. One popular treatment is catheter ablation, which modifies the electrical pathways of the heart. In order to construct an electrical map of the heart and assist the operation, catheters are inserted and guided to the heart. The entire operation is monitored with real-time fluoroscopic images. The integration of static tomographic volume renderings into three-dimensional catheter tracking systems has introduced an increased need for mapping accuracy during Afib procedures. Current technologies concentrate on gating catheter position to a fixed point in time within the cardiac cycle. Respiration effects have not been quantified. The often advocated static positional reference provides an intermediate accuracy in association with ECG gating. For left atrium procedures, the most proximal electrode of the CS catheter (PCS) reference is superior to the static reference [8]. Figure 1 shows some examples of CS catheters in 2D X-ray fluoroscopy.
1. Introduction Atrial Fibrillation (Afib) is a rapid, highly irregular heartbeat caused by abnormalities in the electrical signals generated by the atria of the heart. It is the most common cardiac arrhythmia and involves the two upper chambers (atria) of the heart. Surgical and catheter-based Afib thera-
Our goal in this paper is to develop a robust and fast algorithm to track CS catheters to provide accurate real-time information for motion compensation. The task has various challenging characteristics: 1) rapid motion due to car1097
diac and breathing motion; 2) non-uniform appearance and electrode number; 3) motion variations including catheter foreshortening due to 2D projection, occlusion and nonrigid deformation; 4) diverse background factors including low signal-to-noise ratio (SNR), nearby catheter-like structures and cluttered scenes. State-of-the-art tracking methods [10, 1, 7, 2] may succeed in overcoming some of these challenges, however, our proposed approach is capable to handle these challenges consistently to achieve high performance in tracking CS catheters in continuous 2D X-ray fluoroscopy. Our approach is different from recent work on CS catheter tracking [9] in four aspects: 1) our approach leverages learning-based detectors instead of filter-based blob detectors; 2) our method does not make any assumption of the electrode number and catheter shape; 3) we propose a novel tracking hypothesis generation and evaluation framework; 4) our approach has been extensively evaluated on 1073 sequences while the method in [9] was evaluated on a smaller dataset. Our paper is also different from [14] in terms of problems, proposed methods and contribution. In [14], a wire structure is tracked as a spline curve, which tries to deform current wire to fit the next frame. Our method detects catheter electrodes and tips to efficiently generate tracking hypotheses. A comparison is possible but it would not be fair to two approaches since the target problems are essentially different. Learning-based methods have demonstrated their strong capabilities to effectively explore object content and context in numerous applications such as segmentation, detection and tracking [13, 12, 3, 14]. In our work, discriminative models are learned based on appearance and contextual features of CS catheter tip and electrodes. Our approach automatically builds the catheter model by analyzing the catheter shape and electrode number from user initialization. In each frame, we first perform catheter tip and electrode detection, and then apply proposed novel schemes to generate tracking hypotheses that are further evaluated by a Bayesian framework. A block diagram of our proposed approach is shown in Figure 2.
Figure 2. A block diagram of our proposed approach.
catheters or catheter-like structures present in the image. Even bounding the search range relative to the CS position from the previous frame still leads to a large search space for tracking CS catheters. Furthermore, if the CS position from the previous frame is not accurate, drifting can happen. To tackle the problem, we propose a novel approach that uses a low dimensional representation of that approximating the CS catheter shape with a small error. Then a number of shape hypotheses are generated for finding the CS in the current frame, each shape implicitly containing the template deformation. The hypotheses are then evaluated by information fusion in a Bayesian framework. The clinical requirements are that the CS catheter is manually initialized by the user in the first frame by marking the electrodes, in the order from the tip to PCS. The input positions are then refined by local search using trained electrode and tip detectors. In the proposed approach, during the model building stage the tracking strategy is selected based on catheter shape and the number of electrodes, with a simpler strategy for shorter catheters with fewer electrodes. The catheter template is then initialized based on the catheter shape and appearance. The Tracking at each frame consists of a number of steps: automatical collimator estimation by a border detector, learning-based tip and electrode detection, hypothesis generation including model-based and part-based schemes, hypothesis evaluation in a Bayesian formula, nonrigid model deformation and online template update. These steps are described in more details in the following sections. Notations are as follow. Z is to denote image observation, D for image intensity data, C for a catheter electrode set. Subscript t denotes t-th frame. Assume that there are K electrodes, {ei , i = 1, ..., K} on the catheter and e1 and eK represent the tip and PCS. We model an electrode as an oriented point as ei = [pi , θi ] where pi = [xi , y i ] is the 2D electrode center and θi is electrode orientation which is defined as the catheter curve tangent pointing to the tip. Other catheter body points can be interpolated from the electrode points as C(b) = {b = (γ x (ω), γ y (ω)), 1 ≤ ω ≤ K} and γ x (ω), γ y (ω) are cubic spline functions and ω ∈ [i − 1, i] indicates that b is interpolated between two control points
2. Learning-based Hypothesis Fusion In this paper, we represent the CS catheter as an ordered set of electrodes starting from the tip. Only the most proximal electrode (PCS) is important for motion compensation [8]. However, by tracking the whole catheter the proposed approach is capable of fusing more information and obtaining more reliable tracking than by just tracking PCS. The non-rigid nature of the CS catheter means that its motion has to be represented in a high dimensional space. Tracking the CS catheter means finding in each frame the location of each electrode. An exhaustive search of the deformation parameters is not only computationally expensive but also prone to producing false positive matches on other 1098
2.2. Detection of Collimator, Catheter Tip and Electrodes
Data: Initial catheter electrode positions: C0 = {e10 , ..., eK 0 } Result: Tracking strategy for the target catheter if K ≤ B 1 then use a one segment approximation; end if B 1 < K ≤ B 2 then Find the point with maximal curvature in C0 and approximate C0 with two segments C01 and C02 joined at the maximum curvature point; end if K > B 2 then Find two points with maximal curvature in C0 and approximate C0 with 3 segments C01 , C02 and C03 . end Algorithm 1: Catheter-specific tracking strategy.
Detection of the collimator is useful for bounding the estimation of catheter motion and location. In our approach, the collimator position on each side is detected using a trained border detector based on Haar features. In real-time fluoroscopy, the collimator can be obtained directly from the imaging device. Accurate detection of catheter electrodes not only provides robust estimation of the catheter position but also helps prune the search space for catheter tracking. Moreover, it is useful for predicting when the catheter moves out of or back into the view. The CS tip and electrodes are detected as oriented points (x, y, θ), parameterized by their position (x, y) and orientation θ. For fast detection, we use Marginal Space Learning [16] to first detect just the tip and electrode positions (x, y) and then at promising positions search for all orientations θ. Tip and electrode positions (x, y) are detected using trained binary classifiers. The classifiers use about 100,000 Haar features in a centered window of size 69 × 69. Each classifier is a Probabilistic Boosting Tree (PBT) [12] and can output a probability P (e = (x, y)|D). The catheter tip is different from the other electrodes in term of context and appearance and it can be detected more reliably. An example of catheter electrode position detection is illustrated in Figure 4. The detected electrode and candidate positions are then augmented with a set of discrete orientations and fed to a trained oriented point detector, and the same applies for the detected tip positions. The oriented point detectors use a richer feature pool including steerable feature responses and image intensity differences relative to the query position and orientation. The set of detected electrodes and tips at each frame is fed to a non-maximal suppression (NMS) stage that cleans up clustered detections. In each frame, at most I electrodes and F tips are kept as the detection results, denoted as HtE = {h1t , ..., hIt } and HtT respectively. Any detection at distance at least 250 pixel from the initial CS catheter location are removed. This relies on the observation that during the ablation procedure, the CS catheter has only a limited range of motion due to breathing and the heartbeat.
(electrodes) ei−1 and ei .
2.1. Automatic Selection of Catheter Shape Representation and Tracking Strategy As consecutive electrodes are not too distant from each other, the number of electrodes is a good indicator of the model complexity required to approximate the CS catheter. Thus, depending on the number of electrodes, the catheter model is approximated using one, two or three segments, each being a polynomial curve as illustrated in Figure 3. The model representation also drives the tracking strategy, involving tracking one, two or three segments. Algorithm 1 sketches the catheter-specific tracking strategy, in which B 1 = 8, B 2 = 14. In our database, a CS catheter can contain up to 20 electrodes. The catheter segments are approximated as polynomials of degree at most three relative to a system of coordinates centered in the middle of a line segment that connects two given points on the curve, as illustrated in Figure 3.
2.3. Hypothesis Generation
Figure 3. The catheter segment is approximated as a degree two or three polynomial passing through two detected electrodes ei , ei+1 , with given tangents at one or both of the two electrodes.
Tracking hypotheses are generated as candidate shapes in the current frame. Given consolidated tip and electrode detection points, we propose two novel schemes to generate catheter tracking hypotheses. For long catheters, these hypotheses are generated for each catheter segment and constrained to be coherent. One set of hypotheses is generated by parametrically manipulating the catheter model-based on detected tip and electrode point candidates and the assumption that at least one
From the initial shape representation in the first frame, the tracking template is obtained and a system of coordinates that is relative to the shape representation. In this system, a 1 P2 ) point P1 near the curve has coordinates ( l(e l(C0 ) , kP1 −P2 k), where P2 is the closest point on the curve to P1 and l(e1 P2 ) is the length of the curve from the tip to P2 . 1099
Thus, if only one tangent orientation is known, a degree two polynomial is perfectly determined, while if both tangents are known, a degree three polynomial is obtained. Curves that differ too much from C0 are removed from the set of hypotheses. In sum we obtain a pool of tracking hypotheses, and fusion of two hypothesis generation schemes leads to a nearcomplete and effective hypothesis pool. Our experiments show that I = 15, F = 10 are sufficient for tracking all kinds of CS catheters as seen in our database.
Figure 4. Automatic CS catheter electrode detection. (a) Input image; four yellow arrows point to electrodes. (b) Automatically detected electrode positions (red points). (c) 5 NMS electrode points (red circles) used for model-based hypothesis generation.
2.4. Learning-based Hypothesis Evaluation electrode detection from HtE is correct. The scheme works as follows:
An effective tracking hypothesis evaluation method is necessary to determine the exact position and shape of the CS catheter. Using our notations the object function of the classic mean shift tracking algorithm (MS) [5] at t-th frame is defined as:
• Input: catheter model C0 = e10 , ..., eK 0 ; • Generate seed hypotheses by translating ej to each detected electrode position hit and obtain a translation vector by which we translate C0 to get a seed hypothesis Qij . In total we obtain (K · I) seed hypotheses.
Cˆt
�
C 0T
d 1
arg min d(Ct , C0 ) Ct
=
arg min
p
1 − ρ[Ct , C0 ]
(2)
Ct
• For each Qij , we consider new location of hit as the transformation center and apply a set of affine transformation to generate tracking hypotheses as: ¯ so = A · Lso , A = L
=
where ρ[Ct , C0 ] is the Bhattacharyya coefficient. MS shows that the most probable location of the target in the current frame is obtained by minimizing the above distance, which is equivalent to maximizing ρ[Ct , C0 ] . In some cases, however, the tracking problem cannot be directly formulated as a maximizing-the-Bhattacharyyacoefficient problem. Main reasons include feature representation and problem formulation. Here we introduce a Bayesian framework to evaluate catheter tracking hypotheses. Recent tracking advancements [6, 14, 15] have shown the power of information fusion. The overall goal for evaluating a tracking hypothesis is to maximize the posterior probability:
� (1)
where Lso represents catheter model coordinates and o indicates the order (o = 0 represents the order from the tip to PCS and o = 1 for reverse) and s is the segment index. This strategy is efficient in generating effective tracking hypotheses. However, it may miss some hypotheses due to catheter motion and shape deformation. Therefore, we add another set of hypotheses that is generated directly from detected oriented tip and electrode points as follows: • A set of rigid transformation hypotheses that assume that one of electrodes is detected with correct orientation. Thus the hypotheses are obtained by rotating and translating Lso to match one of its electrodes and its orientation to the detected oriented electrode.
Cˆt
=
arg max P (Ct |Z0...t )
(3)
Ct
where Z0...t is image observation from 0 to t-th frame. By assuming a Markovian representation of the catheter motion the above formula can be expanded as:
• Another set of non-rigid transformation hypotheses that assumes that the tip and one of the electrodes are correctly detected and either the tip or the electrode has reliable orientation. In this case all pairs of tip and electrode detections are considered if they are at distance within a range relative to Lso . For each such pair, two polynomial curves of degree two and one of degree three are constructed as illustrated in Figure 3. The condition that the curve passes through the two given points imposes two constraints on the polynomial, while each tangent imposes another constraint.
Cˆt
=
arg max P (Ct |Z0...t ) Ct
=
arg max P (Zt |Ct )P (Ct |Ct−1 )P (Ct−1 |Z0...t−1 ) Ct
(4) The above formula essentially combines two parts: the likelihood term, P (Zt |Ct ), which is computed as combination of detection probability and template matching score and the prediction term, P (Ct |Ct−1 ), which captures the 1100
electrodes initialized at frame 0 by the user, the algorithm divides the electrodes into 3 segments if K > 14 and 2 segments if K > 8. In cases of 2 segments, let ξ(ei ) represent the curvature of the catheter at electrode i, the algorithm finds ej = arg maxi ξ(ei ) as the joint point and cut the electrode set into two segments (sets), {e10 , e20 , .., ej0 } and K {ej0 , ej+1 0 , ..., e0 }. The algorithm then performs tracking on the first segment by the aforementioned tracking approach. After the first segment has been tracked, the location of ej is served as the transformation center to generate the hypotheses for the second segment. Therefore, the dimension of search space for the second segment is much lower and the search is faster. Using a joint electrode ej in both segments also guarantees one integrated catheter model as output. To deal with the case when detection misses all the electrodes in the first segment, we perform another tracking from the opposite direction by tracking the second segment first followed by tracking the first segment. The results of these two directions are then evaluated by the overall score, which combines each segment’s score as:
Figure 5. An example of electrode probability map.
motion smoothness. To maximize tracking robustness, the likelihood term P (Zt |Ct ) is estimated by combining tip and electrode detection and catheter body template matching as follows: P (Zt |Ct ) = (1 − λ) · P (Et∗ |Ct ) + λ · P (Tos |Ct )
(5)
where Et∗ is estimated probability measure about electrodes and tips at t-th frame that assists estimation of Ct and λ is defined as: cov(Tos , D(Ct )) , = λ= σ(Tos ) · σ(D(Ct )) 1+ (6) where cov(Tos , D(Ct )) is the intensity cross-correlation between the catheter model template and the image band expanded by Ct . σ(Tos ) and σ(D(Ct )) are the intensity variance. The detection term P (Et∗ |Ct ) is defined in terms of a part model as: 1
, f (Tos , D(Ct )) s e−f (To ,D(Ct ))
P (Et∗ |Ct ) = ν1 P (Et∗ |e1t ) + νK P (Et∗ |eK t ) +
K−1 1 − ν1 − νK X P (Et∗ |eit ), K −2 i=2
(7)
where P (Et∗ |e1t ) defines the detection probability at the tip, ∗ i P (Et∗ |eK t ) defines the probability at PCS and P (Et |et ) represents the probability at each other electrode. ν1 = 0.3 and νK = 0.2 in our experiments. The similar part-based model has shown effectiveness in [14]. Figure 5 shows an example of electrode probability map. The prediction term P (Ct |Ct−1 ) in Equation (4) is modeled as a zero-mean Gaussian distribution N (0, σC ) with σC learned from the training data.
P (Zt |Ct ) =
2 X
�s · P (Zt |C s )
(8)
s=1
where P (Zt |C s ) is computed by Equation (5) and �s is computed as the ratio of the segment length to the sum of all segment lengths. s is the segment index. For 3 segment cases, after the first joint ej1 is found, the same curvature analysis is applied to the longer segment to find another joint ej2 . Then tracking is performed the same way (bi-directional) as the 2 segment cases. Since the model-based hypotheses are generated in a discrete space, small errors may be present even for the best candidate. In order to refine the results, after the best hypothesis is found, we adopt the Powell’s method [11] to search for the maximum in the parameter space. Foreground and background structures in fluoroscopy are constantly changing and moving. In order to cope with it dynamically, the catheter model is updated online by:
s s To,t = (1 − ϕw ) · To,t−1 + ϕw · D(Ct ), if P (Zt |Ct ) > ϕt , (9) s where To,t represents the model template in frame t. D(Ct ) is the model obtained at frame t based on the output Ct . ϕw = 0.1 and ϕt = 0.4 are set in our algorithm. The impact of online updating the model is evaluated in Table 2.
2.5. Non-Rigid Tracking & Online Template Update The shape of the CS catheter may deform non-rigidly due to the impact of cardiac motion, respiratory motion, and/or projection angulation. In order to handle non-rigid deformation, the algorithm may divide the catheter model into multiple segments based on the number of electrodes and the shape (Algorithm 1). Let {e10 , e20 , ..., eK 0 } represent the
3. Experiments 3.1. Data and Annotation 1073 fluoroscopic sequences, containing 13221 frames collected from Electrophysiology (EP) Afib procedures are 1101
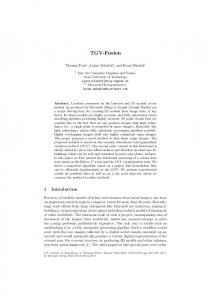
Figure 7. Statistics of errors (mm) on the evaluation set for the ARO method: (a) The likelihood (Eq.(5)) versus frame errors and each bar shows max/min likelihood values; (b) Sequence errors (mean and error bar) versus log(sequence length).
Figure 6. Illustration of our CS catheter dataset: (a) Catheter shapes after aligning to PCS; (b) Distribution of tips (red) and PCS (blue).
used as our database for evaluation. The original image resolutions are either 1024 × 1024 or 1440 × 1440 with pixel spacing 0.154, 0.1725 or 0.183 mm/pixel. The electrode and tip detectors are trained from 5103 frames annotated manually. To illustrate the variability of our tracking target, we illustrate the CS catheter shapes and spatial distribution of the catheter tips and PCSs in Figure 6.
frame be {a1i , a2i , ..., aK i }, the tracking error for i-th frame is defined as: K 1 X k ||ai − eki ||L2 , K
3.2. Catheter Tip and Electrode Detection
where {e1i , e2i , ..., eK i } are the tracked electrodes by the algorithm. The tracking error is summarized in Table 2. We report frame errors in millimeter (mm). All frame errors are sorted in ascending order and Table 2 reports the errors at mean, median, percentile 85 (p85), 90 (p90), 95 (p95) and 98 (p98). While tracking catheters in real fluoroscopic sequences is quite challenging, our algorithm is very robust against different challenging scenarios and has an error less than 2mm in 97.8% of the total evaluated frames (c.f. the last row in Table 2). While the major novelty and the tracking power of the proposed tracking algorithm comes from the robust and efficient hypothesis generation and fusion, we illustrate and compare the impact of other important components in Table 2 as well. DON is the method by setting λ = 0 in Eq. (5), which essentially only considers the detection term; ADD is the method using Eq. (5) with no input refinement or online template update; ADR is ADD with input refinement; and ARO is ADR with online template update. ARO is the final complete version of our algorithm. During comparison, the number of detected electrode candidates per frame is set as 15 and all other settings are exactly the same. We have tried other options of fusing detection probability and template matching score, such as multiplication of the two terms in Eq. (5). The effectiveness of Eq. (5) is validated through our batch evaluation over 1000+ sequences. Due to our robust detection and tracking framework, even the performance of DON is already very good in most of the cases. However, improvement due to fusion of learning and image content, automatic user input refinement, and online template updates can still be observed from the rows of ADD, ADR, and ARO, respectively.
In the first experiment, we evaluate the trained catheter tip and the electrode detectors. Our tip and electrode detectors are evaluated on 1507 frames. For catheter electrode and tip detection, the top 50 electrode candidates and the top 10 tip candidates are extracted at each frame. Detection rate is measured by ( number of ground truth electrodes (tips) that are detected ) / (total number of ground truth electrodes (tips)). A candidate which is away from the ground truth location by 3mm is regarded as a false detection. The results are summarized in Table 1. Since the model-based hypotheses are generated in the way that only if none of the electrodes on the catheter is detected, the algorithm could possibly miss the ground truth hypothesis, the probability of missing the ground truth in the proposed framework is significantly low.
Electrode Tip
Detection rate 0.94 0.97
(10)
k=1
False detection #/frame 23.64 1.14
Table 1. Detection rate and false positive number (per frame) for electrode and tip detection.
3.3. Tracking For all 1073 sequences in our database, we have annotated all the electrodes (from the catheter tip to PCS) in the first frame and 3337 randomly selected frames. During evaluation, the annotation in the first frame is regarded as user initialization to the algorithm. The algorithm then tracks the catheter as a set of electrodes in the remaining frames. Tracking errors are then evaluated only on the frames with ground truth annotation. Let the electrodes annotated at i-th 1102
To investigate our hypothesis evaluation scheme, we depict the relationship between the tracking errors and the likelihood obtained from Eq. (5). Figure 7 (a) shows that the likelihood measure is a good indicator of the tracking error, which demonstrates Eq. (5) as a robust measure for hypothesis evaluation. To evaluate whether the drifting problem exists in our tracking algorithm, we depict the error versus the length of the sequence on the dataset. Figure 7 (b) shows that the errors stay in the same range regardless the length of a sequence. This result demonstrates that our algorithm has little drifting problem during tracking. In our last experiment, we try to find the optimal number of electrode candidates during tracking. If the number of candidates is too small, it is possible that none of the ground truth electrode is hit and the ground truth hypothesis is missed in the hypothesis space we generated. On the other hand, if the number of candidates is too large, it increase unnecessary search in the hypothesis space and decreases the tracking speed, it may also introduce more false detections and result in tracking errors. Table 3 compares performance of extracting 3, 7, 11, 15, 20 electrode candidates per frame. While median errors remain mostly the same which implies that increasing detected electrode number does not have much impact on small error data, mean errors are consistently improved until 15 electrode candidates are used. Therefore, the proposed algorithm uses 15 electrode candidates per frame in its final version in order to balance between performance and speed. In Figure 8, we show several single frame results of catheter tracking on challenging scenarios including the target catheter overlapping with other catheters or structures in a cluttered background (A, C, H, I), non-rigid deformation (B, C, E, G, J), foreshortening due to 3D to 2D projection (B, F, G), the target catheter moves out of the image ROI (I), and low SNR (D, H, J), etc. On average, the proposed tracking algorithm reaches 5 frames per second on a desktop machine with Intel Xeon CPU (2.27GHz). If interested, an demo video with many results can be found at https://sites.google.com/site/cvpr20111013/1013demo/. It is worth mentioning that the proposed approach is generic and is not limited to track the CS catheters. Although the number and size may be different, electrodes are seen on most catheters in EP procedure, no matter they are made from which manufacturer company. The same algo-
DON ADD ADR ARO
mean 1.16 0.91 0.78 0.76
median 0.66 0.45 0.48 0.50
p85 0.98 0.72 0.72 0.73
p90 1.12 0.86 0.81 0.82
p95 1.67 1.56 1.10 1.04
ARO3 ARO7 ARO11 ARO15 ARO20
mean 1.95 0.98 0.96 0.76 0.96
median 0.48 0.49 0.48 0.50 0.48
p85 0.77 0.74 0.74 0.73 0.74
p90 0.90 0.87 0.85 0.82 0.87
p95 1.94 1.43 1.38 1.04 1.38
p98 10.30 3.53 3.72 2.14 3.97
Table 3. Evaluation of the impact of electrode candidate number to the tracking performance. ARO3, ARO7, ARO11, ARO15, ARO20 uses top 3, 7, 11, 15, 20 electrode candidates per frame respectively.
rithm can easily be generalized to track other catheters, such as circumferential mapping catheters and ablation catheters. Figure 9 shows results of three such examples. Furthermore, our tracking and hypothesis generation scheme can be used to track other types of targets as well by replacing the electrodes with the landmarks on the target.
4. Conclusion and Future Work Tracking catheters in the fluoroscopic data is a challenging task due to cardiac and respiratory motion. In addition, the data often contain complex background, constant motion, variations and are often with low signal to noise ratio (SNR) due to preferable low radiation in clinics. Our paper focuses on the novel and robust technology to track catheters, which area highly deformable wire structures. We have proposed a robust learning-based hypothesis generation and information fusion framework to automatically detect and track catheters in fluoroscopy. Its unique hypothesis generation and fusion scheme differentiates our work from existing approaches and makes our tracking algorithm efficient and robust. Promising experimental results on a large dataset (1073 sequence) have shown that 97.8% of evaluated data have errors smaller than 2mm. Furthermore, our proposed approach is generic and can be generalized to track other kinds of catheters or to detect and track part-based objects in other types of data. A 3D position estimation is possible during a bi-plane acquisition. However, the paper focuses on the tracking technology for a pure 2D scene. Note that bi-plane acquisition or other approaches are not always available in hospitals so 2D image-based tracking of catheters is still necessary in many clinical settings. Our future work includes automation of user initialization. For example, the user only needs click the catheter tip and all other electrodes are located automatically.
p98 4.26 4.45 2.40 2.14
5. Acknowledgement We would like to thank Yang Wang for his valuable discussion and other SCR colleagues’ feedback on this work. We also would like to thank three anonymous reviewers for their comments.
Table 2. CS catheter tracking performance. The last row shows the best performance including all essential components.
1103
Figure 8. Results of tracking catheters in 10 different sequences. Cyan, yellow, and red circles indicate the catheter tip, intermediate electrodes, and PCSs, respectively.
[9] Y. Ma, A. P. King, N. Gogin, C. A. Rinaldi, J. Gill, R. Razavi, and K. S. Rhode. Real-time respiratory motion correction for cardiac electrophysiology procedures using image-based coronary sinus catheter tracking. In International Conference on Medical Image Computing and Computer Assisted Intervention, 2010. 1098 [10] J. Pilet, V. Lepetit, and P. Fua. Real-time non-rigid surface detection. In CVPR, 2005. 1098 [11] M. Powell. An efficient method for finding the minimum of a function of several variables without calculating derivatives. Computer Journal, 1964. 1101 [12] Z. Tu. Probabilistic boosting-tree: Learning discriminative models for classification, recognition, and clustering. In ICCV, 2005. 1098, 1099 [13] P. Viola and M. J. Jones. Robust real-time face detection. International Journal of Computer Vision, 2004. 1098 [14] P. Wang, T. Chen, Y. Zhu, W. Zhang, S. K. Zhou, and D. Comaniciu. Robust guidewire tracking in fluoroscopy. In CVPR, 2009. 1098, 1100, 1101 [15] Y. Wang, B. Georgescu, D. Comaniciu, and H. Houle. Learning-based 3D myocardial motion flow estimation using high frame rate volumetric ultrasound data. In IEEE International Symposium on Biomedical Imaging, 2010. 1100 [16] Y. Zheng, A. Barbu, B. Georgescu, M. Scheuering, and D. Comaniciu. Four-chamber heart modeling and automatic segmentation for 3-D cardiac CT volumes using marginal space learning and steerable features. IEEE Transactions on Medical Imaging, 2008. 1099
Figure 9. Results of our approach successfully tracking other catheters: circumferential mapping catheters in (a) and (b) and an ablation catheter in (c).
References [1] S. Avidan. Ensemble tracking. IEEE Transactions on Pattern Analysis and Machine Intelligence, 2007. 1098 [2] B. Babenko, M.-H. Yang, and S. Belongie. Visual tracking with online multiple instance learning. In CVPR, 2009. 1098 [3] A. Barbu, V. Athitsos, B. Georgescu, S. Boehm, P. Durlak, and D. Comaniciu. Hierarchical learning of curves application to guidewire localization in fluoroscopy. In CVPR, 2007. 1098 [4] H. Calkins and et al. HRS/EHRA/ECAS expert consensus statement on catheter and surgical ablation of atrial fibrillation: recommendations for personnel, policy, procedures and follow-up. a report of the heart rhythm society (HRS) task force on catheter and surgical ablation of atrial fibrillation. Heart Rhythm, 4, 2007. 1097 [5] D. Comaniciu, V. Ramesh, and P. Meer. Real-time tracking of nonrigid objects using mean shift. In CVPR, 2000. 1100 [6] D. Comaniciu, X. Zhou, and S. Krishnan. Robust realtime tracking of myocardial border: An information fusion approach. IEEE Transactions on Medical Imaging, 2008. 1100 [7] H. Grabner and H. Bischof. On-line boosting and vision. In CVPR, 2006. 1098 [8] H. U. Klemm and et al. Catheter motion during atrial ablation due to the beating heart and respiration: Impact on accuracy and spatial referencing in three-dimensional mapping. Heart Rhythm, 2007. 1097, 1098
1104