LEARNING FROM FAILURES: ARCHIVING AND DESIGNING WITH FAILURE AND RISK Michael Van Wie1 1
Matt Bohm2
Francesca Barrientos3
Irem Tumer3
Robert Stone1
Department of Basic Engineering, University of Missouri-Rolla, email:
[email protected],
[email protected] 2 Department of Computer Science, University of Missouri-Rolla, email:
[email protected] 3 Computational Sciences Division, NASA-Ames Research Center, email:
[email protected],
[email protected]
ABSTRACT: Identifying and mitigating risks during conceptual design remains an ongoing challenge. This work presents the results of collaborative efforts between the University of Missouri-Rolla and NASA Ames Research Center to examine how an early stage mission design team at NASA addresses risk and how a computational support tool can assist these designers in their tasks. Results of our observations are given in addition to a brief example of our implementation of a repository based computational tool that allows users to browse and search through archived failure and risk data as related to either physical artifacts or functionality.
KEYWORDS: failure analysis, risk assessment, failure taxonomy, reliability based design
1. INTRODUCTION A critical application to the success of modern engineering design is the ability of a design team to rapidly produce alternative architectures and technology concepts and effectively perform trade analyses on performance, cost, and risk. This is particularly important with projects involving very high stakes and low margins for error such as space mission design. Innovation in computational design tools that reuse prior design knowledge is a central challenge. The main goal of this work is to develop a methodology and a computational tool that makes use of past failures to understand failures, risks, and to support the processes used to elicit failures and risks during conceptual design. Examination of past failure data as well as observational studies of designers shows how failures and risks can be archived and subsequently used during conceptual design.
2. BACKGROUND 2.1 Designing with Failure and Risk
The concepts of failure and risk are both indicative of problem areas that require attention during design. Generally a failure refers to a specific event that results in the inability of a system to continue to function in its intended role. Recent work has resulted in the generation of a failure mode taxonomy that incorporates failures in both the mechanical and electrical domains [1-2]. In contrast with the concept of failure, risk refers mainly to three items: a failure event, the likelihood of failure, and the consequence of failure. The problem of accounting for both failure and risk during conceptual design is a fitting opportunity for computational approaches that provide features for archiving and retrieving historical failure and risk data. Past attempts toward archiving failure and risk data vary widely in the type of data addressed. Applications by the US Department of Transportation and the National Transportation Safety Board included databases for storing large volumes of past accidents involving transportation systems. These databases are not geared directly for designers while others such as the Problem / Failure Report database at NASA are sufficiently detailed to provide specifics of design or operation issues that previously contributed to a failure. In order to examine how a computational tool can be implemented in a conceptual design setting, we focus on an early stage design team at NASA’s Jet Propulsion Laboratory (JPL) known as Team X.
2.2 The Team X Early Design Environment Team X is a 20 member design team that specializes in generating preliminary conceptual designs for space missions in extremely short time frames [3]. Table 1 shows the assigned names of each team member, called a “Chair” by Team X convention. Each Chair is an expert in a particular
engineering domain and is responsible for designing that particular aspect of the mission. Note that a “Risk” Chair is a recent addition to the design team, dedicated to the task of eliciting, discussing, and documenting risk related issues. Table 1. Areas of responsibility for Team X Chairs Cost Power Structures Configuration Programmatics Software Systems Ground systems Propulsion Telecom hardware
Telecom system Thermal Visualization Mission design Attitude control system Command and data system Instruments Science Risk Facilitator
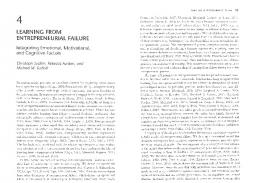
A typical mission design lasts a total of nine hours that are split into three hour sessions on three different days. During these sessions, the team members meet in a specially designed room where they have access to custom groupware and can interact face-to-face. This Team X setting is an excellent example of how effectively conceptual design can occur. In our work, we first consider the tool developed as the “Risk Analysis Prototype” (RAP), which is currently used by Team X. RAP is an Excel based application for documenting and communicating risks during a Team X design session while those risks are being identified and discussed [4]. In addition, RAP presents visual feedback for the user by plotting identified risks on a 5x5 matrix known as a “fever chart.” An example of a fever chart is shown in Figure 1.
between individual perspectives and the shared understanding of the team [5]. How are these risks defined and communicated in the rapid conceptual design tasks during Team X sessions? How can failures and risks be archived in a database with the intention of using such a database during these design sessions to make potential failure and risk identification more effective or efficient? As a starting point, we briefly review previous work on a design repository that serves as a foundation for the features developed in this research.
2.3 Design Repository Ongoing work at the University of Missouri-Rolla has produced a design tool, known as the Design Repository, for storing a wide variety of product design information such as component functionality, material description, and manufacturing choice [6]. One principal effort of the repository research has been the development of models for representing design function and for manipulating functional data to support design synthesis. This effort has culminated into a functional basis language that includes a set of terms that span the space of all functions and flows describing the functionality of systems in the electromechanical domain [7]. Here a function refers to a transformation operation from input flow to output flow. Functional descriptions are composed in a verb-object format where a function word from the Functional Basis is the verb and a flow word is the object. In addition, a joint effort with NASA Ames Research Center has led to the formulation of mechanical and electrical failure modes of components [2]. The primary level of failures modes is shown in Table 2. The current repository system also includes a description of the failure modes associated with each artifact in the system. This design repository serves as a platform from which to add additional features for addressing failure and risk data for assisting conceptual design tasks in the Team X environment. Table 2. Mechanical and electrical failure modes (at the primary level of detail)
Figure 1. Example of a “fever chart” similar to that used in RAP The research questions we address in our work are: Do designers use knowledge of potential failures and risks during the design process? How do Team X designers go about the process of eliciting potential failures and risks? Part of this involves the relation
Mechanical Buckling Corrosion Creep Ductile deformation Fatigue Fretting Galling & Seizure Impact Radiation Rupture Spalling Wear
Electrical Bonding defect Breakdown Contamination Cracking Diffusion Hot carrier ni duced degradation Latch-up Mask defects Noise Overstress Punch-through Voiding
As a summary of the current implemented design repository system, three modes of use are supported: browse, search, and process design tool output. In the browse mode, artifacts in the repository can be selected on a left pane and inspected on the right. The search mode allows the user to search for all artifacts that match an input selection based on attributes such as functionality or failure mode. The final mode of operation includes the execution of certain design tools to support design synthesis [6].
2.4 Objectives The purpose of this work is to investigate how designers can utilize knowledge from past failures to better perform design tasks during conceptual design. The first objective is to examine designer tasks to determine how a computational tool can be integrated into the design environment. A second objective is to develop new capability into the design repository for handling failure and risk data in a manner that is consistent with findings from the first objective.
3. METHODOLOGY AND RESULTS The following three sections discuss the steps taken to meet the objectives. First, direct observations of the design team during mission designs are performed in order to analyze the tasks of Team X. Based on data observed and from selected documents from prior Team X design sessions, an analysis of risk data is then performed. Finally, the enhancements to the design repository are presented.
3.1 Observations In the summer of 2004, a research team from NASA Ames Research Center observed Team X during two design sessions on two different days. Our intention was to study the language, tools and design representations used by Team X during the design process in order to better design a computational tool for their use. Prior to our visit with Team X, we prepared a number of questions to focus our observations. Some of these are shown in Table 3. Not all of these questions were answered but the following provides highlights of the main observations of the Team X environment. Table 3. Questions to focus observations during the Team X visit What are the kinds of tools, methods and processes used during Team X sessions? What intermediate design representations does Team X use? Do they make drawings or diagrams for example? What verbal representations do they use? – Ideally, we would like a full description of Team X terminology. Does Team X describe functionality, and if so, how?
The most striking feature of the Team X environment is the fast pace. Because all of the team members work together in a single room, each team member can easily confer with other members when a subsystem dependency issue occurs. The pace is prohibitively rapid for any Team X members to perform significant amounts of analysis during a session. In fact, relatively time-consuming analyses are performed offline between sessions. The environment is also noisy and full of potential distractions. The main actions during the session are various trades and negotiations that take place in order to explore the design space. The facilitator verbally prompts and orchestrates team members often on a minute-by-minute format. Experience of team members is extremely important given that references to prior missions are used to form initial estimates for certain parameters. These references to prior missions also provide some indication that risk is currently based on past mission data. Observations of risk assessment and the Risk Chair unveiled several aspects of how risk is explicitly addressed by Team X. The Risk chair performs the function of proactively facilitating increased attention of risks from all other Team X chairs. One of the tasks we noticed the Risk Chair perform was the identification of risks associated with an evolving design. First, it appears that there are several sources of design information used by the Risk Chair to identify risks and record those risks using RAP. Documentation provided offline from the customer before design sessions as well as design documents produced by other team members offer one source. Similarly, offline studies between sessions provide some risk data. During the sessions, new risks are triggered from announcements by the facilitator, open conversations in the room, and from direct querying of other Chairs during the session. Considerable risk information is derived by the Risk Chair through elicitation of risk information from other Chairs in a direct manner. The Risk Chair speaks to other Chairs when they were not engaged in other conversations. Mental notes are taken as broad questions such as “What are the risks?” and “What are the mitigations?” are asked. Further detail is elicited through probing with narrow questions. For example, the Risk Chair may ask others to explain the current proposed design regarding the potential failure of a particular component if the technology has previously flown. The Risk Chair continues to probe even when an engineer says there are no risks. Given that risk elicitation seems largely experience-based, we hypothesize that a repository tool will help augment designer memory.
3.2 Risk Data Analysis Part of the challenge for developing a computational tool to support conceptual design involves the choice of representation schemes for the desired data, which, in this case is largely centered on risk data. Another challenge in developing a risk and failure analysis tool is providing a means for retrieving the information that is relevant to a particular design. The conceptual design stage presents a particular difficulty because the design is incomplete and described at different levels of detail. One retrieval scheme we are developing is based on indexing risk and failure data by function. In particular we use the functional basis [7] to provide a consistent set of terms. The following presents details of how risk information can be related to other relevant design data for an artifact being designed. Some analysis of a sample set of risk data is also presented to scrutinize and demonstrate notable characteristics of risk data.
3.2.1 Continuity of design detail: mappings among design descriptors Design descriptors can include a range of aspects from objectives to failure modes. In general, there are potentially several items that are options for representing key aspects of designs from high to low levels of detail. One challenge is to relate risk information to other design descriptors so that cues for risks can be established. Several triggering events at different levels of detail lead to awareness of risk elements. For example, different levels may include consideration of incomplete information regarding objectives, functionality, technology choices, parameters, etc. This suggests that a repository-based application might be used to return intermediate items such as those on ‘guideline sheets’ that the Systems Chair uses in addition to risk elements directly.
3.2.2 Risk Elements Over 900 risk elements (a risk element is some description of a particular risk) were provided by JPL for critical review. These risk elements cover 4 mission types: earth orbit, solar orbit, moon, and Mars missions. Generally, the documented risk elements are highly variable in their level of specificity. After a review of the risk elements provided, one decomposition of a risk element can be described by the properties shown in Table 4. P, D, and N respectively refer to Performance, Design, and Noise parameters. Briefly, values for performance parameters (metrics of system performance) are determined by a particular choice of design
parameters as selected by the designer and noise parameters (external effects) not controlled by the designer. For purposes of analysis here, the only design parameter considered is that of function. For this work, the primary and secondary functions from the functional basis are used. Table 4. Risk element properties Title Performance parameter (P) Design parameter (D) Noise parameter (N) Scope Failure modes Failure scenario Likelihood of individual failure modes Impact of individual failure modes Overall risk likelihood Overall risk impact Overall risk Mitigation Mitigated likelihood Mitigated impact
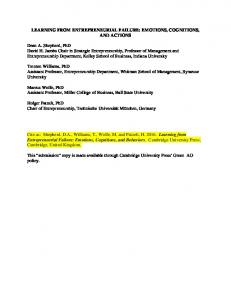
For a portion of the risk elements provided (17 Earth orbit elements and 100 moon mission risk elements), each of the risk element parameters shown in Table 4 are identified. Due to the vagueness of some risk elements, these parameters are identified for only a fraction of the total 117 risk elements inspected. The breakdown for the number of parameters identified is shown in Figure 2. One unexpected result is the relatively low number of failure modes that were identified for each risk element. It is also interesting that the risks address secondary functionality more so than primary functionality. Failure Scenarios
Failure Modes
Noise Parameter
Risk elements affecting secondary functionality
Moon Earth orbit
Secondary function affected
Risk elements affecting primary functionality
Primary function affected
Performance Parameter
0
20
40
60
80
100
120
Figure 2. Number of risk element properties identified for 117 risk elements
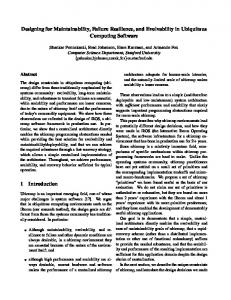
The overall breakdown of risk elements is shown in Figures 3 and 4. Clearly the Systems chair has the greatest portion of risk, which implies that the systems engineer is one target user of a computational tool for designing with risks. 80 70
Risk Elements
60 50
Earth Orbit Moon Solar Orbit Mars
40 30
The consistency of risk elements can be improved through adoption of a comprehensive set of risk element attributes such as those found in Table 4. Enforcement of team adherence to these types of properties is necessary for improvement. Adherence to this format involves identifying specific aspects of risk during the risk consideration process. Again, of all the properties for which there is data as shown in Figure 2, the lack of failure mode identification is significant. In addition, the number of risk elements identifying the affected functionality is low.
20
3.3 Design Tool Development
10
S of GS tw tr ar uc e tu re s C os t R is k S
In
S
Pr
ys
te
op m ul s st sio ru n m Th en er t m a Po l w Pr er og ra A m CS m at S ics ci en Te ce le co M m is si on CD D S es ig n
0
Team X Chair
Figure 3. Risk elements according to mission type 140
Total Risk Elements
120 100 80 60 40 20
si
k R is
S GS of tw ar tr uc e tu re s C os t
D C
es i
on
D
S ci
M
is
S
S
gn
s en Te ce le co m
S
ic
C A
at m
m ra
Pr og
S
ys t
Pr em s op u In lsi on st ru m e Th nt er m al Po w er
0
Team X Chair
Figure 4. Total risk elements for each Team X chair The following highlights three risk elements to show the nature of risk element information content. Given the lack of specificity for some risk elements, it is difficult in these cases to associate a narrow set of functionality with the risk element. For example the risk of an ‘inaccurate landing’ is associated with a great number of functions. Example risk element #1: “Instruments not able to view sample” In this case it is clear that the performance parameter is “view sample accurately,” but there is no hint of exactly what is causing the failure. Example risk element #2: “Insufficient power for drilling operations” This risk element is somewhat ambiguous. It is not clear if the power source is the problem or if a downstream system is the issue. Example risk element #3: “Grounding faults during pyros” This risk element is clear as a description of an event, but does not clearly indicate P, D, N, or failure modes. To some degree, the failure scenario is indicated yet the failure is not clear.
A collaborative effort between the University of Missouri-Rolla and NASA Ames Research Center has been focusing on the development of a function-based failure search and analysis tool, called the Function Failure Design tool, which is based on a previously developed repository of artifact design data. Artifact data refers to attributes (function, failure, material, etc.) of physical artifacts. The repository allows for an artifact hierarchy to be established by designating a parent artifact to a given artifact. The Team X hierarchy is categorized by Chairs, followed by Subsystems and then finally artifacts. In order to integrate the Team X hierarchy with the existing repository architecture, Team X Chairs, Subsystems and Artifacts are all designated as artifacts. Because of the parent/child relationship in the repository, Subsystems are populated as children of their corresponding chair. Likewise, artifacts are categorized as children of their corresponding subsystems. This enables a Team X structure to be created within the repository without drastically altering the repository architecture. The risk data retrieved from JPL is associated with a particular Team X Chair while Failure data exists at both the Subsystem and artifact levels. The repository already allows for failure data to be associated with an artifact meaning that the JPL failure data can then directly be associated with their corresponding Subsystems and artifacts. In order to populate the risk elements, a risk table is added to the repository much like the existing failure table. With the risk data table in place, risk elements are populated within the appropriate Team X Chair. A new repository interface is designed for NASA making use of URL query structures and XML data output. The generic interface allows for multiple NASA design tools to easily access the failure and risk data. Failures can be queried at the Chair, Subsystem and artifact levels. If a failure query at a Chair level is executed, all failures belonging to
Subsystems and their artifacts within the specified chair are returned. Risk elements can only be queried at the chair level. For example, a query of the ACS Chair for failures and risks return all of the risks associated with the ACS Chair level. Failure modes are not associated with a Chair; however, the ACS Chair contains the Star Scanner Subsystem. No failure modes are denoted at the Star Scanner Subsystem level, thus no failure modes are returned at the Subsystem level. The Star Scanner Subsystem contains seven artifact groupings. The artifact groupings within the Star Scanner do have associated failure modes and are listed as failure modes for the Star Scanner Subsystem. Figure 5 shows a snippet of the returned risks for the ACS chair.
form of risk elements), this work suggests how archived failure and risk data can be stored and accessed in a manner suited for conceptual design given that both browse and search capabilities are implemented. Beyond tool development, this work shows that during conceptual design, failures are addressed at multiple levels of abstraction depending on the problem being solved. The variations found in references to failure and risk information during conceptual design suggest that despite an existing failure taxonomy, designers could still benefit from advanced failure and risk tools for conceptual design activities. An ongoing challenge is to define a workable interface for such tools in order to increase designer awareness of potential failures while minimizing the workload and training curve associated with any new failure based design methods [8,9] or tools. We also hope that future work will better characterize the ways in which failure and risk analyses impact the conceptual design process. REFERENCES
Figure 5. Risk query return for ACS Chair
[1]
Tumer, I., Stone, R., Bell, D. (2003) Requirements for a Failure Mode Taxonomy for Use in Conceptual Design, Proceedings of the International Conference on Engineering Design, ICED 2003 – 1612.
[2]
Uder, S., Stone, R., Tumer, I. (2004) Failure Analysis in Subsystem Design for Space Missions, Design Engineering Technical Conference, DETC2004 DTM-57338.
[3]
Mark, G. (2002) Extreme Collaboration, Communications of the ACM, 45, 89-93.
[4]
Meshkat, L., Cornford, S., Moran, T. (2003) Risk Based Decision Tool for Space Exploration Missions, American Institute of Aeronautics and Astronautics Space Conference and Exhibition, AIAA 2003-6377.
[5]
Valkenburg, R. (1998) Shared Understanding as a condition for team design, Automation in Construction, 7, 111-121.
[6]
Bohm, M., Stone, R., Szykman, S. (2005) Enhancing Virtual Product Representations for Advanced Design Repository Systems, Journal of Computer Information Science in Engineering. [in press]
[7]
Hirtz, J., Stone, R., McAdams, D., Szykman, S., Wood, K. (2002) A Functional Basis for Engineering Design: Reconciling and Evolving Previous Efforts, Research in Engineering Design, 13, 65-82.
[8]
Stone, R., Tumer, I., Van Wie, M. (2005) The Function-Failure Design Method, Journal of Mechanical Design. [in press]
[9]
Tumer, I. and Stone, R. (2003) Mapping function to failure mode during component development,” Research in Engineering Design, 14, 25-33.
4. CONCLUSION It is clear from the examination of risk data in this work that there is a great amount of variation exhibited in the verbal descriptions and references to failures where these variations propagate to differences in how failures and risks are formally documented and reported. By adopting a structured functional language (the functional basis), a consistent taxonomy of failures, and inclusion of risk data (in the