Jan 6, 2015 - November 2014 Inside Learning Technologies & Skills 113. Part One of a three-part analysis in which Je
LEARNING METRICS YOU’RE NOT USING… BUT
SHOULD BE
Part One of a three-part analysis in which Jeff Grisenthwaite and M. Christine Lawther challenge conventional thinking about learning analytics. Each part will feature a different under-used metric.
T
he metrics that most L&D organisations leverage to manage their operation and communicate value tend to fall into one of three categories: Cost: Total Spend, Spend per Learner, Activity: Unique Learners, Learning Hours, and Satisfaction: Instructor Score, Courseware Score. Why these three metrics? Because they are the easiest to track and the most readily available from learning management systems. High-performing L&D organisations (and those aspiring to high performance) recognise that running learning like a
business requires a different set of metrics. By taking a fundamentally different approach to measurement, these organisations have dramatically increased the performance impact of their learning programmes. This article is the first in a three-part series, each featuring a different under-utilised metric that will challenge your thinking about learning analytics. This month we’ll kick off the challenge by focusing on scrap learning. Next month will outline predictive return on investment. January will feature manager support for learning.
So, what is driving some organisations to rise above the standard? One catalyst for change stems from research identifying that, although learning organisations are committed to delivering excellent learning solutions, many CEOs, CFOs, and Line Leaders report disappointment with L&D. PwC’s global CEO survey identified that CEOs overwhelmingly feel that information on the return on human capital investments is important, but very few have ever seen those kinds of metrics from L&D to date.
November 2014 Inside Learning Technologies & Skills 113
LEARNING METRICS YOU’RE NOT USING…BUT SHOULD BE
• Do the examples and exercises relate to the learners’ jobs?
CEOs EXPECT MORE INSIGHTS CEOs opinions regarding information on return on investment in human capital
The second category of scrap learning causes relate to the learners themselves: • Do they already know the content before coming into training? • Is this the learning intervention delivered at the right time for them?
Source: PwC 2012 Annual Global CEO Survey
• Are they motivated to learn new skills? LINE LEADERS NOT SATISFIED WITH EFFECTIVENESS OF L&D Line leaders reporting satisfaction with the overall effectiveness of the L&D function
other single key performance indicator. The metric in question is scrap learning. Scrap learning refers to any learning that is delivered but not applied back on the job. The term ‘scrap’ is borrowed from manufacturing where the effort of planning, measuring, and implementing processes fuses together to drive down the amount of waste.
Learning organisations do not always closely monitor the concept of wasted learning. However, it should be scrutinised. On average, 45% of training is not applied back on the job. This varies by industry and by programme type. But regardless, this is a problem that every L&D function needs to be proactively addressing.
Source: CEB 2011 L&D Team Capabilities Survey
Instead, many L&D teams collect and report on the efficiency metrics reviewed earlier, such as training hours per full time employee, satisfaction with training, and L&D cost per training. In contrast, business leaders are looking to see how the learning provided translates back to business performance. This then presents a true disconnect where the L&D organisation is providing metrics that speak a completely different language from their clients in the business. This hurts the reputation of the learning function. According to CEB research, only 23% of business line leaders report that they are satisfied overall with the L&D function.
There are a multitude of root causes driving waste to occur at such a high rate. Some of these reasons are those that are directly within the domain that L&D traditionally focuses on: • Is the content built based on the principles of good instructional design? • Is the delivery of the content engaging?
It is imperative for L&D to produce the metrics that provide answers to the questions on the minds of their clients in the business. So, what is the type of information that needs to be prepared to answer? Business leaders are looking to understand questions such as “To what degree will a learning programme improve a specific business outcome?”… “What will be the return on the learning investment?”… “How can we increase application of new skills on the job?” Boiled down, this translates into leaders looking for results, value, and application. The typical L&D metrics of cost, activity, and satisfaction can in no way address these questions. But there is a powerful learning metric that directly connects to application, results, and value. When adopted by learning organisations, this metric can drive increases to business outcomes more rapidly than any
The last category of scrap learning causes stem from the business environment: • Do managers support learners in adopting new ways of working? • Are there performance support systems in place for JIT reminders? • Will learners have the opportunity and time to practice what they learned? All of these causes add up to that staggering figure of 45% of learning being scrap. This impacts two precious components on both an individual and organisational level: time and money. From a monetary perspective, that represents nearly half of the annual learning and development budget. ASTD’s latest benchmark for this is $1,195 per employee, which means that for an organisation with 10,000 people over $5,000,000 in hard dollar spend is going to waste every year. From a time standpoint, 27 minutes are wasted for every learning hour. It is paramount for organisations to analyse and take action to reduce scrap learning. Over the last several years, some organisations have taken up this cause and seen dramatic results. Simply by shifting the lens of learning analytics by incorporating the measurement of scrap learning, the average organisation sees a decrease from 45% to 33%. The top
SCRAP LEARNING BY INDUSTRY
Source: CEB 2014 Training effectiveness Dashboard, N-27,095
114 Inside Learning Technologies & Skills November 2014
LEARNING METRICS YOU’RE NOT USING…BUT SHOULD BE
Scrap Learning What insights can you leverage to find potential cost savings?
quartile of performers shrink it even further, down to 18%. This translates into millions of dollars of recaptured L&D budget, and a 2x to 3x increase in the performance impact of learning programmes. An example of this in practice is an organisation in the Energy sector that has configured a Scrap Learning dashboard in the learning analytics software, Metrics that Matter™, that automatically calculates the amount of scrap learning in each major curriculum. Anyone within the learning organisation can select a curriculum to instantly see the drivers of scrap learning, a comparison to a relevant benchmark, and
prescriptive recommendations for reducing waste and improving performance impact. Organisations that are most successful at this not only gather the right metrics, but also take action upon findings. Implementing initiatives such as having a scrap task force that meets monthly to review metrics, openly discuss findings, and craft an action plan on next steps, not only becomes the driving force that promotes a culture of transparency, but also a culture of continuous improvement. The act of monitoring scrap learning can produce a ripple effect of positive outcomes that touch many
components across an organisation. One positive outcome that often occurs is that as scrap goes down, performance improvement due to learning goes up. The time and money that were once wasted in less impactful learning can be invested into the appropriate channels. When organisations recapture scrap, they convert it into impactful learning. This can then domino into a higher performing workforce, which feeds into not only retaining top talent across all departments, but also attracting it. Internally, within the L&D department itself, positive outcomes also emerge. If Learning and Development teams are armed with data to verify their contribution back to the business, then they are equipped to validate their need for staff, funding, and tools. If the mission of Learning and Development is to advance the knowledge and skills of the workforce to drive performance, the right place to start is to analyse each programme to determine where that mission is not being fulfilled. Are you up for the challenge? Jeff Grisenthwaite is VP, Client Success and Christine Lawther is Client Success Manager for Metrics That Matter™ at CEB www.executiveboard.com/mtm Twitter: @CEB_News
November 2014 Inside Learning Technologies & Skills 117
LEARNING METRICS YOU’RE NOT USING, BUT SHOULD BE:
PREDICTIVE ROI Jeff Grisenthwaite and M. Christine Lawther present Part Two of a their three-part analysis of under-utilised metrics that will challenge your thinking about learning analytics.
L
earning organisations across the globe tend to gather the same foundational metrics. Typical metrics include elements such as cost, activity, and satisfaction. However, some organisations have taken a step further, to leverage additional metrics that result in higher levels of learning impact. This article is the second in a series aimed to challenge thinking about metrics that can set your learning organisations apart from the standard. Last month we kickedoff the challenge by focusing on scrap learning, this month we outline predictive
return on investment – and in January we’ll conclude with manager support for learning. Return on Investment (ROI) has been viewed within Learning & Development as a controversial formula. While the standard computation of ROI = (Gains – Cost)/ Cost is well accepted throughout business, L&D’s inputs into the formula are routinely called into question. For the Gains input, L&D needs to quantify the financial value of business outcomes resulting specifically from
learning interventions. Since the business environment does not produce laboratory conditions necessary for perfectly isolating variables, some estimation and assumptions are required to calculate gains. The Cost input seems simpler, but can quickly expand from the cost of designing and delivering content to include a much more comprehensive figure consisting of employees’ salaries, opportunity costs, travel expenses, food and drink, technology, facilities and more besides.
December 2014 Inside Learning Technologies & Skills 57
LEARNING METRICS YOU’RE NOT USING, BUT SHOULD BE: PREDICTIVE ROI
Another core reason why this formula is contentious is because it is often used in the wrong way. It is common for L&D teams to use ROI to try to defend the value of an historic event. By the time that a team develops, implements, analyses, and then shares findings, a significant amount of time will have passed and the business will already be focused on the next initiative. Lack of in-the-moment insights are selfdestructive to the learning function because it hinders their ability to drive the impact that the training was originally designed to have. Instead, ROI should be used to make better decisions for the future. There are two key moments of need for Predictive ROI: 1. Determining the appropriate level of investment to address a learning need requested by the business. 2. Obtaining leading indicators of value as a programme is being rolled-out. In the first moment of need, L&D can leverage Predictive ROI by quantifying the
LEVEL 5 RETURN ON INVESTMENT Costs (per person)
1000
1000
Monetary Benefits (per person)
8940.00
9181.27
MY DATA
BENCHMARK
Benefit to cost ratio
8.94
9.18
ROI percentage
794.00%
818.13%
Payback period (months)
1.34
1.31
worth pursuing. L&D organisations should carefully examine the degree of ROI for a planned programme to determine if the figure is strong enough to warrant the investment of time and money versus other priorities that could provide a higher return for the organisation. As organisations become experienced with this process, they will begin creating minimum ROI thresholds to determine if the organisation should undertake an
Lack of in the moment insights are self-destructive to the learning function because it hinders their ability to drive the impact that the training was originally designed to do. potential level of business impact before developing a programme or course. By having this information in advance, decision makers can be equipped with insight on the appropriate level of investment warranted in a new programme and whether or not the benefit-to-cost ratio warrants that it should be developed at all. This approach can be a useful tool to L&D when responding to requests to create custom content for tactical needs or small audiences. Imagine, for example, there is a request to develop managerial skills training for 60 supervisors. If the estimated fully loaded cost for the programme comes in at $90,000, and the benefits are estimated to be $120,000, the relatively small ROI of $30,000 or 33% might be insufficient to raise the priority of this particular need over and above the myriad of other needs. In this case, the best way to meet the training need may be to outsource it to a low-cost vendor or leverage off the shelf e-Learning in order to bring down the cost side of the venture. As one can see from our example, just because there is a positive ROI, does not automatically equate to an initiative
initiative or not. For example, by clearly documenting a minimum ROI threshold of 300% and $100,000 for any custom learning event, L&D is enabled to transition from being purely reactive to the demands to the business to proactive in making strategic decisions that support not only the best interest of the need in question, but of the organisation as a comprehensive whole. The second moment of Predictive ROI need comes after the development of a programme, as it is being rolled-out. To do this, L&D can collect student feedback immediately after the first instance of learning to gauge the degree of estimated improvement gains that the training will provide, and then incorporate that figure into an ROI calculation. The gains side of the ROI = (Gains – Cost)/Cost equation can either calculate the specific gains for a business results or overall performance improvement. This is then translated into a financial value. The cost again includes the fully loaded costs of the learning programme and learners’ time. By doing this, L&D is equipped with the insight to identify whether they are on target or if changes
58 Inside Learning Technologies & Skills December 2014
should be made. An example of this in practice is a healthcare organisation that leverages the learning analytics software Metrics that Matter™ to automatically collect and calculate ROI information and ensure that a highly visible leadership programme meets the expected returns. It is this pulse on the current state that arms L&D with the power to not accept a subpar ROI as a final figure, because if the initial figure is lower than anticipated, changes to the course content or posttraining support can be immediately made, so that results for the current cohort improve and the next instance of learning is better than the first. Critics may argue that this early calculation is not a perfectly precise ROI calculation. The critics are right – it is a roughly reasonable ROI calculation that provides the needed insights to make improvements to impact future results. If we were to wait for a perfectly precise calculation, there would be no opportunity to change the ultimate outcome. Put simply, don’t use ROI to prove your historical value; use it to improve your future results.
Part Three – Manager Support – will appear in our January issue.
Christine Lawther is Client Success Manager and Jeff Grisenthwaite is VP, Client Success at CEB Metrics That Matter www.executiveboard.com/mtm Twitter: @CEB_News
LEARNING METRICS YOU’RE NOT USING, BUT SHOULD BE PART 3:
MANAGER SUPPORT
In the final part of their series on under-utilised metrics, Christine Lawther and Jeff Grisenthwaite continue to challenge our thinking about learning analytics.
L
earning & Development functions tend to focus most heavily on metrics related to learning cost, activity, and satisfaction. The L&D organisations that see the most impact and value from their learning programmes track and take action against a completely different set of metrics. This is the third and final article within a three-part series aimed to challenge your thinking about metrics and achieve higher performance. Over the past two months we covered scrap learning and predictive return on investment as topics. Now, manager support for learning concludes the series.
time, and departmental budgets; to achieve the variety of monthly, quarterly and annual goals with which they’re charged. This is the lens through which they view learning and development, as well as their role in it for the team members. The calculation that most managers have made, boils down to three points:
L&D professionals generally agree that they would like to see increased manager support for their learning programmes. Levels of manager support and their tie to business impact are rarely measured, though. Furthermore, most organisations are not focused on challenging the status quo of low manager support for learning – while L&D will lament the low level of manager support, it’s the rare organisation that is devoting resources to systematically improving it.
3. L&D’s efforts are sufficient in equipping employees to utilise newly learned knowledge and skills, and rather than supporting the learning directly, my time is better invested elsewhere.
In any industry or level in the organisation, managers’ roles can be reduced down to one essential responsibility: optimally allocating scarce resources. They need to balance their limited time, their teams’
1. Training is worthwhile for my employees in select situations. 2. Time that employees spend in training (and off the job) should be minimised.
The first two points could be debated, but the third is simply incorrect. Part of our responsibility as L&D professionals needs to be to educate managers that allocating a portion of their time toward supporting learning programmes will help them to better achieve their departmental goals. Managers under-appreciate what a big difference a small investment of their time before and after learning can make. If we can help them appreciate this difference
January 2015 Inside Learning Technologies & Skills 91
LEARNING METRICS YOU’RE NOT USING, BUT SHOULD BE. PART 3: MANAGER SUPPORT
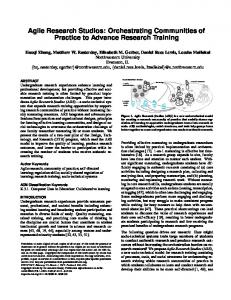
and then teach them how to support learning effectively, we’ll see increased manager support for learning. Managers will need evidence, so you will need to bring data. One proof point can be drawn from comparing two benchmarks in Metrics That Matter®, learning analytics software that features over a billion data points for benchmarking learning effectiveness and impact. Based on those benchmarks, we see that for the average company, 53% of managers support learners before and after training. When we rank L&D functions based on their effectiveness and impact, the top quartile of performers achieve a manager support rate of 68%. Finally, for the best of
Top 25% of L&D organisations
Top 5% of L&D organisations
Once organisations have evidence like this, the argument for managers to invest a little more in supporting learning programmes becomes much easier to make. In order to make that argument, it’s vital to begin tracking manager support metrics. The recommended approach to get started is to leverage learning evaluations to gather this feedback.
Organisations automatically gather learner feedback immediately after a learning intervention and ask the learner to comment on manager support before the class and the anticipated level of MANAGER SUPPORT RATE manager support postclass. For strategic learning programmes, this prediction can then be validated with automated follow up evaluations to both the learner and manager 60 days later. By gathering feedback at two points in
the best, the elite top 5%, the manager support rate stands tall at 83%. Within a single organisation, the correlation between manager support and business impact is often even more apparent. In the graph right, each point represents a different job role within a Fortune 500 company. The rate of manager support is plotted from left to right. Those roles on the right half of the graph received more support before and after learning than those on the left. The degree of business impact resulting from the learning programmes is plotted from bottom to top – the higher the point is on the graph, the more business impact was seen by that particular job as a result of learning. The story of the graph is that out of 94 job roles, every single one of them fits the model that increasing manager support for learning will increase the business impact of learning. This strong correlation can be seen in nearly every organisation and typically holds true
time and from both learner and manager, organisations have an automated, reliable method of calculating manager support rate. Gathering this data opens up a range of analysis possibilities. To start, organisations can rank strategic courses based on the level of manager support to identify those where increasing manager support could make a significant difference. To persuade managers to reallocate a
small amount of their time toward this effort, L&D can create a business case that shows the substantial performance impact and ROI difference seen between courses with high levels of manager support vs. those with low levels. Next, L&D can determine where to focus their energies by ranking the departments or even specific managers where manager support is the lowest. To facilitate the behaviour change and time reallocation required to increase manager support for learning programmes, L&D needs to address the following areas: 1. Business Case: Managers need to be convinced that investing their limited time to support learning programmes will be repaid many times over with performance improvements for their teams. 2. Education: Managers may not know what support for learning looks like, so it’s up to L&D to provide managers with some direction and example questions to ask before and after learning interventions with their team members. 3. Awareness: Many learning interventions occur these days without managers’ knowledge, so L&D can use systems like Metrics That Matter® to automate notices to managers to make them aware of when their employees are attending training and remind managers of the questions they should ask those employees. 4. Accountability: Automating on-the-job learning evaluations to managers and asking questions about the degree to which they’ve supported learning
Business impact
Average organisation
whether we plot job roles, as in this instance, or alternately plot courses, vendors, modalities, or regions of the world.
92 Inside Learning Technologies & Skills January 2015
Manager support
LEARNING METRICS YOU’RE NOT USING, BUT SHOULD BE. PART 3: MANAGER SUPPORT
programmes will help to shape the right behaviour. 5. Continuous Improvement: It’s unlikely that you’ll achieve 100% compliance, so L&D needs to continually monitor levels of manager support, both broadly and for specific courses and learner demographics, and take action to improve where manager support is flagging. By measuring manager support and taking action to improve it, organisations will see the overall impact learning increase. By combining this new metric with the two metrics we covered earlier in this threepart series, Scrap Learning and Predictive ROI, L&D functions can expect to see substantial gains to the business outcomes
Analytics represents the most promising route for L&D to make a bigger difference and finally attain the proverbial seat at the table. Will you take the first step?
related to learning and a stronger strategic partnership with business stakeholders. These new metrics can be implemented with a small investment of resources. Because these new metrics reduce the substantial waste inherent in most learning programmes and the improvements are so rapid, the investment can be paid with existing budget. If the gains are substantial and the investment pays for itself, the only barrier is taking the initiative. Changing status is never easy, but you can start small, show quick wins, and build momentum for a larger roll-out. Analytics represents the most promising route for L&D to make a bigger difference and finally attain the proverbial seat at the table. Will you take the first step?
THREE LEARNING METRICS YOU’RE NOT USING BUT SHOULD BE Part One: Scrap Learning http://viewer.zmags.com/publication/ 69c718a3#/69c718a3/114 Part Two: Predictive ROI http://viewer.zmags.com/publication/ 29c25a23#/29c25a23/58 Part Three: Manager Support (this article)
Christine Lawther is Client Success Manager and Jeff Grisenthwaite is VP, Client Success at CEB Metrics That Matter www.executiveboard.com/mtm Twitter: @CEB_News
January 2015 Inside Learning Technologies & Skills 95