THE MAIN IDEA OF THE LECTURE. 11.9.2012. 2 ... Main MATLAB objects (
commands, variables…) ..... Fs=1/T. Real and imaginary parts of x(n) are
calculated.
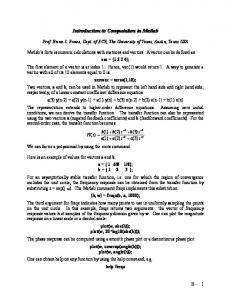
SGN-1158 Introduction to Signal Processing, short version
Lecture: Introduction to DSP simulations in MATLAB
Konstantin Rykov
[email protected]
• Why you’re at this lecture/lab?
• Do not fear MATlab. It’s your friend • MATlab is a tool • Where I can use MATlab? Examples • I’m afraid of program languages…
• THE MAIN IDEA OF THE LECTURE
11.9.2012
2
Сontents BASICS OF MATLAB • Mainwindow. How to make m-file? How to save m-file? • Some basic hints • Main MATLAB objects (commands, variables…) • Main operation symbols • Operation symbols MATLAB IS AN ADVANCED CALCULATOR • Complex numbers • HELP • Vectors • Matrices 2D GRAPHS • Main MATLAB functions for plotting graphs • General rules of forming graphs • Main tools of staging graphs • Controlling graph properties • LineSpec parameters OUTER FUNCTIONS IN MATLAB
11.9.2012
3
Сontents DISCRETE SIGNALS IN MATLAB • Sequences • Unit sample sequence, unit step sequence, discrete exp • Discrete complex harmonic signal • Functions max, sum and prod • Generation of signals: rectpuls, tripuls, gauspuls, sinc, square, sawtooth, diric • Functions rand(1,N) and randn(1, N)
•
TASK: Open MATLAB
11.9.2012
4
BASICS OF MATLAB The main MATLAB window
11.9.2012
5
Some basic hints • help (for example: >> help cos) • ; blocks automatically output of the variables • % makes a comment
• to comment a few rows hold Ctrl+R • to uncomment a few rows Ctrl+T • Always use: clc,clear all; close all; TASK • Type in Editor: • =============== • My MATlab Crib • =============== • Use CTRL+R to comment it • clc; clear all; close all;
11.9.2012
6
Main MATLAB objects • Commands (clc, help, demo) • Constants (10, -17.28, 5+3j, 1e-6, 10^2)
• Standard const (pi, 1i, eps) • Variables – MATlab object, which might change it’s value during
simulation. All variables are MATRIXES in MATlab • Functions (sin(X), exp(X), log10(X), sqrt(X), abs(X), real(X), imag(X))
• Expressions – is a sum of constants, functions, variables, which are summed by operational symbols (x+sin(a)-sqrt(pi);)
11.9.2012
7
Main operation symbols
Symbol
Operation
+
Summation
-
Difference
*
Multiplication of matrixes
.*
Multiplication of elements
/
Right division
.’
Transposing
11.9.2012
8
MATLAB IS AN ADVANCED CALCULATOR Complex numbers Use MATLAB as calculator to find answers
11.9.2012
9
Use help to find what these commands do
• • • •
abs angle exp conj
11.9.2012
10
Type and simulate
• • • • • •
z=3+4i r=abs(z) fii=angle(z) r*exp(i*fii) zk=conj(z) z*zk-r^2
• What the command format does?
11.9.2012
11
Vectors • Type a=[2 4 5 7] and b=[-1 4 -2 1] • Find a+b, 2*a-2*b
• What happens if you type a’ and b’ • a*b; a’*b; a*b’; a’*b’; • -1:10; 0:2:100; 1:-0.25:-2 • Form vectors a=(7,8,9,…,22); b=(0,2,4,…,100); c=(100,95,90,…,35)
• What did you get a(3)? a([3 5 7])? a(3:7)? a(3:end)?
11.9.2012
12
Matriсes
A=[-7 5 -9; 2 -1 2; 1 -1 2];
11.9.2012
13
Task • Calculate: 3A-5C, 7A+2B, CA, CD’
• Find out commands: zeros(n), zeros(m,n), ones(n), ones(m,n), size(D), zeros(size(D)), diag([1 2 3 4]), eye(n) • What happens [A,B] and [A;B]? • Try to find an easy way to build a 7*8-matrix whose other entries are zeros, but in its diagonal and its last column are 5s
NOTE: Transpose of a matrix is obtained with command – ’ • row with A(i,:) and column with A(:,j) 11.9.2012
14
• Determine whether the given sets of vectors are linearly independent/dependent: W1=[1 2 3], W2=[2 1 5], W3=[-1 2 -4], W4=[0 2 -1] • Use MATLAB to to choose randomly three three column vectors in The MATLAB commands to choose these vectors are: • y1=rand(3,1) • y2=rand(3,1) • y3=rand(3,1) HINT check the command rref
11.9.2012
15
2D GRAPHS Main MATLAB functions for plotting graphs
Function
Meaning
plot (x1, y1, x2, y2,…)
Linear graphics
stem
Sequence graphs
stairs
Stairs graphs
loglog
Both Logarithmic axis Im and Re
semilogx semiloxy
Logarithmic Re axis Logarithmic Im axis
11.9.2012
16
General rules of forming graphs • figure – making a new window for a graph
• subplot (n,m,p) – drawing a few graphs in one window: n – colum, m – row, p – ordinal number of the graph
• hold on – plotting another graph at the same picture • hold off
• For more information help graph2d
11.9.2012
17
Generate x=[1 20 3 15 18]; Use functions and tell what is the difference: • plot • stem Generate x1=0:pi/8:8*pi. What we have done? Generate y(t)=sin(x). Use functions to plot graphs: • plot
• stem • stairs
• HINT: use command figure or function subplot(n,m,p)
11.9.2012
18
Use semilogx, semilogy, loglog to plot graphs of the following functions: 1. y=3x^5 2. y=3^(5x-2) 3. y=log10(3x^4) • Use subplot command into 3*3-subplot as described bellow ‘case (1) semilogx’ ‘case (2) semilogx’ ‘case (3) semilogx’
‘case (1) semilogy’ ‘case (2) semilogy’ ‘case (3) semilogy’
‘case(1) loglog’ ‘case(2) loglog’ ‘case(3) loglog’
• Consider again y=3x^5. Use plot(x,log10(y)) and compare its plot with semilogy plot. What is the difference and similarity between them?
11.9.2012
19
Main tools of staging graphs Function grid title(‘’) xlabel (‘’) ylabel (‘’) Legend (‘’,’’,..,Pos) axis([XMIN XMAX YMIN YMAX]) xlim ([XMIN XMAX]) ylim ([YMIN YMAX])
Pos (-1, 0, 1,…,4) TRY THEM!
11.9.2012
20
Generate x1=0:pi/8:8*pi; y1=sin(x1); Form 3 graph in 1 window.
• 1st graph: plot a discrete signal y(x) • 2nd graph: plot a discrete signal. Use axis([0 10 -1 1]) • 3rd graph: do the same, but limit Re axis and Im axis by using xlim([-15 15]) and ylim([-1.5 1.5]) For all graphs: make a grid, title and give names for both axis
Generate y2=0.5*sin(2*x1); plot(x1,y1,x1,y2),legend(‘sin(x1)’,’0.5sin(2x1)’); !!!HINT: use hold on!!! 11.9.2012
21
Controlling grpah properies Each function has different properties. •
plot(x1,y1,…,LineSpec,’PropertyName’,PropertyValue,…);
•
stem(x1,y1,…,LineSpec,’fill’,’MarkerSize’,3);
PropertyName is divided into: • LineWidth – line width; • MarkerEdgeColor – marker color ;
• MarkerFaceColor – color by which the marker is filled; • MarkerSize – size of the marker , give a value (default - 7). Let us divide LineSpec parameters into 3 groups: s1, s2, s3.
11.9.2012
22
LineSpec parameters S1
S2
S3
r
Red
-
+
b
Blue
:
*
g
Green
-.
s
Square
w
White
--
d
Diamond
k
Black
(none)
v
y
Yellow
^
m
Magenta
p
Pentagram
h
Hexagram
11.9.2012
23
• Form a vector y = [0 1 2 3 4 5 6 7 8 9]; line width is 2,
use squared black markers, dotted line • x1=0:pi/8:8*pi; y1=sin(x1);
- line width 3, dashdot line,
filled green markers, marker size 5 • y1=sin(x1); y2=0.2*cos(5x1); - one line is dashed, another is solid; one line is red, another is green; markers, different sizes
11.9.2012
24
OUTER FUNCTIONS IN MATLAB Function file – is a M-file, which generates outer function
DO NOT PUT ; after function row After function there is a function body Put ; everywhere in the body to prevent undesirable output Good programming means good comments 11.9.2012
25
• If you have a few parameters function [z, p] = F1(x,y) % Sum of cubes z % Square root p z=x.^3+y.^3; p=sqrt(abs(z)); end
• If you have one parameter function z = F2(x,y) % Sum of cubes z z=x.^3+y.^3; end
•
After making and saving function-file you can use it in other M-files (script files).
•
Actual/Real parameters a=4, b=3, [d,c]=F1(a,b) => saved in Workspace
•
Formal parameters 3+5-sqrt(9) => not saved in Workspace 11.9.2012
26
Number of input and output parameters can be formed by commands: • nargin(’’)
• nargout(’’) Listing of the function is formed by command: • type If you need commends of the function file: • help
If you need to exit compulsory from the body of the outer function use operator: • return
11.9.2012
27
Let us remake function F1 to F3 with controlling negative argument of the square root and appropriation p=0 in this case:
function [z, p] = F3(x,y) % Sum of cubes z % Square root p z=x.^3+y.^3; if z