Lightweight Monitoring of Sensor Software Mustafa Hammad
Jonathan Cook
Department of Computer Science New Mexico State University Las Cruces, NM 88011 USA
Department of Computer Science New Mexico State University Las Cruces, NM 88011 USA
[email protected]
[email protected]
ABSTRACT Wireless sensors are very small computers, and understanding the timing and behavior of software written for them is crucial to ensuring that they perform correctly. This paper outlines a lightweight method for gathering behavioral and timing information from simulated executions of software written in the nesC/TinyOS environment. The resulting data is used to generate both behavioral and timing profiles of the software, using UML sequence diagrams to visualize the behavior and to present the timing information.
Categories and Subject Descriptors D.2.5 [Software Engineering]: Testing and Debugging
Keywords Wireless Sensor Networks, Software Monitoring
1.
INTRODUCTION
Wireless sensors are very small, portable computers, and thus restrict the opportunities and capabilities for runtime monitoring, even though understanding how the software is performing on them (individually and as a whole sensor network) is vitally important. Because the sensors are deployed as remote devices only accessible through a wireless (possibly multi-hop) sensor network, there are no “out-of-band” communication channels available to report monitoring data. If data are to be reported, the only mechanism available is the sensor network itself. Similarly, on-board resources are generally extremely constrained: normal RAM memory is very small (e.g., 8KB), and available flash memory (e.g., 128KB) must be used carefully to avoid excessive power consumption and to not conflict with application needs. The driving concern when programming these devices, apart from basic software correctness, is power: the duty cycle is kept as low as possible so as to prolong battery life. If the monitoring instrumentation increases the duty cycle too
Permission to make digital or hard copies of all or part of this work for personal or classroom use is granted without fee provided that copies are not made or distributed for profit or commercial advantage and that copies bear this notice and the full citation on the first page. To copy otherwise, to republish, to post on servers or to redistribute to lists, requires prior specific permission and/or a fee. SAC’09 March 8-12, 2009, Honolulu, Hawaii, U.S.A. Copyright 2009 ACM 978-1-60558-166-8/09/03 ...$5.00.
much, it will be undeployable. This holds both for computational requirements as well as communication requirements; indeed, communication (especially sending data packets) is typically the highest consumer of power. Because of the limited hardware and I/O capabilities, writing and debugging software for these devices is hard. Of particular difficulty is knowing what the program is doing: there is no traditional “line-by-line” debugging capability for these devices, and so verification and correcting of the software becomes a tedious experimental task based on very limited observations (e.g., the on-board LED’s can be used to show program states, acting as limited debugging “print” statements). The other choice for verification is to use simulation, but often the cost of setting up an appropriate simulation is non-trivial, and so deciding up front which path to follow is a difficult choice. Thus we are motivated to help the developers of software for sensor networks to be able to better understand their programs. This work details an approach for behavioral and performance runtime analysis of programs written for wireless sensors in the nesC programming language [3] and running under the TinyOS environment [5]. The nesC programming model and environment introduce interesting and unique constraints in trying to understand what the software is actually doing: the execution model is event-based with continuation-style programming, and the concurrency model is a mix between pre-emptive and non-preemptive policies. Our approach is two-pronged: first, create a lightweight monitoring technique and deploy it in the TinyOS simulator, TOSSIM [9]; next, deploy minimal monitoring into the field to validate and “fill in the gaps of” the information gathered under simulation. This approach and sample initial results are described in this paper, which focuses on the first step and presents our tool, tosTracer. Section 2 briefly describes the nesC language and TinyOS; Section 3 details our instrumentation methods and tool, and Section 4 presents some example results. Section 5 describes initial work on in-field instrumentation. Finally, Section 6 summarizes related work and Section 7 concludes with directions for future work.
2.
NESC AND TINYOS
NesC is a programming language designed for small embedded computers needing event-driven, reactive software [3]. It is C-like in its syntax, but the execution model is entirely different, and it has a component model on top of the basic “function” level encapsulation. The nesC computational model is integral with the TinyOS runtime environment,
which itself is mostly written in nesC. TinyOS is actually included into the application code during compilation, so that the resulting binary program is one monolithic executable that can be downloaded onto the wireless sensor computer and contains everything necessary for execution. The execution model of nesC is event-based and mostly synchronous, with events, commands, and function calls all occurring synchronously (upon the occurrence of an external event). However, the language also has tasks. Tasks are asynchronously executed. A nesC program can “post” a task, which simply indicates that it needs to run eventually; the code that does the posting then continues executing, and eventually at some later time, the task will execute. Thus the overall execution model is one of quiescent waiting for events, which then trigger some computation, starting at the event handler and possibly invoking commands and posting tasks; once all are done, execution then returns to the quiescent state, waiting for the next event. The concurrency model is a simple one: events and commands execute to completion, non-preemptively. Tasks will execute sometime after they are posted (and after the event handler runs to completion), and they can be preempted by a later event, but they do not preempt each other. Code in a task that must be performed without preemption can be encapsulated in an “atomic” statement. Tasks are not prioritized and are executed on a first come first served basis. The TinyOS development environment comes with a simulator, TOSSIM [9], which can simulate a nesC program. It is a flexible environment in which events can be scripted to occur, thus triggering program execution. TOSSIM provides the ability to simulate the hardware-generated events which drive the nesC program’s execution, but it is not an interpreter-based environment for the code: in TOSSIM, the nesC program, along with TinyOS, is compiled into native code on the development workstation. There is one major difference between the TOSSIM environment and real nesC program execution: tasks are never preempted in the TOSSIM environment. This is a severe constraint when trying to use this environment to understand potential real program behavior.
3.
MONITORING IN TOSSIM
Because of the fact that instrumentation and data collection is so hard on the actual wireless sensor hardware that is used in the field, our approach here is to instrument the simulated environment and learn as much about the application as possible in this easier environment before trying to instrument and gather data from the deployment environment. This section discusses this approach.
3.1
Instrumentation
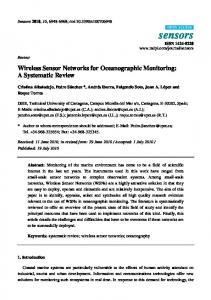
The nesC tool chain uses a preprocessor to translate nesC code into C code, and then uses gcc to compile the C code into the target machine code. Because of this, we were able to take advantage of built-in capabilities for instrumentation. This was important because the nesC tool chain is rather brittle; outside of the nesC development group, virtually everyone uses a pre-compiled and pre-configured tool chain. In particular, compiling a C program under gcc with a flag requesting profiling is an easy, lightweight mechanism for introducing function-level instrumentation. For all non-main functions, the profiling flag causes gcc to insert a call to a
Figure 1: Instrumentation Framework. no-parameter function named “mcount” at the beginning of each function body. By creating our own “mcount” function and ensuring that the linking step links to ours and not the normal profiling library, we are able to have instrumentation on the resulting binary program without tampering with the nesC tool chain. Figure 1 shows the overall instrumentation architecture that we created. Our custom “mcount” function does three main actions: • it finds its own return address and uses it to determine which function was invoked; since “mcount” is always called at the beginning of a function, the return address is always a small constant offset from the function symbol’s address value; • it saves the application function’s return address and modifies it to point to another custom function, “ecount”; this function is instrumentation that will be invoked when the application function finishes; and • it records the current process execution time in as high of precision timer as the underlying operating system allows. There are other minor bookkeeping things that are done, such as saving and restoring registers, etc., but the main needs are to identify the application function, connect in an end-of-function instrumentation hook, and record the current time. The “ecount” instrumentation then records the time of function finish, patches up the stack, and uses the saved return address to return back to the calling application function. The complete instrumentation package also depends on the generic “ init” and “ fini” initialization and finalization functions for shared libraries, in order to set up at the beginning and clean up and report results at the end of program execution. With this instrumentation, we can capture a whole trace of program execution, or selectively generate aggregate statistics and report only those desired. This approach is also almost completely independent of TOSSIM (see Section 3.3), so that its same techniques and tools can be applied either to other simulation environments (that still use the nesC toolchain) and also to real field deployments.
3.2
From C to nesC
The resulting output from the instrumentation only reflects the nesC program insofar as its translation to a C
program allows. For application developers to understand what their nesC program is doing, we need to present information about the nesC program, not its underlying C representation. Fortunately, the translation is not too difficult. The translator uses very basic rules in generating the C program. The C program is a collection of functions, where: • the name of a function is a composition of the component name and the event, command, or task in the component, separated by a $ (similar to C++ name mangling of class and method names); • an event handler is translated into one C function; • a command is translated into one C function; • a nesC function is translated into a C function; and • a task is translated into two C functions, one with a suffix of “postTask”, and one with a suffix of “runTask”; the first is executed to post the task for later execution, the latter is the actual task code to be run. It is not possible, given only the C code, to distinguish between nesC event handlers, commands, and simple functions. Our future work includes an automatic extractor, but currently we manually list the C function names and tag them with their appropriate nesC feature name. Thus, given the trace of the C program, we can reconstruct the behavior of the nesC program in terms of the nesC concepts it embodies (events, commands, tasks), and in terms of how the programmer is actually thinking about their program.
3.3
Timing Information
In capturing the trace of the nesC/C program, there are two independent time clocks that are useful: TOSSIM itself keeps a simulation time clock, and there is the real execution time of each piece of the compiled nesC program. TOSSIM does not simulate the execution time of the code, it only simulates event occurrence times; thus, for example, a task posted from event-handling code will be run at essentially the same simulation time as the event itself, disregarding the delay from the execution of the event handling code itself. We capture the simulation time clock for each event occurrence and for each task run; we also capture the real beginning and ending timestamps for each C function call (which are nesC events, commands, tasks, and functions). From this we can partially reconstruct important timing information about the nesC program. In nesC concepts, important timing information entails: • the interval between occurrences of the same event; • the delay from when a task is posted to when it begins execution; • the overall duration of processing that occurs in response to an event; • the overall duration of a task; • how often and for how long a task is preempted; and • the overall duty cycle of processing. The first item is computed purely in simulation time. The second item must be computed from both simulation time and real processing time. The rest are computed purely from real processing time. Since the simulation platform is a much more powerful computer (a workstation) than the typical wireless sensor, in this paper we currently scale the real time by a very conservative factor of 10; future
work will involve using measurements to correctly deduce the proper scaling of real processing time. As mentioned earlier, TOSSIM does not simulate preemption of tasks; therefore, this is unavailable in our timing measurements, and indeed is a significant mismatch between the simulated and real environments when it comes to understanding program behavior.
3.4
Fidelity of Simulation to Real World
A natural concern when instrumenting a simulated environment is whether or not the knowledge learned from the simulated environment is usable and transferable to what will be experienced in the real world. For now we are considering a full study of the fidelity of the measurements under TOSSIM to be future work (indeed it is our next step), but even without these results we can make statements about our achievements so far. • The depictions of internal software behavior are correct with respect to the real world, with the noted exception that TOSSIM does not simulate preemption of tasks. • The statistics regarding event arrivals are correct insofar as they will match what was programmed into the simulated model. TOSSIM is a scripted environment that allows I/O and event models to be crafted according to the needs of the tester. • The execution timing statistics are reflective of the TOSSIM development platform and not directly of the sensor network hardware; despite this, these statistics should be scalable to the sensor network hardware and should give an idea of the expected performance. Our goal is ultimately to use the statistics gathered under simulation to intelligently place lightweight instrumentation on the actual hardware, and use what is gathered there to map the simulation statistics to expected performance on the actual hardware. This would take advantage of the strengths of both environments.
3.5
Putting it All Together
Our instrumentation produces text files representing the trace information gathered from the C program that represents the nesC program. Therefore, we use post-processing tools to translate and aggregate the information and make it usable for the developer. The description of translating from C functions back to nesC events, tasks, and commands has already been given, so here we describe the other parts of post-processing. The timing information is aggregated to produce averages for the timing statistics noted above, most importantly the arrival interval of events, the delay interval from task posting to task execution, and the execution time for event and task processing. Note that execution time for events and tasks subsumes the execution time for all commands or functions that the event or task calls. This is because what is important to the user is figuring out how quickly the code that handles some functionality finishes, and whether or not it is sufficiently fast enough to keep up with their expected “worst case” scenario of arrival times. Finally, we present the behavior of the program as UML sequence diagrams, using the UMLGraph drawing tool [13]. Firstly, we generate a sequence diagram for the full detailed behavior of the nesC program. This is often very repetitive,
but is useful for the user to get an overall picture of the program behavior. The user can zoom in and view one instance of the repetitive behavior, and from the overall view can quickly identify any visually anomalous patterns. Secondly, a summary diagram is produced to display the general timing statistics. This diagram is not meant to show topto-bottom logical behavior, but is only meant to provide a visual context in which to show aggregate timing statistics.
4.
EXAMPLES
In this section we show the capabilities of tosTracer on very basic “canonical” TinyOS example programs. Figures 2 and 3 show detail and summary output respectively from a TinyOS program that senses a non-trivial sensor. This sensor needs time to process its data, and thus it fires a “ReadDone” event when it is finished and the data is ready. Thus, one sees a two-phase operation in the sensing cycle, where a timer event is triggered, followed by a “ReadDone” event in which further processing takes place. These diagrams are similar in nature to the BlinkTask diagrams Figures 2 and 3 show the application behavior, but actually filter out all of the detail of what TinyOS is doing. Recall that TinyOS and the application are compiled together, so what tosTracer actually captures is not only the application behavior, but indeed the behavior of everything inside TinyOS as well. While this would be much too large to show in a diagram here, Figure 4 shows the BlinkTask example from above, with the invocations within one TinyOS component that is one level in from the application invocations. This diagram is not meant to be readable here, only to show that the data collected from tosTracer can be used at more detail than just the application.
5.
This means that we will usually not receive a complete picture of what is happening on the real hardware, but we can still use the information we do get to refine and validate the information obtained from the simulation, which was fully instrumented. We are actively improving this approach, and our current status is that it is all working except that we are still experimenting with ways in which to get detailed timing information; the standard mechanisms for checking time are too coarse grained for software monitoring.
6.
RELATED WORK
In the wireless sensor network arena of embedded systems development, there is quite a bit of work on programming models and component frameworks (e.g., [11]), but relatively little work on helping developers understand their program behavior and to verify and validate their software. Most work on analyzing the software for sensornets has been focused on verifying or understanding the network communication (e.g., [2, 4]), or analyzing and predicting power consumption and duty cycles (e.g., [12, 14]). There is just beginning some work in tools for assertion checking and correctness checking [1, 10]. Others have pointed up the need for more and broader software engineering support in this area [6]. In a very recent work, Landsiedel et. al [8] also use TOSSIM as a base from which to do more accurate timing simulation, and their instrumentation may be similar to ours. They are focused on timing exactness, however, and not on capturing the behavior of the software. In a different approach, Mohan et. al [7] used a timing model of the Atmega processor and its instructions to statically analyze compiled nesC code and determine its timing performance.
MONITORING IN THE FIELD
Our work in monitoring on real sensor hardware and in the field is very preliminary; however, we do have the basic infrastructure prototyped and are beginning to study the fidelity of the timing information produced from the simulation monitoring. As mentioned, our basic approach in using the features of gcc in the nesC toolchain is applicable to generating instrumentation for field deployable code. The backend for gcc for the hardware we have (Crossbow Atmel-based sensors) recognizes the -pg flag but does not generate profiling calls to “mcount”; rather, it simply inserts placeholder NO-OP instructions. Our solution is to use the gcc “-S” flag to generate assembly code for the nesC program. With a list of function names that need monitored (derived from the nesC component and event/command/task names), we process the assembly code and insert calls to a nesC “Log” component with a “log” command; each call site has a unique integer ID. Our specially written log component locally stores the timestamp and ID of each logging instance, and when a log timer expires the component will send the data available. We do not just send the data any time the logging buffer fills up because this can happen very quickly in some software monitoring scenarios. Thus, to limit monitoring overhead, we restrict sending data to at most once per configured time interval. If more log data is generated than can be saved before the next send, then we just throw away the older data and send the most recent data.
7.
CONCLUSION
In this paper we described a lightweight method for extracting behavior information from a nesC/TinyOS program that is running under the TOSSIM environment, and the beginnings of gathering additional information from the field. We accomplished this by building our own instrumentation that takes advantage of the compiler’s ability to add profiling hooks into the executable; this approach was advantageous because of the complexity and fragility of the environment’s development tool chain. With this approach, we are able to generate useful information about the execution of the program, and about TinyOS itself, albeit mostly in the simulation environment so far. Our future goals are threefold. One is to add more capability to the TOSSIM instrumentation. With the basic infrastructure, we can do much more in terms of capturing information about the execution than just the timing information. For example, we can access data elements in the simulated program, such as buffers or other data, and capture changing values or specific snapshots for later analysis. Secondly, we are continuing to work on runtime instrumentation for in-field deployment of wireless sensor programs. Our goal here is to use the information from the TOSSIM environment to minimize the instrumentation needed on real hardware, and to use the real hardware instrumentation to validate the fidelity of the information obtained from the simulated environment, thus making them complement
Scheduler
SenseC_Timer_fired [Event]
SenseC_Read_readDone [Event]
SenseC_Boot_booted [Event]
SenseC_Read_read [Command/Function]
SenseC_Leds_led0On [Command/Function]
SenseC_Leds_led1On [Command/Function]
SenseC_Leds_led2On [Command/Function]
SenseC_Timer_startPeriodic [Command/Function]
Fire @ 0:0:0 Call
Fire @ 0:0:0.391 Call
Fire @ 0:0:0.431 Call
Call
Call
Fire @ 0:0:0.488 Call
Fire @ 0:0:0.528 Call
Call
Call
Figure 2: Sense and Read Detail Diagram. Activation box lengths are abstract and are not scaled to real time durations of activity.
Scheduler
SenseC_Timer_fired [Event]
SenseC_Read_readDone [Event]
SenseC_Boot_booted [Event]
N = 125 I: 0.098/0.098/0.097
T: 0.009/0.04/0 N = 125 I: 0.098/0.138/0.057
T: 0.004/0.04/0 N=1 I: 0/0/0
T: 0.04/0.04/0.04 I: Interval Time T: Duration Time D: Delay Time
Figure 3: Sense and Read Summary Diagram. Numbers are average/maximum/minimum values; I is interevent interval, T is execution time duration.
Scheduler
BlinkTaskC_Timer0_fired [Event]
BlinkTaskC_Boot_booted [Event]
BlinkTaskC_Leds_led0Toggle [Command/Function]
BlinkTaskC_Timer0_startPeriodic [Command/Function]
LedsP_Init_init [Command/Function]
LedsP_Led0_makeOutput [Command/Function]
LedsP_Led1_makeOutput [Command/Function]
LedsP_Led2_makeOutput [Command/Function]
LedsP_Led0_set [Command/Function]
LedsP_Led1_set [Command/Function]
LedsP_Led2_set [Command/Function]
LedsP_Leds_led0Toggle [Command/Function]
LedsP_Led0_toggle [Command/Function]
LedsP_Led0_get [Command/Function]
BlinkTaskC_toggle [Task]
Call Call
Call
Call
Call
Call
Call
Fire Call
Fire Post
Run Call Call Call
Call
Fire Post
Run Call Call Call
Call
Fire Post
Run
Figure 4: Blink with TinyOS 1-Component Diagram. each other. Finally, we are going to pursue using the information gathered to help construct and verify static models of program behavior. NesC programs are small enough that static verification should be generally feasible, and the design of TinyOS was intended for doing such “whole-program” analyses, though to date few have been done.
8.
REFERENCES
[1] W. Archer, P. Levis, and J. Regehr. Interface contracts for tinyos. In IPSN ’07: Proceedings of the 6th international conference on Information processing in sensor networks, pages 158–165, New York, NY, USA, 2007. ACM. [2] C. Buschmann, D. Pfisterer, S. Fischer, S. P. Fekete, and A. Kr¨ oller. Spyglass: a wireless sensor network visualizer. SIGBED Review, 2(1):1–6, 2005. [3] D.Gay, P.Levis, R.Behren, M.Welsh, E.Brewer, and D.Culler. The nesC language: A Holistic Approach to Networked Embedded Systems. In Proc. ACM SIGPLAN 2003 Conference on Programming Language Design and Implementation, pages 1–11, New York, NY, USA, 2003. ACM. [4] Y. Hanna, H. Rajan, and W. Zhang. Slede: A Domain-Specific Verification Framework for Sensor Network Security Protocol Implementations. In Proc. First ACM Conference on Wireless Network Security, page to appear, Mar. 2008. [5] J. Hill, R. Szewczyk, A. Woo, S. Hollar, D. Culler, and K. Pister. System architecture directions for networked sensors. SIGPLAN Not., 35(11):93–104, 2000. [6] J.Blumenthal, M.Handy, F.Golatowski, M.Haase, and D.Timmermann. Wireless Sensor Networks - New Challenges in Software Engineering. In Proc. 2003 Emerging Technologies and Factory Automation, pages 551–556. IEEE Computer Society Press, Sept. 2003. [7] S. Mohan, F. Mueller, D. Whalley, and C. Healy. Timing analysis for sensor network nodes of the atmega processor family. In 11th IEEE Real Time and Embedded Technology and Applications Symposium,
[8]
[9]
[10]
[11]
[12]
[13] [14]
pages 405–414, Los Alamitos, CA, USA, 2005. IEEE Computer Society. K. W. Olaf Landsiedel, Hamad Alizai. When Timing Matters: Enabling Time Accurate & Scalable Simulation of Sensor Network Applications. In International Conference on Information Processing in Sensor Networks, pages 344–355, Los Alamitos, CA, USA, 2008. IEEE Computer Society. P.Levis, N.Lee, M.Welsh, and D.Culler. TOSSIM: Accurate and Scalable Simulation of Entire TinyOS Applications. In Proc. 1st International Conference on Embedded Networked Sensor Systems, pages 126–137, New York, NY, USA, 2003. ACM. J. Regehr, A. Reid, K. Webb, M. Parker, and J. Lepreau. Evolving real-time systems using hierarchical scheduling and concurrency analysis. Real-Time Systems Symposium, 2003. RTSS 2003. 24th IEEE, pages 25–36, 3-5 Dec. 2003. Shah Bhatti and James Carlson and Hui Dai and Jing Deng and Jeff Rose and Anmol Sheth and Brian Shucker and Charles Gruenwald and Adam Torgerson and Richard Han. MANTIS OS: An Embedded Multithreaded Operating System for Wireless Micro Sensor Platforms. Mobile Networks and Applications, 10(4):563–579, 2005. V. Shnayder, M. Hempstead, B. rong Chen, G. W. Allen, and M. Welsh. Simulating the power consumption of large-scale sensor network applications. In SenSys ’04: Proceedings of the 2nd international conference on Embedded networked sensor systems, pages 188–200, New York, NY, USA, 2004. ACM. D. Spinellis. On the declarative specification of models. Software, IEEE, 20(2):94–96, 2003. Z. Yao, Z. Lu, H. Marquardt, G. Fuchs, S. Truchat, and F. Dressler. On-demand software management in sensor networks using profiling techniques. In REALMAN ’06: Proc. 2nd int’l workshop on Multi-hop ad hoc networks: from theory to reality, pages 113–115, New York, NY, USA, 2006. ACM.