not common practice in spatial statistics as the method of moments and minimum contrast ...... Pn denote a solution of the score equations (1.9) based on.
Likelihood Devices in Spatial Statistics Aannemelijkheids Listen in de Ruimtelijke Statistiek (met een samenvatting in het Nederlands)
PROEFSCHRIFT TER VERKRIJGING VAN DE GRAAD VAN DOCTOR AAN DE UNIVERSITEIT UTRECHT OP GEZAG VAN DE RECTOR MAGNIFICUS, PROF. DR H.O. VOORMA INGEVOLGE HET BESLUIT VAN HET COLLEGE VOOR PROMOTIES IN HET OPENBAAR TE VERDEDIGEN OP VRIJDAG 3 SEPTEMBER 1999 DES OCHTENDS TE 10.30 UUR
door Erik Willem van Zwet geboren op 10 november 1970, te ’s-Gravenhage
Promotor: Prof. dr R.D. Gill Faculteit der Wiskunde en Informatica
1991 Mathematics Subject Classification: 62M30 van Zwet, Erik Willem Likelihood Devices in Spatial Statistics Erik Willem van Zwet – Utrecht: Universiteit Utrecht, Faculteit Wiskunde en Informatica Proefschrift Universiteit Utrecht. – Met lit. opg. Met samenvatting in het Nederlands. ISBN 90-393-2154-X
Contents 1 Introduction 1.1 Context and scope . . . . . . . . . . . . . . . . . . . . 1.2 Three problems . . . . . . . . . . . . . . . . . . . . . . 1.3 Independence, Poisson processes and Boolean models . . . . . . . . . . . . . . . . . . . 1.4 Semi-parametrics . . . . . . . . . . . . . . . . . . . . . 1.4.1 Nonparametric maximum likelihood estimation 1.4.2 Consistency of the (NP)MLE . . . . . . . . . . 1.4.3 Score equations . . . . . . . . . . . . . . . . . . 1.4.4 Missing data problems and the EM algorithm . 1.5 Perfect Simulation . . . . . . . . . . . . . . . . . . . . 1.5.1 Coupling From The Past . . . . . . . . . . . . . 1.5.2 Stochastic EM . . . . . . . . . . . . . . . . . . . 1.5.3 Perfect Stochastic EM . . . . . . . . . . . . . . 2 Laslett’s line segments 2.1 Introduction . . . . . . . . . . . . . . . . . . 2.1.1 Inference for ergodic point processes 2.1.2 Laslett’s line segment problem . . . . 2.1.3 Some history . . . . . . . . . . . . . 2.1.4 Scope of our contribution . . . . . . 2.2 A re-parameterization . . . . . . . . . . . . 2.3 Poisson . . . . . . . . . . . . . . . . . . . . . 2.4 EM . . . . . . . . . . . . . . . . . . . . . . . 2.5 Without the Poisson assumption . . . . . . . 2.5.1 Expanding domain asymptotics . . . 2.5.2 Some extra censoring . . . . . . . . . 2.5.3 ergodic lemmas . . . . . . . . . . . . 2.6 An estimator for the line segments . . . . . 1
. . . . . . . . . . . . .
. . . . . . . . . . . . .
. . . . . . . . . . . . .
. . . . . . . . . . . . .
. . . . . . . . . . . . .
. . . . . . . . . . . . .
. . . . . . . . . . . . . . . . . .
. . . . . . . . . . . . .
. . . . . . . . . .
. . . . . . . . . . . . .
. . . . . . . . . .
. . . . . . . . . . . . .
3 3 5
. . . . . . . . . .
8 9 10 12 16 19 22 23 25 26
. . . . . . . . . . . . .
31 31 32 37 38 39 39 44 51 57 58 60 61 67
2
CONTENTS
3 Chord Length Estimation 3.1 Introduction . . . . . . . . . . 3.2 The chord length distribution 3.3 Digression: A related problem 3.4 Back to the chord lengths . . 3.5 A simulation . . . . . . . . . . 3.6 The linear contact distribution 4 The 4.1 4.2 4.3 4.4
. . . . . .
. . . . . .
. . . . . .
. . . . . .
. . . . . .
. . . . . .
. . . . . .
. . . . . .
. . . . . .
. . . . . .
. . . . . .
. . . . . .
. . . . . .
. . . . . .
. . . . . .
. . . . . .
Bombing Model Introduction . . . . . . . . . . . . . . . . . . . . . . . . . . The conditional Boolean model . . . . . . . . . . . . . . . Coupling from the past for the conditional Boolean model Maximum likelihood . . . . . . . . . . . . . . . . . . . . . 4.4.1 MCMC approach . . . . . . . . . . . . . . . . . . . 4.4.2 EM . . . . . . . . . . . . . . . . . . . . . . . . . . . 4.5 An example . . . . . . . . . . . . . . . . . . . . . . . . . . 4.6 Sampling from general point processes . . . . . . . . . . . 4.6.1 spatial birth-and-death processes . . . . . . . . . . 4.6.2 the anti-hereditary case . . . . . . . . . . . . . . . . 4.6.3 the hereditary case . . . . . . . . . . . . . . . . . .
. . . . . . . . . . . . . . . . .
. . . . . .
71 71 73 76 80 80 82
. . . . . . . . . . .
87 87 89 92 100 100 101 103 106 108 109 112
References
115
Acknowledgements
121
Samenvatting
123
Curriculum Vitæ
127
Chapter 1 Introduction 1.1
Context and scope
This thesis deals with spatial statistics, or more precisely, with the statistical analysis of spatial data. The spatial data we consider are random configurations of points, line segments or discs in the two dimensional plane. Such random ‘processes’ could serve, and have served, to model a wide variety of real life phenomena. The points may represent the locations of trees in a forest, the line segments could be fractures in a rock surface and the discs could be cells under a microscope. Usually, we observe these spatial processes through a bounded window while we imagine they extend throughout the entire plane. As a result, we often have to deal with ‘edge-effects’. For instance, observing a collection of line segments through a bounded window some of the segments will be clipped at the window’s boundaries. Such censoring has been studied extensively in the one dimensional case. The line segments then represent lifetimes which are sometimes not completely observed. Estimation of the lifetime distribution from incomplete observations is the main subject of the field of survival analysis. Laslett (1982a, b) was the first to point out the analogy of censoring in survival analysis and edge effects in spatial statistics. Our goal in this thesis is always to estimate the probability distribution of the (partly) observed random spatial process. Sometimes this distribution is determined by a finite dimensional parameter, such as the expected number of points in a given set. At other times this will not be the case and then we speak of a semi- or nonparametric problem or of a problem with a ‘large parameter space’. In recent years estimation of infinite dimensional parameters has received much attention and has made great headway. Bickel et al. (1993) is a standard reference for modern semi-parametric theory. In3
4
Chapter 1. Introduction
complete observation, such as due to edge effects, is well incorporated in the theory. One of the main themes of this thesis is the application to spatial data of semi-parametric methods. Another, closely related theme is maximum likelihood estimation from spatial data. Maximum likelihood estimation is not common practice in spatial statistics as the method of moments and minimum contrast methods are more often applied (Stoyan et al. 1987). One might view our effort in the light of a development which has been described—somewhat provocatively—by Geyer (1999):
“Exotic areas of statistics, such as spatial statistics in general and spatial point processes in particular often recapitulate the history of statistics. The first formal inference is nonparametric, using method of moments estimators. At this stage there is no modeling. Ordinary statistics was in this phase a century ago with Pearson families of curves fit by method of moments. Time series was in this phase in the 1950s with spectral analysis. Spatial statistics was in this phase in the 1970s. Ripley’s K-functions are an example. So is spatial autocorrelation analysis of lattice processes. The next phase involves the introduction of parametric statistical models, efficient estimation methods, and hypothesis tests, which happened in ordinary statistics in the 1920s and 1930s, in time series in the 1960s, and is only now happening in spatial statistics. ”
The thesis is organized around three problems: Laslett’s line segment problem; estimation of the chord length distribution; and estimation for the bombing model. We describe these problems in section 1.2 of this introduction and return to each of them in the next three chapters. In the remainder of this chapter we gather some theory and tools for later reference. In particular, we briefly discuss the issue of independence in spatial processes and introduce the Poisson process and the related Boolean model. Next, we discuss some topics in semi-parametrics and finally consider Markov Chain Monte Carlo methods and perfect sampling. We want to draw the reader’s special attention to two topics to which we contribute something new. The first is a general discussion of consistency of maximum likelihood estimators in section 1.4.2. The second is a modification of a stochastic version of the well-known EM algorithm (Dempster et al. 1977, Celeux and Diebolt 1986) in section 1.5.3.
1.2 Three problems
1.2
5
Three problems
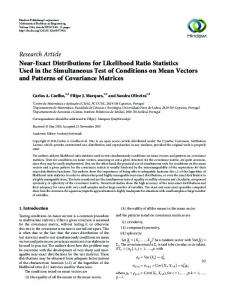
In this thesis we analyze three spatial missing data problems. In all of these we are unable to write down the likelihood of the data, let alone maximize it. This seems typical of spatial statistical estimation problems and explains why maximum likelihood is usually not the preferred approach. In each of the first two of our problems we manage to find ‘analogous’ problems, which are simpler yet similar. For these analogous problems we can perform maximum likelihood estimation. Thus we obtain estimators that are MLEs—only not for the actual problems at hand! Still, if the simplifications are minor we may expect that the nice properties that an MLE typically possesses will be preserved, at least to a certain degree. Efficiency will generally fail, but consistency and asymptotic normality may not. We shall study consistency only, but we feel confident that it would be also possible to tackle asymptotic normality. Although the first two problems both concern line segments and our approach to them is similar, we should point out that they really are quite different. In the first problem we have to deal with spatial dependence among the data. The difficulty with the second problem is that the data are in the form of random functions on random sets. In the third problem, concerning the Boolean model of randomly placed discs, our difficulties are of a different nature still. The likelihood is easy enough, except for an intractable normalizing constant. No simplification will help and so the emphasis shifts from analytic methods to a Monte Carlo approach. In particular, we present a new algorithm to sample from the distribution of a wide variety of point processes. We now briefly state our three problems and point out their particular difficulties. We do not as yet strive for mathematical rigor, but merely wish to indicate where we are going—and hopefully whet the reader’s appetite. Laslett’s line segments Figure 1.1 is a map of an area of about 160 by 160 meters of the Canadian Shield near Manitoba. The black parts are the rock surface, the white parts are soil, vegetation or water. The white lines through the black regions indicate fractures and the problem is to estimate the distribution of their lengths. This is a missing data problem because the fractures are unobservable in the white regions and outside the 160 by 160 meters area of the map. The particular difficulty here lies in the fact that the (black) observation region is not convex. This means that of a single fracture we might observe several fragments. Because the resolution of the map is rather poor, it is impossible
6
Chapter 1. Introduction
to know if two fragments belong to the same fracture. The fractures are conveniently modeled by a location and an associated line segment. By ‘location’ we mean, for instance, the location of a preferred point on the segment, such as the mid point or the left-hand end-point. In earlier contributions, the case of a convex observation window was considered. Assuming the locations and line segments to be a Poisson marked point process one finds that the fractures are independent. Standard methods can then be applied to compute the (non-parametric) maximum likelihood estimator (Gill 1994, Wijers 1995a and b). For us there is no gain in assuming that the locations of the fractures are Poisson, because even if the fractures are independent some of the fragments are certainly dependent. Chord Length Estimation Consider a random closed set W ⊂ R2 . With each point in W we can associate a chord in a given direction which is the longest line segment through that point which lies wholly within W. Also, with each point in W c = R2 \W we can associate a contact segment (our terminology) in a given direction which is the longest line segment starting at that point which is completely contained in W c . Of course these two concepts are closely related. The problem is estimation of the distribution function of a typical chord and a typical contact segment, when we observe W through a compact set B. This is a missing data problem because some chords and contact segments are clipped at the boundaries of B. The particular difficulty here is that for every point in W, respectively W c we have a chord or a contact segment. Such continuous data is awkward and we are unable to apply standard methods for missing data problems. The Bombing Model Consider the so-called Boolean model in R2 where at each point of a Poisson point process of intensity λ, a disc of random radius is placed. This model is also known as the bombing model. We observe only the union of the discs through a compact window W . In this example data is missing as some discs are not observed because they are covered by others. Also there is the usual censoring at the observation window’s boundaries. For our present purpose, estimation of the intensity parameter λ, the latter censoring is not the main difficulty. The difficulty is that the conditional distribution of the complete data, given the observed data involves a normalizing constant which cannot possibly be evaluated. Again, standard methods for missing data problems fail.
1.2 Three problems
7
Figure 1.1: Fractures in 160 m. by 160 m. granitic rock of the Lac du Bonnet batholith in Manitoba. From Stone, Kamineni and Brown (1984). Digitized and post-processed by professor A.J. Baddeley of the University of Western Australia. The irregular black region is the rock’s surface. The white parts represent areas where the rock cannot be observed due to soil, vegetation or water. The white lines through the black regions indicate fractures.
8
Chapter 1. Introduction
1.3
Independence, Poisson processes and Boolean models
This section borrows its title from section 1.5 of Baddeley (1999a). It contains some basic facts concerning the Poisson process in more general spaces than R+ , and introduces the Boolean model. The Poisson process and the Boolean model—which is derived from it—are perhaps the simplest of all spatial models. They have been studied in detail, for instance in Daley and Vere-Jones (1988) and Stoyan et al. (1987). The content of this section can be said to be part of the folklore of stochastic geometry. Classical statistics deals typically with independent, identically distributed random variables. An essential element of spatial statistics is a lack of independence. Suppose that X is a random spatial process of, say, randomly placed points. If there is any spatial structure or regularity, then typically we fail to have independence of X ∩ A and X ∩ B, even when A and B are disjoint. The prime example of a completely random point process is the Poisson process. We now give a rather general definition. Let (S, B, Λ) denote a measure space with a finite diffuse Radon measure Λ. A typical example is the case where S is a compact subset of R2 with the Borel sigma-algebra and Λ(ds) = λds. Consider the ‘Carter–Prenter exponential space’ Ω of all finite subsets x of elements of S with a sigma-algebra F generated by sets {x ∈ Ω : n(x ∩ B) = n} (B ∈ B), where n(x) denotes the number of elements in x. The Poisson process Φ of intensity Λ can be seen as a random (counting) measure on (S, B) or as a measure on (Ω, F ). By Φ(B) we denote the (random) number of points of Φ that fall in a B-measurable set B. The Poisson process is determined by the following two properties 1. P (Φ(B) = n) = Λ(B)n e−Λ(B) /n!,
for n = 0, 1, 2, . . . , for all B ∈ B
2. Φ(B1 ), Φ(B2 ), . . . , Φ(Bk ) are independent for disjoint B1 , B2 , . . . , Bk . R Note that EΦ(B) = Λ(B) = B Λ(ds). The expected number of points in a set B has the Poisson distribution with parameter Λ(B). Conditionally on Φ(B) = n, the points of Φ ∩ B are distributed as a sample of size n from the ‘normalized intensity’ Λ(S)−1 Λ(ds). Poisson processes have a nice ‘superposition’ property: The superposition (union) of independent Poisson processes is again a Poisson process, whose intensity is the sum of the intensities of the individual processes. It is often useful to associate with each point of a point process a characteristic or ‘mark’. For instance, when the points indicate locations (of the
1.4 Semi-parametrics
9
midpoint) of fractures in a rock surface, an extra mark could indicate each fracture’s length or direction. When the points represent (the center of) trees in a forest the mark could be their stem’s diameter. Now suppose we have a point process Φ = {Si } on a space S. Suppose with each point Si is associated a random mark Mi in some ‘mark space’ M, equipped with a probability measure P . Then the ‘Marking Theorem’ states that the following are equivalent • The point process Φ is Poisson with intensity Λ and conditional on Φ, the marks are i.i.d. according to P . • The marked point process {(Si , Mi )} is a Poisson process on S × M with intensity measure Λ × P . As a consequence of the Marking Theorem we have the ‘thinning’ property of Poisson processes: Suppose we have a Poisson process of intensity Λ. Now if we delete each point, independently of the others, with probability 1 − p, the result will be a Poisson process with intensity pΛ. Above we gave two examples of marked point processes; one representing a random collection of line segments (fractures), the other of circles (trees with specified stems). When the underlying point process is Poisson, such collections of randomly placed objects are called Boolean models (Matheron 1975, Stoyan et al. 1987). More precisely, suppose that Φ = {Si } is a Poisson process on Rd and suppose that Ξ1 , Ξ2 , . . . are a sequence of independent, identically distributed random closed sets in Rd . Then the Boolean model is defined as ∪i (Si ⊕ Ξi ). The symbol ⊕ means Minkowski addition defined as A ⊕ B = {a + b, a ∈ A, b ∈ B}.
1.4
Semi-parametrics
In this section we introduce the maximum likelihood estimator (MLE) Pˆn of a probability measure P0 among a class P which we allow to be infinite dimensional. In this situation, the MLE is often called the nonparametric MLE (NPMLE). Also, we discuss differentiable, parametric sub-models through P. Each such submodel will have a score function. With these scores, we can consider solutions of score equations. We discuss consistency of the NPMLE and of solutions of score equations. Other desirable properties we might look for in estimators, such as efficiency and asymptotic normality will not be touched upon in this thesis and are therefore omitted in the present discussion. Finally, we also consider so-called missing data problems, which go also by the name ‘mixture models’.
10
Chapter 1. Introduction
A standard reference on semi-parametrics is the monograph by Bickel et al. (1993). Our exposition here owes much to the very readable chapter 25 on semi-parametrics of a recent book by van der Vaart (1998).
1.4.1
Nonparametric maximum likelihood estimation
In this section we define the so-called nonparametric maximum likelihood estimator (NPMLE). Consider random variables X1 , X2 , . . . , Xn which are independent and identically distributed according to some distribution P0 in a class P of probability measures. When P is not dominated by a single measure, the ordinary definition of the maximum likelihood estimator fails because there really is no likelihood. Kiefer and Wolfowitz (1956) proposed a way out of this difficulty by considering only pairwise comparisons. Now let Pn denote the empirical measure. Definition 1.1. A maximum likelihood estimator Pˆn of P0 ∈ P is any element of P such that Z Z dPˆn dP log dPn ≥ log dPn ∀P ∈ P, (1.1) ˆ ˆ d(Pn + P ) d(Pn + P ) while for every P ∈ P, the left hand side is greater than minus infinity. The latter requirement is a technicality. Its meaning will become clear in Lemma 1.1 below. The definition says that Pˆn should ‘beat’ any other candidate on the data in pairwise comparison. Note that as we only compare two measures at a time, P need not be dominated. Note also that if P is dominated the definition reduces to the ordinary definition of maximum likelihood. The definition depends on which versions of the Radon-Nikodym derivatives are used. These versions are only determined up to (P1 + P2 ) null sets (when comparing P1 and P2 in P), which are not necessarily Pn null sets. This problem has nothing to do with the fact that P may be undominated or infinite dimensional. It arises in parametric models just the same. It is generally felt that there should not be a problem—certainly not asymptotically—if we assume “what are known in some quarters as the British regularity conditions”, to quote Cox (2000) (on a different matter). For a more thorough discussion see Scholz (1980). For definiteness, we imagine that we have some mechanism to choose a version of each Radon–Nikodym derivative dP/d(P + Q) for all P, Q ∈ P in advance, thus making sure that our choices do not depend on the data.
11
1.4 Semi-parametrics
Moreover, we do this in such a way that 0 ≤ dP/d(P +Q) ≤ 1 and dP/d(P + Q) + dQ/d(P + Q) = 1. We find the definition of the NPMLE in its present form (1.1) slightly awkward and prefer to have a definition in terms of ‘log likelihood ratios’, see (1.2) and (1.3) below. Let us now define the likelihood ratio and log likelihood ratio. Consider two probability measures P1 and P2 in P, where P2 need not dominate P1 . Define the likelihood ratio to be dP1 (dP1 /d(P1 + P2 ))(x) (x) = . dP2 (dP2 /d(P1 + P2 ))(x) This likelihood ratio should of course not be confused with the Radon– Nikodym derivative, which conventionally is defined only when P1 ≪ P2 . Because we can choose versions of the numerator and denominator which add up to 1, there are no problems with dividing zero by zero. If the numerator is positive while the denominator is zero, the ratio is defined to be infinite. Lemma 1.1. The defining property (1.1) of the NPMLE Pˆn is equivalent to Z
log
dPˆn dPn ≥ 0 ∀P ∈ P, dP
(1.2)
Z
log
dP dPn ≤ 0 ∀P ∈ P. dPˆn
(1.3)
and also to
Proof This lemma is immediate from our definition of likelihood ratio. The assumption that the left hand side of (1.1) is greater than minus infinity is equivalent to (1.2) and (1.3) being well-defined. � We should mention that an NPMLE need not exist and if it exists it need not be unique. A modification called the method of sieves due to Grenander (1981) is sometimes useful. We choose submodels Pn ⊆ P such that ∪n Pn will almost surely eventually include the true P0 . Then we define a ‘sieved’ NPMLE Pˆns to be such that Z
dPˆns dPn ≥ log d(Pˆns + P )
Z
log
dP dPn d(Pˆns + P )
∀P ∈ Pn ,
(1.4)
while for every P ∈ Pn , the left hand side is greater than minus infinity.
12
Chapter 1. Introduction
The Pn should, if possible, be chosen in such a way that Pˆns exists and is easily computed. It is often useful to choose Pn in a way that is dependent on the data. For instance, we can take Pn = {P ∈ P : P ≪ Pn }. The resulting sieved NPMLE we should perhaps call data sieved NPMLE. However, we shall generally omit both modifiers ‘data’ and ‘sieved’.
1.4.2
Consistency of the (NP)MLE
In this section we argue that the ‘natural’ approach to proving consistency of an MLE leads to Hellinger consistency. This usually overshoots the mark. Hellinger consistency—being equivalent to consistency in total variation— is too strong for most purposes. In many situations, especially when the model P is infinite dimensional, it just does not hold. For instance, when the NPMLE Pˆn is discrete while P0 is absolutely continuous (with respect to Lebesgue measure) the Hellinger distance between Pˆn and P0 is never less than 1. One way to escape the rigidity of Hellinger consistency is to try to find a sequence Pn such that Pn tends to P0 in some reasonable sense (say weak convergence), while at the same time the Hellinger distance between Pn and Pˆn tends to zero. Such a comparative sequence has successfully been used by Murphy (1994), Wijers (1995b) and Gill (1994) and it will also be used several times in this thesis. Now we define two concepts of ‘distance’ between two probability measures. The first, Hellinger distance, is a true distance in the mathematical sense; the second, Kullback–Leibler information is not. Kullback–Leibler information and the Hellinger metric play an important role in proving consistency of maximum likelihood estimators as they fit in well with the MLE definition as we will see later on. Definition 1.2. The Hellinger distance H(P, Q) between two probability measures P and Q is defined to be the square root of �1/2 2 Z � �1/2 � dP dQ H 2(P, Q) = − dµ dµ dµ � � � � Z 1/2 1/2 dP dQ =2−2 dµ, dµ dµ for µ dominating both P and Q
13
1.4 Semi-parametrics
This definition does not depend on the choice of µ. It can be shown that the topologies induced by Hellinger metric and the—perhaps more familiar— total variation metric are the same. In fact, we have 1 2 H (P, Q) ≤ kP − QkT V ≤ H(P, Q), 2 where k.kT V denotes the total variation norm. The variational metric is √ always between 0 and 1 and the Hellinger metric is between 0 and 2. Definition 1.3. The Kullback–Leibler information of a probability measure P with respect to Q is defined to be Z dP K(P : Q) = log dP. (1.5) dQ
Conventionally, dP/dQ is only defined when Q dominates P and the Kulback–Leibler information is defined to be infinite when that is not the case. Since we defined dP/dQ even when Q does not dominate P , (1.5) completely specifies the Kullback–Leibler information. One can check that, also according to our definition (1.5), K(P : Q) = ∞ when Q does not dominate P . Note that K(P : Q) can well be infinite even when Q dominates P. Even though the Kullback–Leibler information is often used to quantify the difference between two measures, it is not a distance in the mathematical sense. However, as a simple consequence of Jensen’s inequality we do have that K(P : Q) ≥ 0 with equality if and only if P = Q. The following lemma relates Kullback–Leibler information to Hellinger distance. Lemma 1.2. For any two probability measures P and Q we have K(P : Q) ≥ H 2 (P, Q). Proof
For all x > 0 we have log x ≤ x − 1. Hence, Z dP K(P : Q) = log dP dQ � � Z dQ 1/2 = −2 log dP dP �1/2 � Z dQ dP ≥2 1− dP �1/2 � �1/2 Z � dP dQ dµ = 2−2 dµ dµ = H 2 (P, Q).
14
Chapter 1. Introduction
where µ is some measure dominating both P and Q.
�
We now turn to consistency. Suppose for now that
K(P0 : Pˆn ) =
Z
log
dP0 dP0 < ∞. dPˆn
We can then rewrite (1.3) as
0≥
Z
log
dP0 d(Pn − P0 ) → 0, dPˆn
dP0 dP ˆn n d P Z Z dP0 dP0 = log d(Pn − P0 ) + log dP ˆ ˆn 0 d P d P n Z dP0 d(Pn − P0 ) + K(P0 : Pˆn ), = log dPˆn log
so if Z
P0 -almost surely
(1.6)
then K(P0 : Pˆn ) → 0, which by the above lemma implies H(P0 : Pˆn ) → 0. In other words, (1.6) implies the almost sure Hellinger consistency of the NPMLE Pˆn . Condition (1.6) is an obvious consequence of a uniform law of large numbers over a class of functions. Such uniform LLN’s are the object of much study in modern empirical process theory. In ‘empirical process parlance’, (1.6) follows directly from saying that the random function log(dP0 /dPˆn ) is, for n large enough, in a so-called Glivenko–Cantelli class. The convergence of (1.6) establishes ‘Kullback–Leibler’ consistency, which by lemma 1.2 implies Hellinger consistency. We can also get at Hellinger consistency directly. The equality we will now prove is due to van de Geer (1993), though she considered only the case where P is dominated by a single sigma-finite measure. We make no assumptions on P here. Taking P = P0
15
1.4 Semi-parametrics in (1.2) and then using the fact that log x ≤ x − 1 (x > 0) have Z
dPˆn dPn dP0 !1/2 Z dPˆn = 2 log dPn dP0 !1/2 Z ˆ dPn ≤2 − 1 dPn dP0
0≤
log
=2
Z
=2
Z
dPˆn dP0
!1/2
d(Pn − P0 ) + 2
dPˆn dP0
!1/2
d(Pn − P0 ) − 2H 2(P0 : Pˆn ).
Z
ˆ dPn dP0
!1/2
− 1 dP0
Because H 2 (P0 ; Pˆn ) is always between 0 and 2 it is not a problem to add and delete it as we did in the one-but-last line above. Now if !1/2 Z dPˆn d(Pn − P0 ) → 0 (1.7) dP0 we can conclude that H(P0, Pˆn ) → 0, which is to say that Pˆn is Hellinger consistent. Again is suffices to verify a uniform law of large numbers. Van de Geer (1993) proceeds to use empirical process theory to investigate the rate of convergence of Pˆn to P0 (when indeed they converge). In case P is convex, she suggests comparing Pˆn not to P0 but to a convex combination of Pˆn and P0 , say Pn . The idea is that it may be easier to establish H(Pˆn , Pn) → 0 than H(Pˆn , P0 ) → 0 when the two are actually equivalent. The two methods we presented for proving consistency of the NPMLE yield Hellinger consistency, which—being equivalent to consistency in total variation norm—is a very strong form of consistency. It may be too much to ask for. It may also be more than we want as we are often only interested in weak consistency (i.e. consistency in the Prohorov metric). In many non– and semi-parametric models the NPMLE is discrete whereas the true P0 could be absolutely continuous. As the total variation distance between singular measures is 1, the Hellinger distance between Pˆn and P0 cannot be less than 1.
16
Chapter 1. Introduction
We propose the use of a sequence {Pn} which tends to P0 in some desired sense, say weakly, while H(Pˆn, Pn ) tends to zero. Such a sequence was successfully applied by Murphy (1994) in a case where Hellinger consistency indeed did not hold. We cast this idea in the form of a theorem. Suppose that d is a metric on P which weaker than (or equivalent to) Hellinger metric. Theorem 1.1. Let Pˆn denote the NPMLE based on independent observations X1 , X2 , . . . , Xn which are all distributed according to P0 ∈ P and let Pn denote the empirical measure. If there exists a sequence {Pn} ∈ P such that d(Pn, P0 ) → 0 (P0 -a.s.) while either Z dPn ˆ K(Pn : Pn ) < ∞ and log d(Pn − Pn) → 0, P0 -almost surely dPˆn or
Z
dPˆn dPn
!1/2
d(Pn − Pn) → 0,
P0 -almost surely
then d(Pˆn , P0 ) → 0 (P0 -almost surely) Proof Replacing P0 with Pn in the preceding discussion, we see that either condition on Pn allows us to conclude that H(Pˆn , Pn) → 0. This theorem’s claim now follows from the assumption that d(Pn, P0 ) → 0. �
1.4.3
Score equations
In the parametric case the ‘score function’, i.e. the derivative of the log likelihood, is a familiar object. Often the maximum likelihood estimator solves the score equations: sum of scores (is less than or) equals zero. This sometimes enables us to calculate the MLE and it also helps us to prove efficiency and asymptotic normality. As it turns out, the notion of a score can be extended very neatly to the infinite dimensional case. Hence we can also write down ‘non-parametric’ score equations. In the infinite dimensional case the score equations usually do not characterize the NPMLE. However, solutions of the score equations are often relatively easy to obtain, when the real NPMLE is much more elusive. Besides, we tend to prove favorable properties of maximum likelihood estimators by considering them as solutions of score equations. Why then not simply consider such solutions from the outset? We shall at times be sloppy and even call any solution of the score equations an NPMLE.
1.4 Semi-parametrics
17
Scores are defined through what are called ‘differentiable submodels’. Following van der Vaart (1998), we consider maps t 7→ Pt from a neighborhood of 0 in [0, ∞) to P such that there exists a measurable function g : X → R for which #2 Z " 1/2 pt − p1/2 1 1/2 − gp dµ → 0. (1.8) t 2 where pt and p are Radon–Nikodym derivatives of Pt and P with respect to a sigma-finite measure µ(P, Pt ), which dominates both Pt and P . We call t 7→ Pt a differentiable submodel through P . If the integrand d |t=0 log dPt which is just the familiar score converges pointwise then g = dt function. The collection of scores associated with all differential submodels is ˙ ). Lemma 25.14 called the tangent set of the model P at P and denoted P(P R in van der Vaart (1998) asserts that from (1.8) it follows that gdP = 0 R 2 ˙ and g dP < ∞. Hence, P(P ) can be identified (up to equivalence) with a subset of L02 (P ). Here a clear distinction can be made between semi- and nonparametric models: a nonparametric model has a tangent set equal to the whole of L02 (P ), while the tangent set of a semi-parametric model is a true subset of L02 (P ). Moreover, the tangent set of a semi-parametric model is not contained in a finite dimensional subspace of L02 (P ). In other words, it is infinite dimensional but not everything. Indeed, if the model consists of all probability measures ˙ ) = L0 (P ). (on a given measurable space) then P(P 2 Now consider the ‘score inequalities’ Z 1X ˙ Pˆn ) g(Xi ) ≤ 0 ∀g ∈ P( (1.9) gdPn = n i
An NPMLE as defined in the previous section is a solution of these inequalities. The converse does not hold. Still, we will call a solution of these equations an NPMLE. The most familiar NPMLE, the empirical measure, solves a the score ˙ Pˆn ) = L02 (Pˆn ). inequalities when the model P is non-parametric so that P( Taking scores g(x) = 1F (x) − Pˆn (F ), for all F ∈ F , we see that the empirical Pˆn = Pn indeed arises as a solution of (1.9). We now discuss how the methods of the previous section can be used to prove consistency of solutions of the score equations. To this end we must choose particular submodels. Let Pˆn be a solution of the score equations and consider a sequence {Pn} ∈ P such that Pn ≪ Pˆn . (1−t) Now suppose that log(dPn /dPˆn ) ∈ L2 (Pˆn) and that Pˆn Pnt ∈ P for t in an open neighborhood of 0 in [0, ∞). Then t 7→ Pˆn(1−t) Pnt is a differentiable
18
Chapter 1. Introduction
submodel with score log
dPn ˙ Pˆn ). ∈ P( dPˆn
Because Pˆn solves all the score equations it follows that Z dPn log dPn ≤ 0, dPˆn which coincides with (1.3). Now we can apply the reasoning of the previous section to try to prove that a particular Pˆn is consistent. (1−t) Unfortunately, it is not usually true that Pˆn Pnt ∈ P. However, it is often true that P contains the straight line (1 − t)P + tQ for all P and Q in P (i.e. P is convex). If (and only if) Pn ≪ Pˆn and dPn /dPˆn ∈ L2 (Pˆn ) then t 7→ (1 − t)Pˆn + tPn is a differentiable submodel with score dPn dPn − dPˆn ˙ Pˆn ) = − 1 ∈ P( dPˆn dPˆn and since Pˆn solves all score equations, it follows in particular that � Z � dPn − 1 dPn ≤ 0. dPˆn
(1.10)
We are assuming that dPn /dPˆn ∈ L2 (Pˆn ), so in other words Z dPn dPn < ∞. dPˆn Hence, we can rewrite (1.10) as � Z � dPn − 1 dPn 0≥ dPˆn � Z Z � dPn dPn = d(Pn − Pn ) + − 1 dPn . dPˆn dPˆn Now since x − 1 > log x for all x > 0 we have � Z � Z dPn dPn − 1 dPn > log dPn = K(Pˆn , Pn ) ≥ 0. ˆ ˆ dPn dPn Hence if Z
dPn d(Pn − Pn ) → 0 dPˆn
P0 − almost surely
(1.11)
19
1.4 Semi-parametrics R � dPn
�
− 1 dPn tends to zero, which implies that K(Pˆn , Pn) tends to zero which in turn implies that H(Pˆn, Pn) tends to zero. Thus we have a theorem which is very similar to Theorem 1.1. Let d be a metric on P which is weaker than (or equivalent to) Hellinger metric. then
dPˆn
Theorem 1.2. Let Pˆn denote a solution of the score equations (1.9) based on independent observations X1 , X2 , . . . , Xn which are all distributed according to P0 ∈ P and let Pn denote the empirical measure. Suppose also that P is convex. If there exists a sequence {Pn } ∈ P such that 1. d(Pn, P0 ) → 0 (P0 -a.s.) 2. The submodel t 7→ (1 − t)Pˆn + tPn is Hellinger differentiable at Pˆn 3. (1.11) holds then d(Pˆn, P0 ) → 0 (P0 -a.s.)
1.4.4
Missing data problems and the EM algorithm
In this section we study missing data models which are also known as information loss models or mixture models. The issue is that for some reason we do not (completely) observe the random variables whose common distribution Q0 ∈ Q is of interest. Let X be a generic random variable on some (measurable) space X with distribution Q0 ∈ Q and let C be another random variable whose conditional distribution given X is known to us. Let Y = Φ(X, C), where Φ is a known many-to-one mapping. Y takes values in a measurable space Y. Now suppose we observe independent Y1 , . . . , Yn which are distributed as Y and from these we want to estimate Q0 . We call the Xi the complete data and the Yi the incomplete or observed data. Estimation of Q0 ∈ Q (or functionals thereof) from the observations Yi is called a missing data problem. The setup we have described is so general that one could maintain that every estimation problem is a missing data problem. Still, it will prove a convenient way to think about all sorts of censoring mechanisms. We now give another way to describe the situation. Consider a Markov kernel K(dy; x). This means that K(dy; x) is a probability measure for every x ∈ X and K(A; x) is a measurable function of x when A ⊆ Y is a measurable set. Now for all Q ∈ Q define the ‘mixture’ P = KQ by Z P (dy) = KQ(dy) = K(dy; x)dQ(x). (1.12) X
20
Chapter 1. Introduction
Clearly P is a probability measure on the space Y. Q is called the ‘mixing distribution’. We suppose K is known and we observe an i.i.d. sample Y1 , . . . , Yn with common distribution P0 = KQ0 , where Q0 is known to lie in a class Q. The model for the distribution of a generic observation Y is of course P = KQ = {KQ : Q ∈ Q}. The objective, again, is to estimate Q0 . We have explained what we mean by a ‘missing data model’ and by ‘a mixture model’. In fact, these two descriptions are the same. A missing data model can be described as a mixture model by defining K(dy; x) to be the conditional distribution of Y = Φ(X, C) given X = x. Conversely, a mixture model can be described as a missing data model as follows. First, define a random variable C which, conditional on X = x, has distribution K(dy; x). Next, define a random variable Y = Φ(X, C) = C. We shall now give two useful properties of P = KQ which follow directly from properties of Q. Lemma 1.3. If Q is convex then so is P = KQ. Proof Take two arbitrary elements P, P ′ ∈ P. Then there exist Q, Q′ ∈ Q such that P = KQ and P ′ = KQ′ . Now for 0 ≤ t ≤ 1 Z Z ′ tP + (1 − t)P = t K(dy; x)dQ(x) + (1 − t) K(dy; x)dQ′ (x) Z = K(dy; x)d(tQ(x) + (1 − t)Q′ (x)) ∈ P because tQ + (1 − t)Q′ ∈ Q.
�
Even more importantly, Lemma 1.4. If t 7→ Qt is a differentiable submodel through Q ∈ Q with score function g , then t 7→ Pt = KQt is a differentiable submodel through P = KQ ∈ P with score EQ (g(X)|Y ). Proof For a proof refer to Bickel et al. (1993) proposition A.5.5 or Le Cam and Yang (1988) proposition 4. � We shall concern ourselves exclusively with completely nonparametric ˙ missing data / mixture problems, which means that Q(Q) = L02 (Q) for all Q ∈ Q. In other words, every square integrable function, which integrates to zero is a score function belonging to a differentiable submodel. The fact that scores are so plentiful is useful when we want to estimate Q0 by solving score equations. The nonparametric situation typically arises when we have
1.4 Semi-parametrics
21
no prior information about Q0 so that we must take our model Q to consist of all probability measures on X . In passing, we note that if Q consists of all probability measures on a given space, then Q is convex. By the first of the above lemmas, convexity of Q implies convexity of P = KQ. This will be very useful as this puts us in the realm of Theorem 1.2. The fact that we only observe Y and not X may cause a lack of identifiability. We may well have that KQ = KQ′ while Q 6= Q′ . This is unfortunate as it means that from the data we can not tell Q and Q′ apart. We can of course reduce Q in such a way that we do have identifiability, but then our missing data problem will most likely fail to be completely non-parametric. In the problems we study in this thesis we can construct a different missing data problem which is identifiable, but also completely non-parametric. It ˜ of probability measures on a different space X˜ features a different model Q ˜ Of course we make sure that K ˜Q ˜= and also a different Markov kernel K. KQ so that the model for the data is the same. For the remainder of this section we simply assume identifiability. ˆ n of Q0 is defined Turning to maximum likelihood estimation, the NPMLE Q to satisfy Z Z dP dKQ log dPn := log dP ≤ 0, ∀Q ∈ Q, ˆn n dPˆn dK Q where Pn is the empirical distribution of the observed data Y1 , . . . , Yn . Instead of trying to find the NPMLE, we might be already be content ˆ n of the score equations with a solution Q Z 1X ˙ Q ˆ n ). EQˆ n (g(X)|y)dPn(y) = E ˆ (g(Xi)|Yi ) = 0, ∀g ∈ Q( n i Qn (1.13) If we have a completely nonparametric missing data problem every funcˆ n (A) for any tion g in L02 (Pˆn ) is a score. Thus we can take g(x) = 1A (x) − Q measurable set A to obtain the so-called self consistency equations Z 1Xˆ ˆ Qn (Xi ∈ A|Yi). Qn (A) = EQˆ n (1A (X)|y)dPn(y)) = n (1.14) It is usually assumed that for all x the kernels K(dy; x) have densities with respect to a single sigma-finite measure. This may not hold, and in particular it does not hold in the problems that are considered in this thesis. Fortunately, to solve the score equations we only need to compute integrals ˆ n of X given Y . Hence, with respect to the conditional distribution under Q
22
Chapter 1. Introduction
ˆ n -almost all x. Thus supit suffices if the K(dy; x) are dominated for Q ˆ n -almost all pose that a sigma-finite measure µn dominates K(dy; x) for Q x. The measure µn is allowed to depend on the data Y1 , . . . , Yn. We denote K(dy; x)/dµn (y) = kn(y; x). Then the conditional distribution of X given ˆ n is Y = y under X ∼ Q ˆ n (x) kn (y; x)dQ ˆ n (x′ ) k (y; x′ )dQ x′ n
R
(1.15)
and the score equations (1.13) become X Z g(x)kn (Yi; x)dQ ˆ n (x) ˙ Q ˆ n ). = 0, ∀g ∈ Q( R ′ )dQ ˆ n (x′ ) k (Y ; x n i ′ i x
(1.16)
Again, if a missing data problem is completely nonparametric then we ˆ n (A) for any measurable set A and (1.14) becomes can take g(x) = 1A (x) − Q ˆ n (A) = 1/n Q
XZ i
A
R
x
ˆ n (x) kn(Yi ; x)dQ . ′ ˆ ′ ′ kn (Yi ; x )dQn (x )
(1.17)
These equations are the well known self-consistency equations. Solving them iteratively is an instance of the EM algorithm. When we start the iterations with an initial guess Q(0) n then all subsequent iterates will be dominated by it. Hence we can never do better than compute a ‘sieved’ NPMLE over the (0) model {Q ∈ Q : Q ≪ Qn }. There has been much discussion of the merits and flaws of the EM algorithm (Dempster et al. 1977). Vardi and Lee (1993) point out the wide applicability of EM, but—obviously—blind application of the algorithm to every problem one meets is unwise. However, √ it does seem to perform rather well in ‘nice’ cases, i.e., parametric– and n-nonparametric problems. EM is wholly unsuitable to determine the support of a distribution. The rate at which EM converges is painfully slow, and has even been described as ‘lethargic’. On the other hand, only infantile computer skills are required to implement it. A clever mathematician who is good with computers can generally do much better (cf. Meilijson, 1989).
1.5
Perfect Simulation
The distribution of a spatial process is often very complicated. Typically, if there is any spatial dependence we have a normalizing constant that is utterly intractable. To appreciate this fact, consider a Poisson point process
1.5 Perfect Simulation
23
of intensity λ > 0 on the unit square. Suppose we are interested in the conditional distribution of the process, given that no two points are closer than at distance r > 0. This is called the hard core model. The normalizing constant here is an integral over all finite configurations of points that are all further apart than r. Performing this integration analytically appears impossible. Stochastic integration would be feasible if we can efficiently obtain realizations of the hard core model. Rejection sampling, i.e. generating Poisson processes and discarding those that do not meet the requirement, may not be efficient depending on λ and r. Coupling-from-the-past (CFTP) (Propp and Wilson, 1996) is a clever method to obtain samples from complicated distributions which arise as the stationary distribution of a Markov chain—as quite often happens in spatial models. For instance, the hard core model arises as the stationary distribution of a so-called spatial birth and death process, where births that violate the condition are rejected. In chapter 4 we consider estimation of the intensity of the Boolean model of discs (also known as the ‘bombing model’). As it turns out we need to sample from a conditional Poisson point process. We have implemented a CFTP algorithm which is extremely quick. This Boolean discs problem is a missing data problem, and we can use a stochastic version of the EM algorithm (StEM) to estimate the intensity. This algorithm produces an ergodic Markov chain on the parameter space. The StEM estimator is a sample (or an average of samples) from the stationary distribution of this chain. We can again use CFTP to actually obtain such samples. This we call the perfect StEM algorithm. This section is based on van Zwet (2000). It is organized as follows. Below we first describe coupling-from-the-past, then the stochastic EM and finally the perfect stochastic EM algorithm.
1.5.1
Coupling From The Past
Consider an ergodic (i.e., irreducible and aperiodic) Markov chain Xt on a state space S and suppose we want to simulate its equilibrium distribution. Starting the chain from some arbitrary initial state and then running it for a very long, but finite time will generally not ensure that samples are from the stationary distribution. Recently, Propp and Wilson (1996) devised a method, called coupling from the past (CFTP), to produce perfect or exact samples. We closely follow Kendall and Th¨onnes (1998) to explain how it works. For now, let us assume that the state space S is finite. A Markov chain Xt on S can be described by means of i.i.d. ‘random transition maps’ Ht :
24
Chapter 1. Introduction
S → S. Such a random transition map Ht determines for each state i ∈ S that the chain X might be in at time t − 1 where the chain would jump to next. If pij are the transition probabilities of the Markov chain to move from state i to j, then the common distribution of the Ht should be such that P (Ht (i) = j) = pij . Then a realization of the Markov chain X is generated by fixing X(0) at some X0 and setting X(t) = Ht (X(t − 1)). Coupling from the past now works as follows. We select a time −T < 0 in the past and run chains starting from each state of S from time −T to time 0. The chains are coupled by using the same realizations of the transition maps for all the chains. Hence, it follows that if two chains started at different initial states coalesce, they will forever after stay together. Now we check if all chains have coalesced at time 0. If so, then the state at time zero must be a sample from the stationary distribution. This is understood as follows. Imagine that at some time long before −T we also started a chain from an initial state selected according to the stationary distribution. This chain will remain in equilibrium, so in particular its state at time zero is distributed according to the stationary distribution. However, we have arranged it so that all chains, no matter which state they were in at time −T , are at time zero in the same state. If not all chains have met, then we run chains from time −2T to time 0, making sure that we use the same realizations of H−T +1 , H−T +2 , . . . , H0 . If the paths still have not coalesced, we run chains from time −4T and so on. If the state space S has more than just a few elements it will not be feasible to run chains starting from all possible states. Let us now consider finite, countable or even uncountable S. Suppose that S admits a partial ordering �, and that there are a minimal and a maximal element, s and s such that s � s � s,
for all s ∈ S.
Also suppose that the chain is ‘monotone’ in that it respects the ordering. Ht (s) � Ht (s′ ),
for all s � s′ a.s.
Now we can imagine that we run coupled chains starting at all possible states, while in practice we only run chains from states s and s. Because all paths are ordered, it follows that if the latter two have met then all paths starting from intermediate states would have met as well. Of course it remains to verify in each application that the algorithm will almost surely terminate in finite time.
1.5 Perfect Simulation
1.5.2
25
Stochastic EM
The stochastic EM (StEM) algorithm (Celeux and Diebolt (1986), Wei and Tanner (1990)), which we describe here, is an iterative procedure to estimate a parameter in a missing data problem. It produces an ergodic Markov Chain on the parameter space. The equilibrium distribution of this chain has certain desirable properties (Nielsen (1997a and b). In the next section we will investigate if and when the ideas of the previous section can be applied to actually obtain a sample from this equilibrium distribution. Suppose that X is distributed according to a probability measure Pθ0 . Suppose we can observe only the result of a many-to-one mapping Y (C, X), where the conditional distribution of C given X is known. The goal is to estimate θ0 , where θ0 is assumed to be in some general set Θ, from observing Y = y. This is sometimes called a missing data problem (see section 1.4.4). Often the EM algorithm (Dempster, Laird and Rubin (1977)) provides a method to find the maximum likelihood estimator of θ0 . There are two drawbacks. The first is that it is not known how many iteration steps are needed to bring one close enough to convergence. The other is that sometimes the E-step, computation of the conditional expectation of the likelihood given the data, is impossible. In this latter case, the stochastic version of the EM algorithm (StEM) may be a viable alternative. For a review and large sample results see Nielsen (1997a and b). The algorithm works as follows. Suppose the complete data maximum likelihood estimator is readily computable: θˆM LE = M(X). 1. Fix a θ(0) in Θ; 2. Sample X(1) from Pθ(0) (.|Y = y); 3. Set θ(1) = M(X(1)). By iterating this procedure, we obtain a sequence θ(0), θ(1), θ(2), . . . . If step 2 is carried out using independent Unif(0,1) variables for each t, the sequence θ(t) is a time homogeneous Markov chain. Under certain conditions it is also ergodic. If so, the algorithm converges in that the θ(t) converge in ˆ which is distributed according to the distribution to a random variable, say θ, stationary distribution of the Markov chain. Then θˆ is the StEM estimate. In other words, a StEM estimate is a sample from the stationary distribution of the ‘StEM Markov chain’. It is not clear for how long we should run the StEM chain to allow it to reach equilibrium. This lack of a termination rule seems to be something StEM and EM have in common. However, we shall find that in some cases
26
Chapter 1. Introduction
we can apply coupling-from-the-past to obtain a sample that is guaranteed to come from the stationary distribution of the StEM chain.
1.5.3
Perfect Stochastic EM
In this section we combine the ideas from the previous two sections. We use the set-up and notation of the preceding section. Let us suppose that the parameter space Θ admits a partial ordering �. Fix a time −T < 0 in the past. Suppose that for t = 0, −1, −2, . . . we can construct independent collections of random variables {Xθ (t), θ ∈ Θ} such that 1. Xθ (t) ∼ Pθ (.|Y = y) 2. θ � θ′ ⇒ M(Xθ (t)) � M(Xθ′ (t)) almost surely. Recall that M(X) is the complete data maximum likelihood estimator of θ. To simulate a Markov chain θ−T (−T ), θ−T (−T + 1), . . . , θ−T (0) we define random transition maps Ht (θ(t − 1)) = M(Xθ(t−1) (t)),
t = −T + 1, −T + 2, . . . , 0.
Now suppose that there are ‘minimal’ and ‘maximal’ elements θ and θ L such that θ � θ � θ for all θ ∈ Θ. Consider two coupled paths θ−T (.) and U U L θ−T (.) starting at θ−T (−T ) = θ and θ−T (−T ) = θ. It now suffices to check if L U these paths have coalesced at time zero, i.e. if θ−T (0) = θ−T (0). If so, then L ˆ we have a perfect StEM estimate θ = θ−T (0). If not we have to go back further in time. We demonstrate the Perfect StEM algorithm in a simple example. We also apply it to a more involved problem in section 4.4.2. An Example Suppose X = (X1 , X2 , . . . , Xn ) is an i.i.d. sample from Pθ0 = Exp(θ0 ); the exponential distribution with intensity (reciprocal of the mean) θ0 . We wish to estimate the intensity θ0 . Suppose that θ0 is known to be bigger than some θ > 0, that is θ0 ∈ Θ = [θ, ∞)POf course the maximum likelihood estimator of θ0 is θˆM LE = M(X) = (n/ Xi ) ∨ θ. Suppose we only observe ˜i = Xi ∧ C X
∆i = 1{Xi >C} ,
˜i , ∆i ) for the observed for some fixed positive constant C. Write Yi = (X data.
27
1.5 Perfect Simulation
The maximum likelihood estimator of θ0 based on the observed data is known to be the ‘occurrence’ divided by the ‘exposure’. P n − ∆i P ˜ . Xi
So there is really no need to apply the StEM algorithm here. The purpose of this example is strictly illustrative. We now describe how the StEM algorithm works here. When multiplying vectors we mean coordinate wise multiplication (mapping two vectors to one vector). 1. Fix θ(0) > 0 2. Generate X(1) ∼ Pθ(0) (X|Y = y): ˜ + ∆E, X(1) = X 3. θ(1) = M(X(1)) =
where E = (E1 , . . . , En), Ei ∼ Exp(θ(0))
P Xn (1) ∨ θ. i
Repeating this procedure, we obtain an ergodic Markov chain θ(0), θ(1), . . . . Now we demonstrate how we can apply perfect sampling to this chain. Recall the usual ordering on Rn : x ≤ y if x1 ≤ y1 and x2 ≤ y2 . . . and ˜ Since, for xn ≤ yn . Note that if x ≥ y then M(x) ≤ M(y). Set θ = M(X). ˜ it follows that θ(t) = M(X(t)) will always be less than θ. all t, X(t) ≥ X Hence, we may reduce our parameter-space Θ to [θ, θ]. Of course θ and θ are minimal and maximal elements of Θ with the usual ordering. We now construct collections {Xθ (t), θ ∈ Θ} as required at the beginning of this section. For t = −T + 1, −T + 2, . . . 0 and i = 1, 2, . . . , n generate independent Eθ,i (t) ∼ Exp(θ) and Ei (t) ∼ Exp(θ − θ) and define
Eθ,i (t) = Eθ,i (t) ∧
θ−θ Ei (t). θ−θ
Then, evidently, Eθ,i (t) ∼ Exp(θ), and θ ≤ θ′ implies Eθ,i (t) ≥ Eθ′ ,i (t). For t = 0, −1, −2, . . . and all θ ∈ Θ we define ei + ∆i Eθ,i (t), Xθ,i (t) = X
Thus, for t = 0, −1, −2, . . . we have collections of random variables {Xθ (t), θ ∈ Θ} such that 1. Xθ (t) ∼ Pθ (.|Y = y)
28
Chapter 1. Introduction 2. (θ ≤ θ′ ⇒ M(Xθ (t)) ≤ M(Xθ′ (t))) a.s.
L L as required. We can now run a ‘lower’ chain θ−T (−T ) = θ, θ−T (−T + U U L U (0) 1), . . . , θ−T (0) and an ‘upper’ chain θ−T (−T ) = θ, θ−T (−T + 1), . . . , θ−T L U and check if θ−T (0) = θ−T (0). We do need to make sure that the algorithm will terminate in finite time. It is enough to check that for some fixed −T L U the event θ−T (0) = θ−T (0) has positive probability. Well, L U Pr(θ−1 (0) = θ−1 (0)) ≥ Pr(Xθ,i (0) = Xθ,i(0), ∀i)
≥ Pr(Exp(θ) ≤ Exp(θ − θ))n > 0.
This concludes the example. The difficulty in making the StEM algorithm perfect lies in the construction of collections of random variables satisfying points 1 and 2 at the beginning of this section. There probably is no general recipe to achieve this. Here we ask ourselves when such a construction is at all possible. It turns out that the concept of realizable monotonicity (Fill and Machida (1998)) is essentially what we need. Realizable monotonicity is very close to stochastic monotonicity, which is a more familiar concept and which is also easier to check. Suppose that the complete data are random elements in some space E, and that the complete data maximum likelihood estimator of a parameter θ ∈ Θ is given by a function M on E. We assume that the parameter space Θ admits a partial order �1 . Suppose that E admits a partial ordering �2 such that, for any x1 , x2 ∈ E x1 �2 x2 ⇒ M(x1 ) �1 M(x2 ). Then we need to be able to construct a collection {Xθ , θ ∈ Θ} such that 1. Xθ ∼ Pθ , 2. θ �1 θ′ ⇒ Xθ �2 Xθ′ , almost surely. We shall have a look at two notions of monotonicity for a collection {Pθ , θ ∈ Θ} of probability measures: realizable and stochastic monotonicity. Definition 1.4. The collection {Pθ , θ ∈ Θ} is called realizably monotone if there exists a collection of random variables {Xθ , θ ∈ Θ} such that 1. Xθ ∼ Pθ , 2. θ �1 θ′ ⇒ Xθ �2 Xθ′ , almost surely.
1.5 Perfect Simulation
29
A subset U of E is said to be an up-set in (E, �2 ) if y ∈ U whenever x ∈ U and x �2 y. If P1 and P2 are probability measures on E then P1 is stochastically smaller than P2 if P1 (U) ≤ P2 (U) for all up-sets U in (E, �2 ). we then write P1 �D 2 P2 . Definition 1.5. The collection {Pθ , θ ∈ Θ} is called stochastically monotone if θ �1 θ′ ⇒ Pθ �D 2 Pθ′ , a.s. Realizable monotonicity is clearly what we need, while stochastic monotonicity is usually easier to check. It is easily seen that realizable monotonicity implies stochastic monotonicity. That the converse is not always true is demonstrated by an example in Ross (1993). However, for various finite classes of (E, �2 ), Fill and Machida (1998) give conditions on finite index sets (Θ, �1 ) such that stochastic monotonicity does imply realizable monotonicity. For instance, realizable and stochastic monotonicity are equivalent when (E, �2 ) or (Θ, �1 ) is a finite linearly ordered set. Recall that a set is linearly ordered if each pair of elements is comparable. Fill and Machida (1998) coined the term ‘realizable monotonicity’ and noted its relevance for perfect sampling. Their results for finite sets are all the more useful because of the following unpublished result by Ross (1993). Theorem 1.3. Suppose that (Θ, �1 ) is a partially ordered set and (E, �2 ) is a complete separable metric space with closed partial order. Then {Pθ , θ ∈ Θ} is realizably monotone if and only if for every finite Ψ ⊆ Θ {Pθ , θ ∈ Ψ} is realizably monotone. Now if for some separable set with a closed partial order we can use the results of Fill and Machida (1998) to check realizable monotonicity for all its finite subsets then Ross’s theorem allows us to conclude realizable monotonicity for the entire infinite set.
30
Chapter 1. Introduction
Chapter 2 Laslett’s line segments 2.1
Introduction
Almost to decades ago a study was to be made into the hazards of nuclear fuel waste disposal in underground excavations in selected plutonic rock masses of the Canadian Shield. Experiments had to be done related to thermal heating and hydraulic conductivity along fractures in the rock. As part of this research the construction was planned of an underground research laboratory within the granitic rock of the Lac du Bonnet batholith in southeastern Manitoba. For more information we refer to Stone et al. (1984). Figure 1.1 in the introduction to this thesis shows part of a map from that report of roughly 160 by 160 meters of fractures in the rock at the Lac du Bonnet site. This particular data set enters the statistical literature with Chung (1989a and b). The statistical problem is to estimate from figure 1.1 the distribution of the lengths of the fractures. Estimation of the length distribution of line segments observed through a bounded window is sometimes called Laslett’s line segment problem after Laslett (1982a and b). We are not sure if the underground laboratory was ever built, but quite apart from the original motivation the estimation problem presents a very interesting statistical challenge. We encounter three main difficulties. First, we have to deal with censoring, since most of the fractures are only partly observed as the rock is only partly exposed due to vegetation, soil and water. Secondly, the sample of (partly) observed cracks is biased, because longer cracks stand a better chance of being observed than shorter ones. Thirdly, the area of exposed rock where we observe the cracks is not convex. This means that we might observe several fragments of a single crack. A single glance at Figure 1.1 will convince the reader that it would be very difficult to assess if two observed fragments belong to the same underlying fracture. 31
32
Chapter 2. Laslett’s line segments
The first two problems, censoring and length bias, have been studied rather extensively Laslett (1982a and b), van der Laan (1993), Gill (1994) and Wijers (1995). The third difficulty, non-convexity of the observation window, is treated here for the first time. Also, in the above contributions the assumption is made that the locations of the fractures are distributed according to a Poisson process. We will obtain our results under far more general ergodicity assumptions. A line segment process can be modeled as a marked point process, where the points indicate the locations of the segments and the marks their lengths and orientations. Assuming that the locations are scattered as a Poisson process greatly facilitates any statistical analysis because then, conditional on their number, the segments are independent. We will argue that an analysis under the Poisson assumption is still relevant when that assumption is not fulfilled. We feel that this is an important point and we do not want it to be snowed under by details. Therefore we give a general—albeit somewhat heuristic—discussion in the next section, which will then serve as a blueprint for the remainder of the chapter. The reader will search in vain for the actual estimate of the length distribution of the Canadian fractures. As this thesis is on its way to the printer, we have not yet implemented our estimator and extracted the necessary data from Figure 1.1.
2.1.1
Inference for ergodic point processes
Consider a point process (see section 1.3) Φ = {(Ti , Xi )} on R × X with intensity measure dΛλ,F (t, x) = λdtdF (x), where F is known to belong to some class F . We think of Φ as a marked point process on R with marks Xi in a mark space X . For instance, the Ti could be the locations of cars parked along a street and the Xi could be their make. For another example, the Xi could determine the length of a line segment starting at Ti . Evidently, this is a very general set up and in fact our restriction to Ti taking values in R is not at all necessary for our discussion. We are primarily interested in estimating the mark distribution F0 which is supposed to be in some collection F . The ‘nuisance’ parameter λ is also assumed to be unknown to us. We do not observe Φ entirely. Suppose that of points (Ti , Xi) outside a set W ⊆ R×X we observe nothing, while if (Ti , Xi ) ∈ W we only observe the result of some known function Yi = g(Ti , Xi ). The mapping g may depend
33
2.1 Introduction
on W . For instance, if the (Ti , Xi ) represent line segments [Ti , Ti + Xi ] then Yi = g(Ti , Xi ) could be |[Ti , Ti + Xi ] ∩ [0, 1]|, the length of the intersection with the unit interval. Then W = {(t, x) : [t, t + x] ∩ [0, 1] 6= ∅}. We now define a new ‘point process’ of observations Ψ = {Yi } = {g(Ti, Xi ) : (Ti , Xi ) ∈ W }. It is convenient to think of the Yi as a point process because the observed data will often be of similar structure as the incompletely observed model Φ. Now suppose that Φ is Poisson (cf. section 1.3 on Poisson point processes). Then the intensity λdtdF (x) completely determines the distribution of Φ. The distribution of Ψ is also determined and can be described as follows. Define, for all F ∈ F Z Z µF = dtdF (x), W
and assume it to be finite. The reader should mistake µF for the mean of F . Now, 1. let N be distributed as a Poisson random variable with mean λµF ; 2. conditional on N = n draw an i.i.d. sample (Ti , Xi) of size n from the ‘normalized intensity’ measure 1W (t, x)
1 dtdF (x); µF
(2.1)
3. compute Yi = g(Xi, Ti ); 4. identify samples Y1 , . . . , Yn that are equal up to ordering. It is easy to write down the likelihood for the pair (λ, F ) at the data (N, Y1 , . . . , YN ). N
Y e−λµF (λµF )N N! i=1
ZZ
(t,x)∈g −1 (Yi )∩W
1 dtdF (x)N!. µF
We find the profile likelihood for estimating F by first fixing F and replacing λ by its maximum likelihood estimator N/µF . We find −N
e
N
N
N ZZ Y i=1
(t,x)∈g −1 (Yi )∩W
1 dtdF (x). µF
34
Chapter 2. Laslett’s line segments
This profile likelihood can be interpreted as the likelihood of a missing data problem (see section 1.4.4.) To make this clear we re-parameterize the problem. Define for all x W (x) = {t ∈ R : (t, x) ∈ W }. Also define for all F ∈ F a transformation dVF (x) =
|W (x)| dF (x). µF
For later use we have the inverse transformation �−1 �Z 1 1 ′ dV (x ) dV (x). dFV (x) = ′ |W (x)| x′ |W (x )|
(2.2)
(2.3)
so that FVF = F . Define V = {VF , F ∈ F }. We can rewrite the distribution of (T, X) as 1W (t, x)
dt dV (x). |W (x)|
(2.4)
Our missing data problem takes the form 1. Sample X from V ∈ V 2. Given X = x sample T from the uniform distribution on W (x) 3. Set Y = g(T, X) In line with section 1.4.4 we can also describe the situation as follows. Defining a Markov kernel Z dt K(dy; x) = δg(t,x) (dy) , |W (x)| W (x) we have that KV (dy) =
Z
K(dy; x)dV (x)
is the distribution of Y = g(T, X). The model for the observations Yi is thus KV = {KV : V ∈ V}. Conditionally on N = n, the maximum likelihood estimator Vˆn satisfies Z dKV dPn ≥ 0 ∀V ∈ V. log dK Vˆn
35
2.1 Introduction
Suppose that F0 is the ‘true’ parameter. The MLE Vˆn is of course supposed to estimate V0 = VF0 (cf. (2.2)). We define Fˆn = FVˆn (cf. (2.3)) as the MLE of F0 . Now if the model V—and hence KV—is convex, we can attempt to use Theorem 1.2 to prove the convergence of K Vˆn to KV0 . To conclude convergence of Vˆn to V0 we of course need to have identifiability: If V 6= V ′ then KV 6= KV ′ . Ultimately, convergence of Vˆn to V0 hopefully implies that Fˆn = FVˆn tends to FVF0 = F0 . To use Theorem 1.2 we need a sequence Vn such that KVn tends to KV0 and prove Z dKVn d(Pn − KVn ) → 0. (2.5) dK Vˆn Such a proof, and indeed the choice of Vn, will rely on the fact that Pn converges to KV0 . But what if Φ is not Poisson? Then we can no longer condition on the number of observations and treat them as an i.i.d. sample. We cannot write down the likelihood and maximize it. Also, the above asymptotics involving the number of observations tending to infinity become meaningless. In spite of all this, we propose to use exactly the same estimator. Though no longer the maximum likelihood estimator, one still expects it to have nice properties. We explain. First, some notation. We can consider Ψ as a random set of points but also as a random measure. By Ψ(A) we mean the number ofRpoints of Ψ that fall in some measurable set A. In fact, we write Ψ(A) = A dΨ(y). Upon normalization, we obtain a random probability measure Ψ(dy) . Ψ(g −1 (W ))
Now we can define a ‘maximum likelihood estimator’ Vˆ as satisfying � Z � Ψ(y) dKV d ≥0 ∀V ∈ V, log Ψ(g −1 (W )) dK Vˆ and we define Fˆ = FVˆ . Of course, all this is just notation; the estimator we just defined coincides exactly with the maximum likelihood estimator we defined earlier for the case where Φ is Poisson. We will study the asymptotics of the present estimator as more and more of the underlying process Φ is revealed. Suppose we have a sequence W = W1 ⊆ W2 ⊆, . . . . Define Ψi = {gi (Ti , Xi ) : (Ti , Xi ) ∈ Wi }.
36
Chapter 2. Laslett’s line segments
Note that the gi may depend on Wi . Since we defined W = W1 we have Ψ = Ψ1 . Define Z Z µi,F = dtdF (x), Wi
and
Wi (x) = {t ∈ R : (t, x) ∈ Wi }.
Similarly to (2.2) and (2.3), define
dVi,F (x) =
|Wi (x)| dF (x) µi,F
(2.6)
and dFi,V (x) =
�Z
x′
�−1 1 1 ′ dV (x ) dV (x). ′ |Wi (x )| |Wi (x)|
(2.7)
Define Vi = {Vi,F , F ∈ F }.
Finally, define a Markov kernel
Ki (dy; x) =
Z
Wi (x)
δgi (t,x) (dy)
dt . |Wi(x)|
We now have a sequence of statistical experiments: observation of Ψi . The model for the distribution of the data under the Poisson assumption changes with each experiment as the mapping gi may depend on the ‘window’ Wi . Thus we have a sequence of models Ki Vi = {Ki V : V ∈ Vi } = {Ki Vi,F : F ∈ F }. We can define a sequence of estimators Vˆi by requiring � Z � dKi V Ψi (y) log ≥0 ∀V ∈ Vi . d Ψi (gi−1 (Wi )) dKi Vˆi We set Fˆi = Fi,Vˆi We would like to use the ideas behind theorem 1.2 to prove that the Fˆi tend to F0 . However, first we must try to use ergodic properties of Φ and the sequence Wi to show that for all F ∈ F there exist V∞,F and K∞ V∞,F such that Vi,F → V∞,F
and Ki Vi,F → K∞ V∞,F .
(2.8)
37
2.1 Introduction
These convergences are established for Laslett’s problem in section 2.5.3. There it is also made clear in which sense they hold. Next, we need a sequence Vi such that Ki Vi tends to K∞ V∞,F0 . Then we show that � � � Z � dKi Vi Ψi (y) d − Ki Vi → 0. (2.9) Ψi (g −1 (W )) dKi Vˆi From this we can conclude that Ki Vˆi converges to K∞ V∞,F0 . Identifiability will then imply that also Vˆi tends to V∞,F0 . This will (at least for Laslett’s problem) imply that Fˆi = Fi,Vˆi tends to F∞,V∞,F0 = F0 . For the convergence of (2.9), we will need that Ψi (dy) → K∞ V∞,F0 (dy). Ψi (g −1 (W )) For Laslett’s problem this is shown in section 2.5.3.
2.1.2
Laslett’s line segment problem
A line segment process is conveniently modeled by a marked point-process in the plane, where the points indicate the location of, say, the left endpoints and the marks indicate orientation and length. We consider a point process ~i , Xi, Θi )} on R2 ×R+ ×(−π/2, π/2). We could call R+ ×(−π/2, π/2) Φ = {(S ~i to be left endpoints of the line segments and the mark-space. Take the S let Xi and Θi be their lengths and orientations. Let us use square brackets, writing [s, x, ϑ], to denote a line segment in R2 , rather than a point in R2 × R+ × (−π/2, π/2). Suppose that Φ is stationary (with respect to shifts on R2 ). Also, suppose that each segment’s length and orientation are independent, in the sense that Φ has an intensity measure of the form λd~sdF (x)dK(ϑ), where λ > 0 and F and K are distribution functions on R+ and (−π/2, π/2), respectively. Let µ denote the mean of F , and suppose that it is finite. Note that by giving this intensity we have not completely described the distribution of Φ. Now we assume that K is known. Our goal is nonparametric estimation of the length distribution F . This means that F belongs to a model, say F , which consists of all probability distributions on the R+ . Lok (1994) considers just the opposite situation: she assumes F to be known, and estimates K. If both F and K are unknown we could alternate estimation of F as presented here and estimation of K as presented by Lok (1994). As a technical aside we point out the following. For reasons of mathematical convenience we decided to let the orientations range in (−π/2, π/2),
38
Chapter 2. Laslett’s line segments
excluding vertical line segments with orientation π/2. However, there is no loss of generality in doing so, because we can choose the orientation of the entire process so that K does not have a jump at π/2. We have defined a stationary line segment process and stated our aim to estimate the distribution of the lengths of the line segments. We now describe the data that are available to us. Let W ⊂ R2 be a random closed set and let B be the unit square; B = [0, 1] × [0, 1]. Suppose we can only observe the intersections of the line segments with W = W ∩ B. In the Canadian dataset, c.f. Figure 1.1, B corresponds to the 160 × 160 meters square area and W is the irregular black region through which we observe the fractures. After we come up with an estimator of F , shall study its asymptotic properties. In spatial statistics basically two types of asymptotics are usually considered (Cressie (1991) p. 100). The first is ‘infill’ asymptotics where the observation region is kept fixed, but within that region the number of observations increases. The other is ‘increasing-domain’ asymptotics, where the observation region is expanded. In fact, we shall define Bn = [0, n]×[0, n] and consider observation of the line segment process Φ through W ∩ Bn as n tends to infinity. When doing so, we shall have to impose some ergodicity assumptions on Φ and W.
2.1.3
Some history
We now present a brief overview of the work that has already been done by other authors. Much effort has been put into the one dimensional case where line segments are scattered according to a Poisson process on the real line and the segments are observed (without occlusion) through an interval. Laslett (1982 a) showed how the EM algorithm can be used to obtain the (sieved) nonparametric maximum likelihood estimator. Wijers (1995b) has shown it to be consistent. Gill (1994), van der Laan (1995) and Wijers (1995a) have (jointly) established its asymptotic normality and efficiency. Many of the methods that have been developed for the one-dimensional case carry over to the two dimensional case, as long as the observation window is convex. The trick is to subdivide the plane into parallel strips of infinitesimal width and doing so in every direction. Then through each strip we observe—as it were—a one-dimensional line segment process and then we integrate over all strips and all directions. We shall perform such calculations later on. At that time this approach will be made more precise. Two things should be noted about assuming Φ to be Poisson and W to be convex. First, the Poisson assumption allows us to condition on the number of observations, after which we have an i.i.d. sample and we can apply standard estimation techniques. Secondly, the fact that the observation window W is
2.2 A re-parameterization
39
convex ensures that we can not observe more than one fragment of a single underlying line segment.
2.1.4
Scope of our contribution
We study the two dimensional line segment process observed through a nonconvex window. This is prompted by the fact that the exposed rock surface of the Canadian data is obviously non-convex. If the observation window is non-convex we might observe several fragments of a single line segment. It may occur, as it does with the Canadian data, that it is near impossible to decide if two fragments belong to the same fracture. As a consequence the observed fragments may be dependent in a way unknown to us. In this situation it is of no use to assume that the segments are scattered as a Poisson process. Even if we could condition on the number of different segments that are observed, the fragments are not necessarily distributed as an i.i.d. sample. However, we propose that the statistician analyze the data “as if” the observed fragments are scattered according to a Poisson process. In this simpler situation we find the non-parametric maximum likelihood estimator of the length distribution of the fractures. We shall show consistency of the estimator without using the Poisson assumption. Under the Poisson assumption the estimator may well be efficient, though we have not tried to prove this. Without the Poisson assumption, it will certainly not be efficient because we effectively ignore dependencies among the data, thus throwing away information. However, we feel confident that this loss of information is minor.
2.2
A re-parameterization
Above we briefly explained how to extend the one-dimensional case to the two-dimensional case. We now demonstrate in detail how this works. The main step is to re-parameterize the location of each line segment relative to the unique line in the plane on which the segment lies. ~i , Xi , Θi )} on R2 × Recall that we are studying a point-process Φ = {(S ~i denote left R+ × (−π/2, π/2), with finite intensity λd~sdF (x)dK(ϑ). The S endpoints of line segments of length Xi and orientation Θi . It is straightforward to represent the locations of the left endpoints relative to rotated
40
Chapter 2. Laslett’s line segments
coordinate axes. Define two functions t1 (s1 , s2 , ϑ) = s1 cos(ϑ) + s2 sin(ϑ) t2 (s1 , s2 , ϑ) = −s1 sin(ϑ) + s2 cos(ϑ). For fixed ϑ this map represents (s1 , s2 ) ∈ R2 , with respect to the coordinate axes tilted counter-clockwise over an angle ϑ, cf. Figure 2.1. Now consider the
s2 t1
t2
θ s1
Figure 2.1: Re-parameterization of locations. map that assigns (t1 (s1 , s2 , ϑ), t2 (s1 , s2 , ϑ), x, ϑ) to (s1 , s2 , x, ϑ). The image of Φ under this mapping is a new point-process Φ′ = {(T~i , Xi , Θi )} on R2 × R+ × (−π/2, π/2) with intensity λd~tdF (x)dK(ϑ). This follows since Lebesgue measure is invariant under rotation. Write ℓ(d, ϑ) for the line with orientation ϑ at (signed) distance d from the origin. In our new parameterization, a line segment [~t, x, ϑ] lies exactly on the line ℓ(t2 , ϑ).
41
2.2 A re-parameterization
Denote W(d, ϑ) = W ∩ ℓ(d, ϑ). Let us assume that W(d, ϑ) is always the union of at most a countable number of intervals: W(d, ϑ) = ∪m W(d, ϑ, m). The situation is depicted in Figure 2.2.
l (d, θ)
d
θ
Figure 2.2: The line ℓ(d, ϑ) intersecting (part of) the random set W (grey) producing closed intervals W(d, ϑ, m) (bold). Since W is non-convex, the intersection of a line segment [~t, x, ϑ] with W might consist of several fragments. In other words, we may have a non-empty intersection of [~t, x, ϑ] with W(t2 , ϑ, m) for several values of m. Conversely, every fragment corresponds to a line segment [~t, x, ϑ] and a positive number m. Our use of the words ‘fragment’ and ‘segment’ will have always precisely this meaning. Consider countably many identical copies of Φ′ = {(T~i , Xi, Θi )}, one for each m. The result, Φ′′ = Φ′ × N is a stationary point-process on R2 × R+ ×
42
Chapter 2. Laslett’s line segments
(−π/2, π/2) × N with intensity λd~tdF (x)dK(ϑ)dC(m), where C denotes counting measure on N. This new point-process Φ′′ can represent any fragment that could possible arise from the line segments of Φ′ . A fragment [~t, x, ϑ, m] is the intersection of a line segment [~t, x, ϑ] with W(t2 , ϑ, m). Of course such an intersection may very well be empty. We must now deal with further edge effects because we observe the line segments only through the intersection of W with the unit square B = [0, 1]× [0, 1]. For all (d, ϑ, m) ∈ R × (−π/2, π/2) × N let W (d, ϑ, m) = W(d, ϑ, m) ∩ B Define D = {(~t, x, ϑ, m) ∈ R2 × R+ × (−π/2, π/2) × N : W (t2 , ϑ, m) 6= ∅}. Only points in D can correspond to fragments that could be observed through W. We define two functions on D, t : D → R and l : D → R+ , as follows. Let t(~t, x, ϑ, m) be the distance from the left endpoint of the line segment [~t, x, ϑ] to the left endpoint of W (t2 , ϑ, m), which we take negative if the first is to the left of the latter. Let l(~t, x, ϑ, m) be the (strictly positive) length of the interval W (t2 , ϑ, m). Now consider the map that assigns (t(~t, x, ϑ, m), x, l(~t, x, ϑ, m)) to each ‘potential fragment’ (~t, x, ϑ, m) ∈ D. The image under this map of Φ′′ ∩ D is a new point-process Ψ = {(Ti , Xi, Li )} on R × R+ × R+ . The points of Ψ can be interpreted as segments [Ti , Ti + Xi ] on the real line which can be observed through intervals [0, Li ]. These intersections [Ti , Ti + Xi ] ∩ [0, Li ] are the observed fragments. We have now accomplished what we set out to do; we are now in the onedimensional case. Wijers (1995) studied the case where the Li are constant almost surely and the Ti follow a homogeneous Poisson process. We shall be able to make much use of his methods. However, we wish to stress that the Poisson assumption certainly does not hold here because some of the [Ti , Ti + Xi ] are actually different representations of the same line segment! We now demonstrate that the intensity of Ψ is given by λdtdF (x)dν(l) where dν(l) =
Z Z X ϑ
t m
δl(t,ϑ,m) (dl)dtdK(ϑ).
43
2.2 A re-parameterization
Here δl(t,ϑ,m) (dl) is Dirac measure putting point mass at l(t, ϑ, m). We must show that dt1 dν(l) is the image measure of d~tdK(ϑ)dC(m) under the transformation, described above, that turned Φ′′ ∩ D into Ψ. First we point out that t(.) does not depend on x and that l(.) does not depend on either t1 or x. Abusing notation we write t(~t, x, ϑ, m) = t(~t, ϑ, m). l(~t, x, ϑ, m) = l(t2 , ϑ, m). Next, we notice that t(~t, x, ϑ, m) = t1 + t(0, t2 , x, ϑ, m). It now follows that Z Z X 1{a τ ) = |Wn| + κn τ x>τ l>τ t=τ −x Z Z Z l−τ dtdνn (l)dVn (x) + |Wn| + κn τ Zx>τ l>τ t=0 Z 1 dVn (x) = (l − τ )dνn (l) l>τ x>τ |Wn | + κn τ Z Z x−τ + dνn (l) dVn (x) l>τ x>τ |Wn | + κn τ Z Z = (l − τ )dνn (l)gn (τ ) + dνn (l)hn (τ ) l>τ
= an Gn + bn Hn
l>τ
61
2.5 Without the Poisson assumption where an bn
Z 1 (l − τ )dνn (l) = |Wn | + κn τ l>τ Z 1 = dνn (l) κn l>τ
The estimating equations of Vn are similar to what we found earlier, for x τ )) (2.36) dPn (y, 2) + H ˆ n (y) ˆ n + bn H ˆn n an G y=0 h where, cf. (2.16) and
ˆ n = 1 − Hˆn − Vˆn (τ − ) G
ˆ n / (|Wn | + κn τ )) and hˆn (τ ) = Hˆn /κ gˆn (τ ) = G
and, for x ∈ [0, τ ),
Z
1 dVˆn (y) + gˆn (τ ) [x,τ ) |Wn | + κn y Z y−x ˆ dVˆn (y) + hˆn (τ ) + (τ − x)gˆn (τ ). hn (x) = |W | + κ y n n [x,τ ) gˆn (x) =
2.5.3
ergodic lemmas
In this subsection we first work through a number of results establishing that various (properly normalized) functionals of W ∩ Bn converge as n tends to infinity. Then we consider convergence of functionals of Φ ∩ W ∩ Bn . We must assume: Assumption 2.1. (Φ, W) is jointly stationary ergodic.
62
Chapter 2. Laslett’s line segments
This assumption actually holds if and only if Φ is weakly mixing and W is ergodic or vice versa. Recall that weakly mixing implies ergodicity so that in particular we are assuming that W is ergodic. Observing the line segments of Φ through W ∩ Bn we have censoring at the boundaries of W and of Bn . Censoring at the boundaries of Bn is a negligible effect as n tends to infinity because the expected total number of fragments observed through W ∩ Bn is of order n2 , while the expected number of fragments hitting the boundary of Bn is only of order n. In a nutshell, this is what we make precise in this section. ~i , Xi , Θi)} to Recall our transformation Φ′ = {(T~i , Xi , Θi )} of Φ = {(S represent the location of the left endpoint of each line segment relative to the unique straight line on which it lies. Observing Φ ∩ W ∩ Bn , we see nonempty intersections [T~i , Xi , Θi , m] = [T~i , Xi , Θi] ∩ Wn (T2,i , Xi, Θi , m) ∩ Bn = [T~i , Xi , Θi ] ∩ Wn (T2,i , Xi , Θi , m) for all m. We named these non-empty intersections ‘fragments’. Now consider a modification. Suppose we observe all non-empty intersections [T~i , Xi , Θi , m]∗ = [T~i , Xi , Θi] ∩ W(T2,i , Xi , Θi , m), but only if the left endpoint of [T~i , Xi , Θi, m]∗ ∈ Bn . In other words, we observe all fragments with left endpoint in the interior of Bn , without censoring at the boundary of Bn . If we assume that these new fragments are a Poisson process, we can condition of their observed number and consider their lengths and censoring types as an independent sample. To describe their common distribution we need to introduce modifications νn∗ of the measures νn . Define � |W(t, ϑ, m)| if the left endpoint of W(t, ϑ, m) falls in Bn . ∗ l (t, ϑ, m) = 0 otherwise and dνn∗ (l)
=
Z Z X t
ϑ m
δln∗ (t,ϑ,m) (dl)dtdK(ϑ).
Conditionally on W, the distribution of the lengths and censoring types of the fragments without censoring at ∂Bn is the same as that of the original fragments, but with ν replaced by ν ∗ throughout. We shall now establish the convergence of various functions of νn . We shall make extensive use of an ergodic theorem for spatial processes due to Nguyen and Zessin (1979, corollary 4.20). A spatial process on a set S is a family {XG : G ∈ G} where G is the collection of all bounded Borel sets in S. The spatial process is said to be covariant if for any G ∈ G and s ∈ S XG+s (Ts ) = XG (.)
2.5 Without the Poisson assumption
63
It is said to be additive if XH∪G = XH + XG , if H, G ∈ G, and H ∩ G = ∅. We denote by K the collection of bounded and convex subsets of S and by B the unit square. We have the following theorem (Nguyen and Zessin (1979), Theorem 2.1. If a spatial process {XG : G ∈ G} is covariant and additive and if there exists a non-negative random variable Y ∈ L1 (P ) such that |XG| ≤ Y, a.s. for each G ∈ B ∩ K then the limit
1 XGn = E(XB |J ) n→∞ |Gn | lim
exists almost surely for each regular countable sequence Gn of sets in K. Here J denotes the invariant sigma-algebra. If {XG : G ∈ G} is ergodic, i.e. J is trivial, then the limit equals E(XB ). We wantRto establish convergence of Vn and the sub-distribution functions y Fn (y, δ) = 0 Pn (dy ′ , δ). To thisR end, we must Rfirst prove convergence— uponRnormalization—of |Wn | = l ldνn (l), n| + R κn = l dνn (l), an = 1/(|W ∗ ∗ κn τ ) l>τ (l − τ )dνn (l) and bn = (1/κn ) l>τ dνn (l). We define |Wn | , κn a∗n and Bn∗ similarly as integrals with respect to νn∗ . We can think of these as random quantities indexed by sets Bn . As such they are additive, covariant and ergodic. The sequence Bn is a regular, countable sequence of convex bounded sets, and |Bn| = n2 . By Theorem 2.1 we have |Wn |∗ /n2 → EW) |W1 |∗ , κ∗n /n2 → EW) κ∗1 , a∗n /n2 → EW) a∗1 and b∗n /n2 → EW) κ∗1 . It is not difficult to show that (|Wn |∗ − |Wn |)/n2 → 0, (κn − κ∗n )/n2 → 0, (an − a∗n )/n2 → 0 and (bn − b∗n )/n2 → 0. We can now show convergence of Vn and its relatives. Recall our definition of Vn , Z x |Wn | + yκn dF (y) Vn(x) = 0 |Wn | + µκn Proposition 2.1. As n tends to infinity Vn tends almost surely, uniformly to Z x EW |W1 |∗ + yEW κ∗1 V∞ (x) = dF (y). ∗ ∗ 0 EW |W1 | + µEW κ1 Proof We divide numerator and denominator by n2 and then use the convergence of |Wn |/n2 and κn /n2 to obtain pointwise convergence. Uniform convergence follows from the usual arguments as Vn and V∞ are distribution functions. �
64
Chapter 2. Laslett’s line segments
Of course gn , Gn , hn and Hn converge to limits g∞ , G∞ , h∞ and H∞ , which are defined in the obvious manner as integrals with respect to V∞ . In section 2.3, we derived the distribution P (dy, δ) of the length and censoring type of the fragments observed through W = W1 , under the assumption that they are independent. We noted that for R a certain Markov kernel K(dy, δ; x) we can write P (dy, δ) = KV (dy, δ) = x K(dy, δ; x)dV (x). For the fragments observed through Wn we find, for y ∈ [0, τ ), R (l − y)dνn(l) l≥y Pn (dy, 0) = dVn (y) |Wn | + κn y Pn (dy, 1) = 2νn([y, ∞))gn(y)dy Pn (dy, 2) = dνn (y)hn(y) Pn (y ≥ τ ) = an Gn + bn Hn . R Again, Pn can be written as x Kn (dy, δ; x)dVn(x), where R (l − x)dνn (l) δx (dy) Kn (dy, δ; x) = 10 (δ)1[0,τ ) (y) l≥x |Wn| + κn x � � 1(y,τ ) (x) 1{†} (x) + 11 (δ)1[0,τ ) (y)2νn([y, ∞)) dy + |Wn | + κn x |Wn | + κn τ � � 1(y,τ ) (x)(x − y) 1{†} (x)(τ − y) 1{‡} (x) dνn (y) + + + 12 (δ)1[0,τ ) (y) |Wn | + κn x |Wn| + κn τ κn + 13 (δ)δτ (dy)(an1{†} (x) + bn 1{‡} (x)). Let K∞ be defined by K∞ (dy, δ; x) = 10 (δ)1[0,τ )(y)
R
l≥x
(l − x)dν1∗ (l)
δx (dy) |W1 |∗ + κ∗1 x � � 1(y,τ ) (x) 1{†} (x) ∗ + 11 (δ)1[0,τ )(y)2ν1 ([y, ∞)) dy + |W1 |∗ + κ∗1 x |W1 |∗ + κ∗1 τ � � 1(y,τ ) (x)(x − y) 1{†} (x)(τ − y) 1{‡} (x) dν1∗ (y) + + + 12 (δ)1[0,τ )(y) ∗ ∗ ∗ ∗ ∗ |W1 | + κ1 x |W1 | + κ1 τ κ1 ∗ ∗ + 13 (δ)(a1 1{†} (x) + b1 1{‡} (x)).
Proposition 2.2. Kn Vn (dy, δ) tends to K∞ V∞ (dy, δ) almost surely as n tends to infinity, in the sense of uniform convergence of the associated (sub)distribution functions. Proof
The proof is similar to that of the previous proposition.
�
2.5 Without the Poisson assumption
65
So far in this section we have only considered functionals of the random set W as observed through increasing sets Bn . We now turn to the actual data, which are fragments arising from observation of Φ∩ W through the Bn . We introduce a sequence of point processes, representing the data observed through Bn . Recall that we defined Dn = {(~t, x, ϑ, m) : Wn (t2 , ϑ, m) 6= ∅}. Now define En = {(~t, x, ϑ, m) ∈ Dn : [~t, x, ϑ] ∩ Wn (t2 , ϑ, m) 6= ∅}. En is well defined for n = ∞, if we take B∞ = R2 and W∞ (t2 , ϑ, m) = W(t2 , ϑ, m). On the sets En we define three functions, pn , yn and δn . pn (~t, x, ϑ, m) =left-most endpoint of [~t, x, ϑ] ∩ Wn (t2 , ϑ, m) yn(~t, x, ϑ, m) = min(τ, |[~t, x, ϑ] ∩ Wn (t2 , ϑ, m)|
δn (~t, x, ϑ, m) =# endpoints of [~t, x, ϑ] outside of Wn (t2 , ϑ, m) or 3 when yn (~t, x, ϑ, m) = τ.
These definitions are also valid for n = ∞. Define, for n = 1, 2, . . . , ∞, point processes Πn by applying these functions to Φ′′ ∩ En. Thus, Πn are marked point processes on Bn with mark space M = (0, τ ] × {0, 1, 2, 3} representing the fragments observed through Bn . Π∞ is of special interest. It is a marked point process on R2 × M representing all fragments arising from intersecting Φ with W. At the beginning of the present section, we claimed that as n tends to infinity, the censoring at the boundary of Bn becomes negligible as compared to the censoring at the boundary of W. The next lemma makes this claim precise. Lemma 2.2. For any measurable set M ⊆ M, 1 EΦ (|Πn (Bn × M) − Π∞ (Bn × M)||W) → 0 n2 almost surely, as n tends to infinity Proof The difference between Πn (Bn × M) and Π∞ (Bn × M) is less than the number of fragments that cross the boundary of Bn . This, in turn, is less than the number of line segments that cross the boundary of Bn . The expected number of line segments that cross a fixed line segment of length
66
Chapter 2. Laslett’s line segments
n (such as one side of Bn ) is no more than nλµ, where µ is the (finite) mean of F . This is seen by noting that for a line segment of length x and orientation ϑ to cross a given object line segment, its left-endpoint must lie in a parallelogram with the object line segment for its base, and sides of length x. The area of such a parallelogram is always less than nx. Integrating this with respect to λd~tdF (x)dK(ϑ) we find our upper bound, nλµ. We conclude that the expected difference between Πn (Bn × M) and Π∞ (Bn × M) is less than 4nλµ and the stated result follows. � For a given measurable set M ⊆ M, we have Z EΦ (Πn (Bn × M)|W) Pn (dy, δ) = Pn (M) = . EΦ (Πn (Bn × M)|W) M We define Pn∗ (M) = and
EΦ (Π∞ (Bn × M)|W) EΦ (Π∞ (Bn × M)|W)
Πn (Bn × M) . Πn (Bn × M) We draw the reader’s attention to the fact that the subscript n refers to the fact that Φ ∩ W is observed through Bn and not to the number of observed fragments. The number of observed fragments, in fact, equals Πn (Bn × M). Everything is now in place for the final result of this section. Pn (M) =
Proposition 2.3. For every measurable set M ⊆ M, Pn (M) → P∞ (M), in probability, as n tends to infinity. Proof First, note that Π∞ (Bn × M) is an additive covariant function indexed by the sets Bn . Since we assume that Φ and W are jointly ergodic it follows by Theorem 2.1 that Π∞ (Bn × M) → EΠ∞ (Bn × M), almost surely. Hence, Π∞ (Bn × M) EΠ∞ (Bn × M) → . Π∞ (Bn × M) EΠ∞ (Bn × M) It immediately follows that Pn∗ (M) converges to the same limit. By Lemma 2.2, Pn∗ (M) and Pn (M) have the same limit. In Proposition 2.2 we found that Pn (M) converges to P∞ (M), so we may now conclude that Π∞ (Bn × M) → P∞ (M). Π∞ (Bn × M)
2.6 An estimator for the line segments
67
The reasoning of Lemma 2.2 allows us also to conclude that Πn (Bn × M) Π (B × M) ∞ n − Πn (Bn × M) Π∞ (Bn × M) → 0
�
in probability. Hence, our claim follows.
Of course the above convergence is uniform over sets M of the form [0, y]×{δ} (y < τ, δ = 0, 1, 2, 3), corresponding to ‘empirical sub-distribution functions’. Still, the convergence is weaker than when we were working under the Poisson assumption. The Glivenko–Cantelli theorem yields almost sure uniform convergence, and here we only have uniform convergence in probability. Fortunately, this is not much of a problem. We simply apply the Skorohod–Dudley–Wichura almost sure representation theorem as stated, for instance in Gill (1989). For us, this boils down to pretending that we do have almost sure convergence and going ahead and prove almost sure uniform convergence of our estimator. In the end, we must then weaken the result to uniform convergence in probability.
2.6
An estimator for the line segments
With Pn as defined in the previous section, we consider estimators dVˆn (x) = dPn (x, 0) Z x dVˆn (x) 1 + dPn (y, 1) |Wn | + κn x y=0 gˆn (y) Z x dVˆn (x) x−y + dPn (y, 2) (2.37) |Wn | + κn x y=0 hˆn (y) Z τ− ˆn bn H 1 ˆn = H ˆn P (Y > τ )) (2.38) dPn (y, 2) + H ˆ n (y) ˆ n + bn H ˆn n an G y=0 h where, cf. (2.16) ˆ n = 1 − Hˆn − Vˆn (τ − ). G
ˆ n and gˆn are defined as usual. These estimators are of course the functions h inspired by (2.35) and (2.36), but it should be noted that the Pn have a different meaning here. The subscript n here refers to observation through Wn = W ∩ Bn , while the subscript n in (2.35) and (2.36) referred to n observed fragments.
68
Chapter 2. Laslett’s line segments We estimate (F |0,τ ) , µ) by 1 µ ˆn = κn
and Fˆn (x) = R
1
R
1 dVˆn (y) [0,τ ) |Wn |+κn y
1
1 dVˆn (y) [0,τ ) |Wn |+κn y
+ gˆn (τ )
+ gˆn (τ ) Z
0
x
− |Wn |
!
1 dVˆn (y). |Wn | + κn y
We now prove the consistency of our estimator. Theorem 2.2. Suppose that W and Φ are jointly ergodic. Then kFˆn − F0 k[0,τ ) → 0 and |ˆ µn − µ0 | → 0 in probability Proof The proof will follow the outline we gave at the end of section 2.1.1. Also, we use elements of an earlier consistency proof we gave at the end of section 2.4. However, we no longer need the ‘working hypothesis’ of that section. There we had difficulty proving that the mle of g(τ ) is bounded away from zero. Since the function g is non-decreasing, it suffices to show that for ˆ n (τ ) stays away from zero if Gn (τ ) is positive. Because of n large enough G the extra censoring, this is not a problem anymore. Proposition 2.1 established that for all F ∈ F (and in particular for F0 ) Vn,F tends to V∞,F almost surely, uniformly on [0, τ ). Also, Proposition 2.2 yielded that Kn Vn,F tends to K∞ V∞,F almost surely, in the sense of uniform convergence over sets of the form [0, y] × {δ} (y < τ, δ = 0, 1, 2, 3), corresponding to ‘empirical sub-distribution functions’. To apply Theorem 1.2, we need to compare the sequence Kn Vˆn with another sequence Kn V˜n , say, which converges to K∞ V∞,VF0 = K∞ V∞,V0 . For V˜n we choose an appropriately scaled version of the ‘empirical average’ of uncensored fragments: Z x |Wn| + κn y R Pn(dy, 0), x ∈ [0, τ ). V˜n (x) = (l − y)dν(l) 0 l≥y
We define V˜n (τ − ) in the obvious way. An ergodic theorem can be used to show its convergence of V˜n (τ − ) to V∞,F0 (τ − ). Hence, we can take a sequence ˜ ∞,F0 . ˜ n (such that H ˜ n ≤ V˜n (τ − )) converging to V∞,F0 ({‡}) = H V˜n ({‡}) = H Much like we did in section 2.4, we can apply empirical process theory to
2.6 An estimator for the line segments
69
obtain almost sure uniform convergence of V˜n to V∞,F0 . Again using empirical process theory, we obtain almost sure convergence of Kn V˜n to K∞ V∞,F0 , uniformly over sets of the form [0, y] × {δ}. Proposition 2.3 tells us that Pn also converges to P∞ = K∞ V∞,F0 , uniformly over sets of the form [0, y] × {δ}. However, this convergence is ‘in probability’. For the remainder of this proof we assume that the convergence is ‘almost sure’. This will lead to almost sure consistency of our estimator, which we then modify to consistency in probability, as stated in the theorem. We may do so by the Skorohod–Dudley–Wichura ‘almost sure representation theorem’, which we discussed above. Using the fact that Kn V˜n(dy, 0) = Pn (dy, o) and applying Lemma 2.1, we can now conclude that ! Z dKn V˜n d(Pn − Kn V˜n ) → 0 dKn Vˆn almost surely. Theorem 1.2 now allows us to conclude that Kn Vˆn converges to K∞ V∞,F0 in the same sense as Kn V˜n does. Since we have made sure that our parameter is identifiable it follows that Vˆn converges to V∞,F0 , whence it follows that Fˆn = Fn,Vˆn converges to F∞,V∞,F0 = F0 . �
70
Chapter 2. Laslett’s line segments
Chapter 3 Chord Length Estimation 3.1
Introduction
Consider a random closed set W ⊂ R2 which we observe through a bounded ‘window’ B. Important characteristics of the probability distribution of a random set are the chord length distribution (CLD) and the—perhaps more familiar—linear contact distribution (LCD) (Stoyan et al. 1987 p. 178–188). These characteristics can give us some insight in the ‘architectural’ features of the random set, such as the shape, size and dispersion of its various connected parts. Also, the CLD and LCD can help us when we want to test for stationarity (translation invariance) or for isotropy (rotation invariance). The CLD and LCD are closely related as is established in formula (3.24) below. With this relation, estimates for the one can be transformed into estimates for the other. For instance, in Hansen et al. (1996) an estimator for the LCD is developed and it is noted that an estimator for the CLD can be obtained from it. Our primary interest is in estimation of the CLD and we shall argue that it is better to estimate the CLD and transform it into an estimate of the LCD than to do it the other way around. The ‘classical’ definition of a chord or an intercept (Weibel, 1979, p. 315) is a “line segment contained fully within an object and extending between two points on the object’s surface”. We can informally define the chord length distribution in the direction e as the distribution of the length of the longest line segment through the origin in the direction e which is fully contained within W, conditionally on the event that the origin lies in W. If W is stationary and rotation invariant then this distribution does not depend on the choice of the reference point (the origin) or on the direction e. Hence, if we should want to test whether W is isotropic, we could estimate the CLD in various directions and see if the 71
72
Chapter 3. Chord Length Estimation
estimates differ. Note that our definition introduces a length bias; the origin is more likely to fall in a ‘large’ part of W and hence the chord through the origin will have a tendency to be unusually long. If we should want, we could easily correct for this to obtain an ‘unweighted’ CLD (see formula (3.3)) below. For further discussion on chord lengths cf. Serra (1982, Chapter X), Matheron (1975, p. 53) and Stoyan et al. (1987, pp. 178–182). The CLD has been applied in biology to study certain features of tissue, especially to characterize lung airspace dimensions, see Rosenthal (1989), Lum et al. (1990) and Oldmixon et al. (1994). Estimation of the CLD can be used also for inferential purposes in the statistical analysis of random set models (Stoyan et al. 1987, Hansen et al. 1996). Estimation of certain characteristics of the chord length distribution can be done from stereological estimates of the surface to volume ratio and the volume fraction. Such stereological estimates are obtained by straightforward intersection and point counting methods (Stoyan et al. 1987 p. 180). These methods are simple, fast and easy to deal with, but they do have their limitations. Stereological mean value formulas can only be used to obtain certain low-dimensional characteristics of the CLD, whereas knowledge of the shape of the CLD may give important additional information about the structure of the random set under consideration. Estimation is, of course, influenced by edge effects as the random set W is only observed in a bounded observation window B. More specifically, when a certain point x is used as a reference point, the chord through x could extend beyond B. A given chord is called uncensored (u.c.) when both endpoints are in B; singly censored (s.c.) when one of its endpoints is outside B; and doubly censored (d.c.) when both endpoints are outside B. Estimation from spatial data in the presence of censoring is often dealt with by means of ‘minus sampling’ which is also known as the ‘border method’. In our situation this means that when we want to estimate the probability that the length of a chord is less than r, we restrict attention to those reference points which are further than r away from the boundary of B. The resulting estimator can be termed the ‘reduced sample estimator’ (Baddeley and Gill, 1997). The obvious disadvantage of minus sampling is that much information is discarded, especially for large values of r. Oldmixon et al. (1994) suggest to make two separate estimates; one based only on the uncensored chords and another one based only on the singly censored chords. These two estimates could then be combined by taking some convex combination of them. Olmixon et al. do not discuss to do so optimally. Also, they discard doubly censored chords. Estimation from censored observations belongs traditionally to the field of survival analysis, where it has—among other things—resulted in the de-
3.2 The chord length distribution
73
velopment and study of the famous Kaplan–Meier estimator. Laslett (1982a and b) first noted the similarity of censoring in survival studies and edge effects in spatial statistics. Subsequently, this analogy has been exploited by Wijers (1995), van der Laan (1996,1998), Hansen et al. (1996), Baddeley and Gill (1997) and by ourselves in the previous chapter of this thesis. In particular, in Hansen et al. (1996) a Kaplan–Meier type estimator was proposed for the linear contact distribution. The unique correspondence between the LCD and the CLD suggests a transformation of the estimator of the former to obtain an estimator of the latter. Unfortunately, doing so involves a numerically unstable differentiation, which is believed to cause loss of efficiency. We want to use semi-parametric methods and missing data theory but cannot do so directly. Much like we did in the previous section, we first consider an analogous problem. We derive an NPMLE for that problem and then show that the estimator can also be applied in the real problem. The estimator will not be the maximum likelihood estimator in the real problem. However, it does utilize all the available data—though not in the absolutely most efficient way. The organization of this chapter is as follows. First, we give a more precise definition of the chord length distribution and discuss why it is difficult to estimate it. Then we consider an analogous, but similar problem and derive the nonparametric maximum likelihood estimator. We proceed to show that this NPMLE is consistent for the original problem. We report a modest simulation experiment to try out our new estimator. Finally, we shall consider the linear contact distribution and study its relation to the chord length distribution.
3.2
The chord length distribution
Let W be a stationary random closed set in R2 and e a unit vector in R2 . The chord through a point of W in the direction e is the longest line segment through the given point with orientation e which is fully contained within W. We are interested in estimation of the distribution of the length of the chord through the origin, given that the origin belongs to W. Since W is stationary, the particular choice of reference point (in this case the origin) is irrelevant. The ‘chord length distribution’ (CLD) is an interesting feature of the distribution of W. The data on which we shall base our estimation will consist of n independent realizations of W which are all observed through a fixed compact set B. Let ξe (s, t) denote the chord in the direction e through the point (s, t) ∈
74
Chapter 3. Chord Length Estimation
W. The situation is clarified in figure 3.1. A formal definition of the chord
(s,t)
Figure 3.1: The chord ξ(1,0) (s, t). The shaded region is (part of) the random set W. length distribution is as follows. Let W = W ∩ B where B is some compact set of positive area. Define, for all positive x W (x) = {(s, t) ∈ W : |ξe (s, t)| ≤ x}
(3.1)
where |ξe (s, t)| denotes the length of the chord ξe (s, t). Now define the (length weighted) chord length distribution function as Le (x) =
E|W (x)| E|W |
(3.2)
where the expectation is with respect to the distribution of W and |.| denotes area. It is easily seen that this definition does not depend on the choice of B. For simplicity we fix e = (1, 0) and omit e from our notation. We call L the length weighted chord length distribution for a reason. Recall that L may be interpreted as the distribution of the length of the chord though the origin, given that the origin lies in W. Informally, the origin is more likely to fall in a big part of W than in a small part. Hence L is biased towards greater chord lengths. We can easily correct for this. The unweighted chord length distribution is Rx 1 dL(t) . (3.3) L0 (x) = R 0∞ t1 dL(t) 0 t
75
3.2 The chord length distribution
The subscript ‘0’ indicating ‘unweighted’ should not be confused with the subscript ‘e’ we used earlier. Of a chord ξ(s, t) through a point (s, t) ∈ W = W ∩ B we observe only ξ(s, t)∩B. Hence, from observation of W = W ∩B we can not in general infer W (x) as a chord through a given point in W ∩ B might well extend beyond B. However, we do observe the length of the intersection of each chord with B and we observe how many of each chord’s endpoints are outside of B. Define two functions y(s, t) = |ξ(s, t) ∩ B| δ(s, t) = # endpoints of ξ(s, t) outside of B.
(3.4) (3.5)
From observation of W we know, for all positive y and δ = 0, 1 or 2 A(y, δ) = {(s, t) ∈ W : y(s, t) ≤ y, δ(s, t) = δ}.
(3.6)
We define F (y, δ) =
E|A(y, δ)| , E|W |
(3.7)
where again the expectation is with respect to the distribution of W. For δ = 0, 1, 2, F (y, δ) are sub-distribution functions. We can interpret L and F in the following way which will be very useful in the next section. Lemma 3.1. Let (S, T ) be uniformly distributed on W . Then 1. L is the distribution of |ξ(S, T )|; 2. F is the distribution of (y(S, T ), δ(S, T )); 3. conditionally on ξ(S, T ), (S, T ) is uniformly distributed on ξ(S, T ). Proof The first two statements are immediate from the definitions of L and F . To prove the third, define, for all t, Wt = {s : (s, t) ∈ W }. Conditionally on ξ(S, T ), T is degenerate. Also, conditional on T , it is clear that S is uniformly distributed on WT . Now WT consists of one and possibly several line segments, ξ(S, T ) being one of these. Hence, conditionally on ξ(S, T ), (S, T ) is uniformly distributed on ξ(S, T ). � We now turn to the statistical problem of estimating L from independent observations. Let W1 , W2 , . . . , Wn be independent and identically distributed as W. For simplicity, let B = [0, τ ]×[0, 1] (τ > 0). Note that doubly censored chords (δ = 2) for which neither endpoint is in B, will always have length τ .
76
Chapter 3. Chord Length Estimation
Define Wi = Wi ∩ B and let ξ(i, s, t) be the chord through (s, t) in Wi . Like before, Wi (x) = {(s, t) ∈ Wi : |ξ(i, s, t)| ≤ x} y(i, s, t) = |ξ(i, s, t) ∩ B| δ(i, s, t) = # endpoints of ξ(i, s, t) outside of B. Ai (y, δ) = {(s, t) ∈ Wi : y(i, s, t) ≤ y, δ(i, s, t) = δ}
(3.8) (3.9) (3.10) (3.11)
We really need only one result about the observed chords: Lemma 3.2.
almost surely, uniformly.
P i |Ai (y, δ)| P → F (y, δ) i |Wi |
Proof Pointwise convergence follows from the strong law of large numbers. By the usual ‘Glivenko–Cantelli argument’, uniform convergence follows as usual from the fact that F is monotone and bounded. �
3.3
Digression: A related problem
We can think of chord length estimation as a missing data problem. The complete data consists of the Wi and {ξ(i, s, t) : (s, t) ∈ Wi , i = 1, . . . n}. The observed data are the Wi and {(y(i, s, t), δ(i, s, t)) : (s, t) ∈ Wi , i = 1, . . . n}. Application of the EM algorithm springs to mind, but we do not see how to how to find the conditional distribution of the complete data given the observed data, as required by that algorithm. In this section we consider a different missing data problem which is easier to handle as the observations will be numbers instead of functions on random sets. However, this easier problem will bear so much resemblance to chord length estimation that the analysis will be very useful. In fact, our findings in this section will guide us to an estimator which we can use in the chords problem. The reader should keep in mind that in this section there are no random sets Wi involved. However, we shall re-use many of the symbols of the first section to point out the similarities between the two problems. We hope this will clarify and not confuse. Let B = [0, τ ]×[0, 1] and let (S, T ) be a uniformly distributed point in B. Associate with (S, T ) a random variable X which is distributed according to L as defined in (3.2). Conditional on S and X, let R be a random variable which is uniformly distributed on the interval [Si − Xi , Si ]. Now let ξ be the line-segment from (R, T ) to (R + X, T ). Note that, given ξ, (S, T ) is
77
3.3 Digression: A related problem
uniformly distributed on ξ. Define Y = |ξ ∩ B| = |[R, R + X] ∩ [0, τ ]| and ∆ is the number of endpoints of ξ that fall outside of B which is the same as the number of endpoints of [R, R + X] that fall outside of [0, τ ]. We see that our specific choices of B = [0, τ ] × [0, 1] and e = (1, 0) have made T irrelevant; from (S, X, R) we can derive (Y, ∆) Lemma 3.3. The joint distribution of Y and ∆ is given by F as defined in (3.7). Proof This is an immediate consequence of Lemma 3.1.
�
The joint distribution of (S, X, R) is of course given by 1A (s, x, r)
ds dr L(dx) τ x
(3.12)
where A = {(s, x, r) : [r, r + x] ∩ [0, τ ] 6= ∅}. From our description of the model we can explicitly derive the distribution of the observed data (Y, ∆). We introduce very two useful quantities Z Z τ x−τ G= dL(x) and H = dL(x) (3.13) x [τ,∞) x [τ,∞) and note that L(τ − ) + G + H = 1
(3.14)
R τ− R where L(τ − ) := 0 dL(x) := (0,τ ) dL(x). We can write down the distribution of (Y, ∆) in terms of L restricted to [0, τ ), G and H. (Re)define functions y(s, x, r) = |[r, r + x] ∩ [0, τ ]| and δ(s, x, r) = the number of endpoints of [r, r + x] outside [0, τ ]. Now consider sets S(y, 0) = {(s, x, r) : y(s, x, r) = y, δ(s, x, r) = 0} = {(s, x, r) : x = y, 0 < r < τ − x} S(y, 1) = {(s, x, r) : y(s, x, r) = y, δ(s, x, r) = 1} = S(y, lc) ∪ S(y, rc) S(y, lc) = {(s, x, r) : x > y, s < y, r = y − x} S(y, rc) = {(s, x, r) : x > y, s > τ − y, r = τ − y} S(τ, 2) = {(s, x, r) : y(s, x, r) = τ, δ(s, x, r) = 2} = {(s, x, r) : x > τ, τ − x < r < 0}.
78
Chapter 3. Chord Length Estimation
Integrating the distribution of (S, X, R) given in (3.12) over these sets we find, for 0 ≤ y < τ , Z ds dr P (dy, 0) = dL(x) A∩S(y,0) τ x Z ∞Z τ Z s ds dr = 1y (x)1{0 0 on a compact set S arises as the stationary distribution of a spatial birth-anddeath process (Preston 1977). We start with any finite collection of points on S. Then each point is deleted after an exponential lifetime with rate 1. Also, after exponential waiting times with mean 1/λ new points are added which are uniformly distributed on S. The sequence of point configurations thus obtained converges weakly to a Poisson point process on S of intensity λ. Lantu´ejoul (1997) demonstrates that similarly we can obtain a Poisson process point process, conditioned on a certain event E of positive probability, as the limit of a birth and death process. Informally, if whenever a point is added or deleted according to the scheme described above, we make sure never to enforce a transition violating E, the stationary distribution of the resulting process is the conditional version of the Poisson process. In our case, S = D and E is the event that C is covered. Let X(t) be a birth and death process with birth rate λ and individual death rate 1. A birth is understood to be the addition of a uniform point on D. Let X(t− ) denote the configuration at time t− just before t. If a point zi is born at time t it is added: X(t) = X(t− ) ∪ {x}. If x ∈ X(t− ) dies at time t it is removed only if that does not cause part of C to become uncovered, that is if B(x, r) ∩ C ⊆ B(X(t− ) \ {x}) ∩ C.
(4.4)
If x cannot be removed, then it is granted an extra exponential lifetime after which its removal is reconsidered. Following the terminology in (Kendall and Th¨onnes, 1999) x is then called perpetuated. Following Lantu´ejoul (1997) it would not be difficult to show that the stationary distribution of X(t) is indeed πλ . However, X(t) is not the birth and death process we shall use to sample from πλ . We want to apply coupling from the past (section 1.5.1) to obtain perfect samples from πλ but X(t) does not appear amenable to this approach. The difficulty is that for perfect sampling from the stationary distribution of a Markov chain it is convenient if the state-space admits a partial order
4.3 Coupling from the past for the conditional Boolean model
93
and there exist maximal and minimal elements majorizing and minorizing all other elements with respect to this partial order. The state space of X(t) consists of all finite collections of points on D. The obvious (partial) ordering of this space is the inclusion ordering, but then there is certainly no maximal state, because D itself is infinite. We shall construct a different birth-and-death process on a state space consisting of all subsets of a finite (but random) set of points which also converges to πλ . We shall be able to apply coupling from the past to this process. It should be remarked that for the special case where E is the event that a certain finite collection of points is covered, a perfect sampling algorithm is available due to Kendall and Th¨onnes (1998). Unfortunately, their method does not seem to extend to our situation: coverage of a uncountable set. However, some of the ideas in (Kendall and Th¨onnes, 1998) play a role in our construction also. As noted previously, rejection sampling from (4.3) is possible for large intensity parameters. Using this observation, the first step in our algorithm to sample from a given πλ is to choose a κ > λ and to generate a sample, say D = {z1 , z2 , . . . , zn } ⊂ D, from πκ . D will serve as maximal state. All configurations obtained when running the birth-and-death processes will be subsets of this finite set D. Now D is thinned, independently retaining each point with probability λ/κ. The key result is the following. Proposition 4.1. Let D have distribution πκ and define E0 to be the independent thinning of D with retention probability λ/κ. Conditionally on coverage of C, E0 is distributed according to πλ (cf. (4.3)). Proof Note that the conditional distribution of E0 given coverage of C is concentrated almost surely on configurations of points of D. For any such configuration x, the Janossy density is given by jn (x) � �n(x) � � Z Z ∞ X λ n λ e−|D| = ... fκ (x ∪ {y1 , . . . , yn }) 1− dy1 . . . dyn n! κ κ n D n=0 � �n ∞ X λ e−|D| (1−κ)|D| n(x) = κ(1 − ) |D|n = ακ λn(x) e−λ|D| , ακ e λ n! κ n=0
where ακ−1 = Pκ (C is covered) is the probability that balls of radius r around the points of a Poisson process with intensity κ cover C. The claim follows upon normalization and comparison to (4.3). �
94
Chapter 4. The Bombing Model
We shall construct a coupling-from-the-past (CFTP) algorithm that selects a configuration Z between E0 and D (E0 ⊆ Z ⊆ D) such that Z is distributed according to πλ . First we construct a spatial birth-and-death process E = {E(t), t ≥ 0}, such that E(t) ⊆ D = {z1 , z2 , . . . , zn } for all t. We set E(0) = E0 . The dynamics of the process are such that each point is removed from E(·) after an exponentially distributed lifetime with mean 1. Whenever a point is removed, it is added again after an exponentially distributed waiting time of mean (κ − λ)/lambda. All life– and waiting times are independent of each other and everything else. Points zi ∈ E(0) are treated as if they were added at time 0, those zi ∈ / E(0) as removed at time 0. Lemma 4.2. Conditionally on D, the spatial birth-and-death process E(t), t ≥ 0, is irreducible, homogeneous, and positive recurrent. Moreover, E(t) is in equilibrium and time-reversible. In particular E(t) is distributed as E(0) = E0 for all t ≤ 0. Proof As E(·) is defined conditionally on D0 = {z1 , z2 , . . . , zn }, at any time there are only a finite number of points. Clearly, the transition rates do not change in time, hence E(·) is homogeneous. Moreover, any state x ⊆ D can be reached from any other state x′ (say) by successively deleting the points in x′ followed by addition of the points in x. Therefore, the birth-anddeath process is well-defined and possesses a stationary distribution (Parzen, 1962, Chapter 7). Moreover, since the state space is finite, not all stationary probabilities can be zero, hence they are all positive and the E(·) is positive recurrent. The process E(·) is in equilibrium and time reversible because it satisfies ‘detailed balance’ with respect to the distribution (given D) of E(0) = E0 λ P (E0 = x|D) = P (E0 = x ∪ {zi }|D), κ−λ
where zi 6∈ x ⊆ D.
�
We now define a spatial birth-and-death process Z(t), t ≥ 0, as a conditional version of E(·) in the spirit of Lantu´ejoul (1997). The equilibrium distribution of Z(·) will be πλ . Start with Z(0) being any subset of D0 . The dynamics of the process are such that a point zi might be removed from Z(·) after an exponentially distributed lifetime of mean 1. The point zi is actually removed only if B(zi , r) ∩ C ⊆ B(Z(t− ) \ {zi }) ∩ C.
(4.5)
4.3 Coupling from the past for the conditional Boolean model
95
If zi cannot be removed, then it is granted an extra exponential lifetime with mean 1 after which its removal is reconsidered. Whenever a point is removed, it is added again after an exponentially distributed waiting time of mean (κ − λ)/λ. All life– and waiting times are independent of each other and everything else. Points zi ∈ Z(0) are treated as if they were added at time 0, those zi ∈ / Z(0) as removed at time 0. Proposition 4.2. Conditionally on D, the spatial birth-and-death process Z(t), t ≥ 0, is homogeneous, and has a single positive recurrent class consisting of those subsets z of D for which B(z) covers C. It tends in distribution to πλ as t → ∞. Proof We work conditionally on D = {z1 , z2 , . . . , zn }. First note that almost surely B(Z(t)) will cover C for some t ≥ 0. The transition mechanism ensures that B(Z(s)) ⊇ C for all s ≥ t. Moreover, the class C of configurations z ⊆ D whose associated Boolean model covers C is irreducible, since any state z can be reached from any other state z′ by successively adding all points of D \ z′, then deleting those of D \ z. Thus Z(·) is well-defined, with a stationary distribution concentrated on C (Parzen, 1962). Again, since the state space is finite, not all stationary probabilities can be zero, hence they are all positive and the C is positive recurrent. Consider a move at time t of Z(·) from a configuration x∪zi ⊆ D to x, for which both B(x) and B(x ∪ zi ) cover C and zi 6∈ x. The birth rate of Z(·) is the same as the birth rate of E(·). The death rate for both perpetuated and non-perpetuated points is 1, as it is for E, provided the coverage condition is not violated. Thus, the detailed balance conditions for E(·) and Z(·) coincide on C, from which it follows that Z(t) tends to the distribution of E(0) restricted to C as t → ∞. Using lemma 4.1 the result follows. � We shall now describe how to apply coupling from the past to obtain a sample from the stationary distribution of Z(·). We already have a maximal state D. Fix a time −T < 0. By lemma 4.2, E(·) is time-reversible, hence can easily be extended backwards from E(0) until time −T . E(·) on the interval [−T, 0] will be the minimal state. It is straightforward to define a coupled process Z−T (t), −T ≤ t ≤ 0 which has the same dynamics as Z(·) while E(t) ⊆ Z(t) ⊆ D. First set Z−T (−T ) = E(−T ). Now with each zi ∈ D associate a unit rate Poisson process Ξi on the set {−T ≤ t ≤ 0 : zi ∈ / E(t)}. These Ξi will govern possible deaths of perpetuated points. At the (forward) birth in the process E(·) at time t of a point zi , add zi to Z(t− ) (if not already present). At the (forward)
96
Chapter 4. The Bombing Model
death in the process E(·) at time t of a point zi , remove zi from Z(t− ) but only if (cf. 4.5) B(zi , r) ∩ C ⊆ B(Z−T (t− ) \ {zi }) ∩ C.
(4.6)
If zi cannot be removed at time t, then its removal is reconsidered at the next event time after t of the process Ξi . Lemma 4.3. Z−T (0) tends in distribution to πλ as T → ∞. Proof Z−T (·) has the same dynamics and hence the same stochastic properties as the process Z(·) considered in the beginning of this section. Hence, this lemma follows directly from Proposition 4.2. � To check if Z−T (0) has reached equilibrium—so to say—we need processes L−T (·) and U−T (·) such that (cf. Kendall and Møller (1999) formulas (3.5) to (3.7)) 1. (‘sandwiching’) E(t) ⊆ L−T (t) ⊆ U−T (t) ⊆ D0 for all −T ≤ t ≤ 0; 2. (‘funneling’) L−T (t) ⊆ L−S (t) ⊆ U−S (t) ⊆ U−T (t), for all −S ≤ −T ≤ t ≤ 0; 3. (‘coalescing’) if, for some s, L−T (s) = U−T (s) then L−T (t) = U−T (t), for all t ≥ s. Moreover, we need that L−T (0) = U−T (0) almost surely for finite (preferably small) T . If the above inclusions hold and the latter event occurs then we can conclude that L−T (0) = U−T (0) is a perfect sample from πλ . This is roughly the content of Theorem 4.1 below. Now the construction of the processes L−T (·) and U−T (·) is very similar to that of Z−T (·). The only difference is that removal (if present) of a point zi at time t from L−T (t− ) is enforced only if B(zi , r) ∩ C ⊆ B(U−T (t− ) \ {zi }) ∩ C.
(4.7)
and the same removal from U−T (t− ) is enforced only if B(zi , r) ∩ C ⊆ B(L−T (t− ) \ {zi }) ∩ C.
(4.8)
The—at first perhaps mystifying—fact that these processes pay attention to each other is necessary to ensure the above inclusions. This ‘cross-over’ trick has also been applied by H¨aggstr¨om and Nelander (1998) and Kendall (1997). Summarizing, we propose the following algorithm.
4.3 Coupling from the past for the conditional Boolean model
97
Algorithm 4.1. Generate a random sample D from πκ for some κ > λ and delete each point independently with probability 1 − (λ/κ) to obtain E(0). Set T = 1 and write [ T2 ] for the integer part of T2 . • extend E(·) backwards on [−T, −[ T2 ]) with birth rate λ/(κ−λ) and death rate 1; • extend independent unit rate Poisson processes Ξi backwards on {−T ≤ t < [ T2 ] : Ei (t) = 0}; • set L−T (−T ) = E(−T ) and U−T (−T ) = D; • at a birth transition E(t+ ) = E(t) ∪ {zi }, add zi to L−T (t) and U−T (t). • at a death transition E(t+ ) = E(t) \ {zi } or an event time of Ξi – delete (if present) zi from L−T (t) provided that does not cause the Boolean model associated with U−T (t) to uncover part of C, i.e. zi may be deleted only if (4.8) holds; – delete (if present) zi from U−T (t) provided that does not cause the Boolean model associated with L−T (t) to uncover part of C, i.e. zi may be deleted only if (4.7) holds; • if L−T (0) = U−T (0) exit; otherwise double T and repeat. Algorithm 4.1 is designed in so that the inclusion relations 1, 2 and 3 hold. Lemma 4.4. The processes E(t), L−T (t), U−T (t) (t ≤ 0) and D satisfy the inclusion relations 1, 2 and 3. Proof By definition, E(−T ) − L−T (−T ) ⊆ U−T (−T ) = D, hence the sandwiching property holds for t = −T . Also D is a supset of all other sets. Since births in E(·) are reciprocated in L−T (·) and U−T (·), the inclusion relationship is preserved under birth transitions. Next, consider the death at some time t ∈ [−T, 0], say E(t+ ) = E(t) \ {zi } or an event time t of Ξi . Suppose that E(t) ⊆ L−T (t) ⊆ U−T (t). Since Ξi is restricted to the set {t ≤ 0 : Ei (t) = 0}, E(t+ ) is a subset of L−T (t+ ) and U−T (t+ ). Furthermore, if zi dies in the upper process, B(zi , r) ∩ C ⊆ B(L−T (t) \ {zi }) ∩ C ⊆ B(U−T (t) \ {zi }) ∩ C and consequently zi also dies in the lower process.
98
Chapter 4. The Bombing Model
Turning to the funneling property, we have to show that L−T (t) ⊆ L−S (t) and that U−S (t) ⊆ U−T (t). Now, by definition E(−S) = L−S (−S). Since the dynamics of algorithm 4.1 preserve inclusion, it follows that L−T (−T ) = E(−T ) ⊆ L−S (−T ) and, more generally, L−T (t) ⊆ L−S (t) for any t ≥ −T . Regarding the upper process, U−T (−T ) = D ⊇ U−S (−T ). Applying once more the fact that the algorithm preserves the inclusion ordering yields U−T (t) ⊇ U−S (t) for any t ≥ −T . Finally, suppose that the upper and lower processes meet at some time s ≤ 0. Then, as they are coupled by the same E– and Ξi -processes, they proceed as one. � We are now ready to state the main result of this section. Theorem 4.1. Algorithm 4.1 almost surely terminates in finite time; its output has density fλ (·) (cf. (4.3)) with respect to a unit rate Boolean model on D. Proof
Note that P (E(0) = D|D) =
� λ n(D) , κ
hence # "� � n(D) λ P (E(0) = D) = E κ
where n(D) is Poisson distributed with mean κ|D|. Consequently, the event {E(0) = D} has strictly positive probability. By lemma 4.1, E(−T ) = D will occur for some T almost surely. Hence, using Lemma 4.4, the algorithm terminates almost surely in finite time. As stated by Lemma 4.3 Z−T (0) tends in distribution to πλ as T → ∞. Moreover, using the fact that Algorithm 4.1 preserves the inclusions ordering, L−T (t) ⊆ Z−T (t) ⊆ U−T (t) for all −T ≤ t ≤ 0. Suppose T0 is a (random) time such that L−T0 (0) = U−T0 (0). It follows that Z−T (0) = L−T0 (0) = U−T0 (0) for all −T ≤ T0 . Hence, L−T0 (0) = U−T0 (0) is a sample from πλ . This completes the proof. � To conclude this section we present a modification of algorithm 4.1, which not only speeds it up but also facilitates and even makes possible some interesting estimation methods. These estimation methods will be discussed in the following section. First, we note that the algorithm typically takes a long time to terminate when the difference between the dominating pattern D and its thinning E0 is large. For example, suppose we want to sample from π1 while rejection
4.3 Coupling from the past for the conditional Boolean model
99
sampling only allows us to sample from π100 to obtain D. This is clearly a ‘hard’ problem. E0 would on average contain only one hundredth of the points of D so the algorithm has many configurations between D and E(0) to choose from—so to speak. The idea is to first use algorithm 4.1 to reduce D ∼ π100 to a sample, say X99 , from π99 . Then use algorithm 4.1 again with D = X99 to obtain a sample X98 from π98 . Repeating this, we obtain a nested sequence of samples X99 ⊇ X98 , · · · ⊇ X1 from π99 , π98 , . . . , π1 . This will be much faster than trying to sample from π1 straight away. In fact, for small steps of λ it might well happen that D and E0 coincide, in which case there is clearly no need to run the algorithm. Also, it might happen that there is no pattern X with E0 ⊆ X ⊂ D which meets the coverage requirement. Again, there would be no need to run the algorithm at because the output must be D itself. With an estimation method called ‘perfect stochastic EM’ (section 1.5.3) in mind, we now present an algorithm that produces a nested continuum of samples {Xλ ∼ πλ : λ ≤ λ ≤ λ} for any two values 0 < λ ≤ λ. By ‘nested’ we mean that Xλ ⊂ Xλ′ if λ ≤ λ′ . The idea is to slowly thin an initial sample form πλ , removing one point at a time. We suppose (without any loss of generality) that it is feasible to sample from πλ . Denote λ = λ(0). Let Xλ(0) = {x1 , . . . , xn } be a sample from πλ(0) . Now associate with each xi a standard uniform random variable Ui1 ; all the Ui1 being independent. Define Eλ1 = {xi ∈ Xλ(0) : Ui1 < λ/λ(0)}
λ ≤ λ(1)
Note that for each λ, Eλ1 is a thinning of Xλ(0) with retention probability λ/λ(0). Conceptually, we could—for every λ—run algorithm 4.1 with D = Xλ(0) and E0 = Eλ1 to obtain a sample from πλ . Define λ(1) = λ(0) maxi Ui1 . Then Eλ1 = Xλ(0) for all λ(1) < λ ≤ λ(0), 1 while Eλ(1) = Xλ(0) \ {xi } for some i. Now set Xλ = Xλ(0) λ(1) < λ ≤ λ(0). It is clear that these Xλ are distributed according to πλ ; application of algorithm 4.1 with D = Xλ(0) and E0 = Eλ1 must output Xλ(0) because D = E0 . 1 Next, run algorithm 4.1 with D = Xλ(0) and E0 = Eλ(1) = Xλ(0) \ {xi } to 1 obtain a sample Xλ(1) from πλ(1) . Note that when Eλ(1) does not cover, the algorithm must output Xλ(0) and hence need not be run. Now repeat the entire procedure, starting with Xλ(1) instead of Xλ(0) . We must associate new uniform random variables Ui2 with the points of Xλ(1) and
100
Chapter 4. The Bombing Model
define new thinnings Eλ2 = {xi ∈ Xλ(1) : Ui2 < λ/λ(1)}
λ ≤ λ(1)
Note that the distributions of Eλ1 and Eλ2 are the same for all λ ≤ λ(1). Hence we are indeed starting afresh. Repeating again and again in this manner, we obtain a sequence λ(0) > λ(1) > λ(2) . . . and after n repetitions we have a nested continuum of samples {Xλ ∼ πλ : λ(n) ≤ λ ≤ λ(0) = λ}. Define N to be the smallest number such that λ(N) < λ. It is not difficult to see that N is almost surely finite. Hence the above method provides, almost surely in finite time, nested samples from πλ for all λ between λ and λ.
4.4
Maximum likelihood
In general, direct maximum likelihood estimation of the intensity parameter in a Boolean model (Definition 4.1) seems very hard. In this section, we will describe two alternative techniques.
4.4.1
MCMC approach
Suppose a Boolean model B(X) of discs with radius r is observed though a non-empty compact set W . We write Y = B(X) ∩ W . The goal is to estimate the intensity parameter λ of the underlying Poisson germ process X. Although the likelihood of Y is known, it involves a normalizing constant which we cannot compute. A solution is to use the approach in (Geyer and Thompson, 1992, Geyer, 1998) and consider the likelihood ratio p(Y |λ) c(λ|Y ) = e(κ−λ)|W ⊕rB| p(Y |κ) c(κ|Y ) with respect�to a fixed parameter � κ > 0. Note that the normalizing constant c(λ|Y ) = E λn(X) 1{B(X)∩W =Y } where the expectation is taken with respect to a unit rate Poisson process. Note that "� � # n(X) c(λ|Y ) λ = Eκ B(X) = Y . c(κ|Y ) κ
Hence the log likelihood ratio can be rewritten as # "� � n(X) λ p(Y |λ) = (κ − λ)|W ⊕ rB| + log Eκ ℓ(λ) = log B(X) ∩ W = Y . p(Y |κ) κ
(4.9)
101
4.4 Maximum likelihood
The expectation can be estimated by an average over independent realizations of the conditional distribution of X given B(X) ∩ W = Y (under parameter κ) (see section 4.3). The approximation works well if the reference value κ is not too far from the true value. To try to make sure of this, we could use a pilot estimate as κ. Alternatively, we can take a sequence of different parameter values λ < λ1 0. Starting from any initial value λ(0), construct a sequence λ(0), λ(1), . . . by repeating the following. Expectation-step compute as the conditional expectation under λ(k) of the complete data log-likelihood, given the observed data Eλ(k) [log p(λ; X) | Y ] ;
(4.10)
Maximization-step find λ(k + 1) by maximizing (4.10) with respect to λ. In our set-up, Y = B(X) ∩ W and p(x; λ) is the Poisson(λ) density. The (complete data) log-likelihood is linear in the sufficient statistic n(X). Hence the expectation and maximization steps amount to computing the conditional expectation under λ(k) of the complete data maximum likelihood estimator given the observed data, that is � � � � n(X i ) + n(X b ) n(X) | Y = Eλ(k) |Y λ(k + 1) = Eλ(k) |W ⊕ rB| |W ⊕ rB| (4.11)
102
Chapter 4. The Bombing Model
We cannot compute (4.11), as required by the EM-algorithm. However, since we can sample from the conditional distribution of X given Y , we can use Monte Carlo methods to approximate it. Suppose that at the k-th iteration step we use m samples to do so. The average of these estimates Eλ(k) [n(X)/|W ⊕ rB| | Y ]. This estimate is the next parameter value, λ(k + 1). At the next iteration we need a new set of m independent samples under λ(k + 1). This algorithm is known as the Monte Carlo EM or, if m = 1, the stochastic EM-algorithm (StEM). We discussed this algorithm in section 1.5.2. We now specialize to StEM, i.e. the case m = 1. Usually, the algorithm is run for a great number of steps to allow it to approach equilibrium (burn-in). After that, the chain is continued for many more iterations and its steps are averaged to bring down the variance of the estimator. Since the discovery of CFTP, the arbitrary burn-in is unsatisfactory. Here we demonstrate how we can use CFTP to generate a StEM chain that is actually guaranteed to be in equilibrium. We need one mild assumption, namely that the true λ is known to be less than some finite λ. The complete data maximum likelihood estimator is slightly modified to become n(X)/|W ⊕ rB| ∧ λ. We might as well (and do) assume that λ is so big that we can easily sample from πλ . Of course λ will be our ‘maximal state’. As n(X i ) is obviously bounded below by |C|/(πr2), there is a very natural minimal state: λ=
|C|/(πr2) + n(X b ) . |W ⊕ rB|
Thus we may restrict the parameter space to [λ, λ]. Using the sampling scheme described at the end of section 4.3 we can obtain nested samples Xλ for all λ ∈ [λ, λ]. With such a collection of samples we can define a random transition maps (cf. section 1.5.1) H : [λ, λ] → [λ, λ] by n(Xλ ) + n(X b ) H(λ) = ∧ λ. |W ⊕ rB| Since the Xλ are nested, n(Xλ ) is (‘surely’) monotone increasing as a function of λ and hence so is H. Coupling-from-the-past works as follows here. Fix an integer −T < 0. For t = −T + 1, −T + 2, . . . , 0 generate independent copies Nt of N. Define an upper chain U−T = {U−T (t) : t = −T, . . . , 0} by setting U−T (t) = Ht (U−T (t − 1)) and U−T (−T ) = λ. Similarly, define a lower chain L−T by L−T (t) = Ht (L−T (t − 1)) and L−T (−T ) = λ. At time 0, check if U−T (0) = L−T (0). If so terminate; if not repeat, starting at time −2T and re-using the {Ht : t = −T + 1, . . . , 0}.
4.5 An example
103
Figure 4.1: (a) Realization of a Poisson point process of intensity 75 on the set [0, 1]2 ⊕ rB. There are 101 points. With each point a circle with radius 0.1 is associated. (b) The observed Boolean model Y = B(X) ∩ [0, 1]2
4.5
An example
In Figure 4.1 (a) we have a realization of a Boolean model of discs of radius .10 as observed through the set [0, 1]2 ⊕ (0.1)B (B is the unit disc). The intensity of the underlying germ process is 75. There were 101 points in the set [0, 1]2 ⊕ (0.1)B, of which 56 could be identified from observing the Boolean model through [0, 1]2 as depicted in Figure 4.1 (b). Figure 4.2 shows the region D where the interior points ‘live’ and the region C to be covered. We have applied the Monte Carlo likelihood ratio approach and the StEM algorithm to the data in Figure 4.1 (b). First, we estimated the log likelihood ratio (4.9) with respect to κ = 80 for λ ∈ [50, 100]. The estimate, shown in Figure 4.3, is based on 50 independent samples from π80 . To obtain such a sample we first generated a dominating pattern D. This was done by rejection sampling, where we gently increased the intensity until success. The first, rejection sampling attempts were done at intensity 80. After 50 failures, the intensity was increased by 10/|[0, 1]2 ⊕ (0.1)B|. Generally, success occurred at intensities around 110. From figure 4.3 the log likelihood ratio is readily maximized. We find 69 as an estimate of the true intensity (75). Of course the choice κ = 80 as reference value for the log likelihood ratio is quite arbitrary. Instead, we could have used some pilot estimate.
104
Chapter 4. The Bombing Model
-5
-4
-3
-2
-1
0
1
Figure 4.2: (a) The set D where the interior points ‘live’. (b) the set C which must be covered by the Boolean model associated with the interior points.
50
60
70
80
90
100
Figure 4.3: Estimated log likelihood ratio as a function of λ with respect to κ = 80.
105
40
60
lambda
80
100
4.5 An example
-4
-2
0
2
4
time
Figure 4.4: The upper and lower processes in the perfect stochastic EM algorithm, starting at times -1, -2 and -4. After the upper and lower processes have coalesced, the (then stationary) chain is continued.
A run of the perfect StEM algorithm is shown in figure 4.4. We see upper and lower processes U−1 (t) and L−1 (t) and U−2 (t) and L−2 (t) which have not met at time zero, and processes U−4 (t) and L−4 (t) which have. We have chosen to start the upper processes at λ = 100, pretending that we know for a fact that the true intensity is below 100. Note how quickly the algorithm has terminated. The value at time zero (after termination) is 61. We could now continue to run the StEM chain starting at 61 at time zero and average the result to bring down the variance. We should mention that it took us longer to generate Figure 4.4 than Figure 4.3. Although fewer samples were needed for the former, they were of lower intensity (40) than the samples required for the latter (80). An advantage of the likelihood ratio approach is that it allows us to do much more than just estimate the intensity. Indeed, it is easy to estimate the expectation and variance of any function φ of the complete data. We use importance sampling ideas (Geyer, 1994). To this end, 50 independent samples were generated from the conditional distribution of interior points with at intensities κi = 60.0 + 10i (i = 0, 1, 2, 3). Hence, in all, 200 independent
106
20
30
40
50
60
70
Chapter 4. The Bombing Model
50
60
70
80
90
100
Figure 4.5: The solid line denotes a Monte Carlo estimate of Eλ n(X i ) as a function of λ. The dashed lines show the (pointwise) estimated standard deviation. samples were generated. An estimate for Eλ φ given by P50 P50 λ n(Xi=1,j ) λ n(Xi,j ) φ(X )( ) i,j j=1 φ(Xi+1,j )( κi+1 ) j=1 κi + (1 − s) s P50 λ n(X ) P50 λ n(Xi=1,j ) i,j ( ) j=1 κi j=1 ( κi+1 ) if λ = sκi + (1 − s)κi+1 , 0 ≤ s < 1, and where Xi,j is πκi . In our case, the expectation of n(X i ) may be the Figure 4.5 we provide Monte Carlo estimates of the interior points under πλ , as a function of λ, together standard deviation envelopes.
4.6
the jth sample from
most interesting. In expected number of with the (pointwise)
Sampling from general point processes
In a recent paper Kendall and Møller (1999) presented two perfect sampling algorithms for so-called hereditary (or more precisely: locally stable) point processes. One based on spatial birth-and-death processes and the other a Metropolis–Hastings algorithm. In this section we show that our algorithm 4.1 will generally allow us to sample from what one might call anti-hereditary point processes. We show that the modification we applied to algorithm 4.1 can also be used in this more general setup. Finally, we show that there
107
4.6 Sampling from general point processes
exists a similar modification of the birth-and-death algorithm of Kendall and Møller. Following the notation and setup of Kendall and Møller (1999), let (S, B, λ) be a measure space. For us, λ will always be the uniform measure on S. Consider the ‘Carter–Prenter exponential space’ Ω of all finite collections of elements of S with its natural sigma-algebra F generated by sets {x ∈ Ω : n(x ∩ B) = n} (B ∈ B). In particular we can take S to be a compact set in R2 and let dλ = λds, where ds is Lebesgue measure on S. Let Poλ denote the probability measure on (Ω, F ) corresponding to a Poisson process of intensity λ on S. The Poisson process of intensity λ is of course absolutely continuous with respect to the Poisson process of intensity 1. The density is pλ : Ω → [0, ∞) given by pλ (x) = e(1−S)|S| λn(x)
(4.12)
Consider a point process X on S, whose distribution πλ on (Ω, F ) is absolutely continuous with respect to Poλ with density f : Ω → [0, ∞) dπλ = f dPoλ
(4.13)
In the previous sections we considered the special case S = D and
Defining
f (x) = R
1{x 1{x
covers C} (x)
covers C} (x)dPoλ (x)
.
fλ (x) = f (x)e(1−λ)|S| λn(x)
(4.14)
we have dπλ = fλ dPo1 . Now consider the problem of obtaining a sample from πλ . If f is bounded by, say, M we can apply rejection sampling. First we take a sample X ∼ Poλ and a uniform random variable U on [0, M]. We ‘accept’ X as a sample from πλ if U ≤ f (X) and otherwise we repeat the procedure. Unfortunately, it often happens that the acceptance probability is so small that this sampling method would take forever. We shall now investigate various other approaches. We consider two cases: hereditary There is a constant K > 0 such that f (x ∪ {ξ}) ≤ Kf (x),
∀x ∈ Ω, ξ ∈ S (ξ ∈ / x)
(4.15)
108
Chapter 4. The Bombing Model
To be precise, the hereditary property usually (Kendall and Møller 1999, Geyer 1999) means: if x ⊆ y then f (x) > 0 implies f (y) > 0. Condition (4.15) is really a ‘local stability condition’ which implies the hereditary property. The ratio f (x ∪ {ξ})/f (x) is sometimes called the ‘Papangelou conditional intensity’ and is denoted ℓ∗ (x; ξ). Perfect sampling for locally stable point processes was considered by Kendall and Møller (1999). anti-hereditary There is a constant K > 0 such that f (x) ≤ Kf (x ∪ {ξ}),
∀x ∈ Ω, ξ ∈ S (ξ ∈ / x)
(4.16)
Straightforward rejection sampling is feasible in the hereditary case when λ is small. In fact, it works trivially for λ = 0 when we would (almost) always obtain the empty configuration. In the anti-hereditary case rejection sampling typically is feasible when λ is large. Therefore we shall assume throughout that we can easily obtain a sample from πκ when we choose κ large enough.
4.6.1
spatial birth-and-death processes
We now discuss so-called spatial birth-and-death (b&d) processes as they were introduced by Preston (1975). We closely follow a brief review in Kendall and Møller (1999). A spatial birth-and-death process Xt (t ≥ 0) is a random process taking its values in Ω, the collection of finite sets of points of S. The process is Markov and (hardly surprising) it has two kinds of transitions: births (addition of a point) and deaths (deletion of a point). Now suppose X(·) has ‘birth rate’ b and death ‘rate’Rd. These are non-negative functions on Ω×S, while b must satisfy B(x) = b(x, ξ)dλ(ξ) < ∞. The birth rate b(x, ξ) determines the rate at which X(·) jumps from a state x to x ∪ {ξ} and the death rate d(x, ξ) determines the rate at which it jumps from x ∪ {ξ} to x. More precisely, the dynamics of X(·) are as follows. Suppose that Xt = x = {x1 , . . . , xn }. Let E0 , E1 , . . . , En denote independent exponential random variables with respective means 1/B(x), 1/d(x \ {x1 }, x1 ), . . . , 1/d(x \ {xn }, xn). The first transition after time t happens at time t + E, where E is the minimum of E0 , . . . , En . If E = E0 then the transition is a birth and a point ξ is added. The point ξ is selected according to the density b(x, ξ)/B(x). If E = Ei , i 6= 0, the transition is a death and the point xi is removed. The following important lemma is from Preston (1975)
4.6 Sampling from general point processes
109
Lemma 4.5. If there exists a density g : Ω → [0, ∞) satisfying the so-called detailed balance equations g(x)b(x, ξ) = g(x ∪ {ξ})d(x, ξ) > 0, whenever g(x ∪ {ξ}) > 0,
(4.17)
then Xt is time reversible and it has g as density of its unique stationary distribution. Suppose that we have—as we do—a density f and wish to construct a b&d process with f as its equilibrium, then we can take b(x, ξ) = f (x ∪ {ξ})/f (x) and d(x, ξ) = 1 or alternatively b(x, ξ) = 1 and d(x, ξ) = f (x)/f (x ∪ {ξ}). Of course these birth and death rates should be well-defined, and in this light conditions (4.15) and (4.16) above are not surprising.
4.6.2
the anti-hereditary case
Suppose we have a sample from an anti-hereditary point process with distribution πκ . In this section we show how to obtain a sample from πλ for any λ ≤ κ by means of thinning. This section generalizes our earlier work on sampling from the bombing model under a covering condition. The following lemma is a generalization of Proposition 4.1. Lemma 4.6. Suppose condition (4.16) holds. Let κ > λ > 0. Suppose Y is a sample from πκ and let Y ′ be an independent thinning of Y with retention probability λ/κ. Then Z
y
f (x) P (Y ′ = x|Y = x ∪ y)πκ (x ∪ dy) = e−|S| fλ (x) f (x ∪ y)
(4.18)
Proof By condition (4.16) we have that f (x)/f (x ∪ y) is bounded. Now it follows from (4.14) that fκ (x ∪ y) = f (x ∪ y)e(1−κ)|S| κn(x)+n(y) and f (x) = fλ (x)e(λ−1)|S| λ−n(x) .
110
Chapter 4. The Bombing Model
Hence Z f (x) P (Y ′ = x|Y = x ∪ y)πκ (x ∪ dy) f (x ∪ y) y � �n(x) � � Z Z ∞ X f (x) λ n λ e−|S| ··· 1− = n! κ κ n f (x ∪ {y1 , . . . , yn }) S n=0
× fκ (x ∪ {y1 , . . . , yn })dy1 . . . dyn �n � �n(x) � Z Z ∞ X fλ (x) λ λ e−|S| (λ−1)|S| −n(x) ··· 1− e λ = n! κ κ S n f (x ∪ {y1 , . . . , yn }) n=0 × f (x ∪ {y1, . . . , yn })e(1−κ)|S| κn(x)+n dy1 . . . dyn � �n ∞ X 1 n λ −|S| (λ−κ)|S| = fλ (x)e e κ 1− |S|n n! κ n=0 = fλ (x)e−|S|
� Suppose we have a sample D = y = {y1 , . . . , yn } from πκ and require a sample from πλ for some λ < κ. Consider a spatial b&d process, X(t), t ≥ 0, on the powerset of y (denoted P(y)) with birthrate b(x, ξ) = 1{ξ∈y\x} λ/(κ−λ) and death rate d(x, ξ) = f (x)/f (x ∪ {ξ}). Let D′ denote an independent thinning of D with retention probability λ/κ. We have the following identity, for all x ⊂ x ∪ {ξ} ⊆ y λ f (x) f (x) f (x ∪ {ξ}) P (D′ = x|D = y) = P (D′ = x∪{ξ}|D = y), κ − λ f (y) f (x ∪ {ξ}) f (y) In other words, X(t) satisfies detailed balance with respect to f (x) P (D′ = x|D = y) f (y) which is therefore the stationary distribution of X(t), conditionally on D = y. Since D is distributed according to πκ it follows from lemma 4.6 that unconditionally the stationary distribution of X(t) is πλ . Now consider another spatial birth and death process, E(t), t ≥ 0, on P(y) with birth rate b(x, ξ) = 1{ξ∈y\x} λ/(κ − λ) and death rate K. Let E0 be an independent thinning of D with retention probability λ/(K(κ − λ)) . 1 + λ/(K(κ − λ))
4.6 Sampling from general point processes
111
This time we have, for all x ⊂ x ∪ {ξ} ⊆ y
λ P (E0 = x|D = y) = KP (E0 = x ∪ {ξ}|D = y), κ−λ
We see that E(t) satisfies detailed balance with respect to the conditional distribution of E0 given D. It follows that E(t) is time-reversible and in equilibrium if we set E(0) = E0 . X(t) and E(t) have identical birth rates while by (4.16) the death rate of E(t) is greater than that of X(t). Setting X(0) = E(0) it is possible to generate coupled realizations of X(t) and E(t) such that E(t) ⊆ X(t) for all t. This works as follows. Suppose X(t) = x and E(t) = e, e ⊆ x ⊆ y. Then associate with every point of xi ∈ x an exponential lifetime Li with mean 1/K and a uniform random variable Ui on [0, K]. Associate with all points yi ∈ y \ e an exponential waiting time Wi with mean (κ − λ)/λ. The first transition after time t takes place at time t + m where m = min(L1 , . . . , Ln(x) , W1 , . . . , Wn(y)−n(e) ). If m = Li then the point xi is removed (if present) from the E process and xi is removed from the X process, but only if Ui ≤ f (x \ {xi })/f (x). If m = Wi the point ei is added to the E process and (if not already present) to the X process. We now explain how we can apply coupling-from-the-past (CFTP) to obtain a perfect sample from the πλ , the stationary distribution of X(t). Fix a time −T < 0 in the past. Since the E process is time reversible, we can extend it from E(0) = E0 into the past until time −T . Now define a process X−T on [−T, 0] starting at X−T (−T ) = E(−T ). We can arrange it so that X−T is a birth and death process with the same dynamics as X, while E(t) ⊆ X−T (t) ⊆ D for all t ∈ [−T, 0]. Because X−T has the same dynamics as X, it follows that X−T (0) tends in distribution to πλ as T → ∞. To check if X−T (0) has reached equilibrium—so to say—we need a ‘lower bound process’ L−T (·) with L−T (−T ) = E(−T ) and an ‘upper bound process’ U−T (·) with U−T (−T ) = D such that (cf. Kendall and Møller (1999) formulas (3.5) to (3.7)) 1. (‘sandwiching’) E(t) ⊆ L−T (t) ⊆ X−T (t) ⊆ U−T (t) ⊆ D for all −T ≤ t ≤ 0; 2. (‘funneling’) L−T (t) ⊆ L−S (t) ⊆ X−S (t) ⊆ U−S (t) ⊆ U−T (t), for all −S ≤ −T ≤ t ≤ 0; 3. (‘coalescing’) if, for some s, L−T (s) = U−T (s) then L−T (t) = U−T (t), for all t ≥ s. Moreover, we need that the event {L−T (0) = U−T (0)} almost surely occurs for finite T . If the above 3 inclusion properties hold and the latter event
112
Chapter 4. The Bombing Model
occurs then we can conclude that L−T (0) = U−T (0) is a perfect sample from πλ . This is roughly the content of Theorem 3.1 of Kendall and Møller (1999). The difference is that they consider a varying ‘maximal state’ D(t) but a fixed minimal state E(t) = ∅, whereas we consider a fixed maximal state D(t) = D, but a varying minimal state. In practice, the CFTP algorithm would consist of successively choosing increasing T and running E(t), L−T (t) and U−T (t) for t ∈ [−T, 0] until L−T (0) = U−T (0). The algorithm takes a long time to terminate when the difference between D and E(0) is large. This occurs typically if the difference between κ and λ is large. Therefore it is a good idea to choose a decreasing sequence κ = λ(0) > λ(1) > · · · > λ(n) = λ and successively sample from πλ(0) , πλ(1) , . . . , πλ(n) . At each step we can use the sample obtained in the previous step as dominating pattern D. In fact, in section 4.3 we showed how to choose the λ(i) in such a way that the difference between D and E(0) is never more than a single point. This allowed us to obtain samples from πλ for all λ in a given interval.
4.6.3
the hereditary case
Recall our definition of an hereditary point process at (4.15). Kendall and Møller (1999) give two algorithms to obtain samples from a hereditary point process with distribution πλ , one of which is based on birth-and-death processes. They construct a b&d process X(t) with πλ as its stationary distribution and a dominating process D(t) which is in equilibrium and time reversible. In fact, D(t) is at all times t a spatial Poisson process of intensity Kλ. Kendall and Møller give a coupling of D(t) and X(t) such that X(t) ⊆ D(t) for all t. They then demonstrate a coupling-from-the-past algorithm with D(t) (t ∈ [−T, 0]) as a (variable) maximal state and E(t) = ∅ as a trivial minimal state. The sample from πλ which the algorithm produces lies between D(0) and E = ∅. When λ is large the difference between D(0) and E will typically be large. If this is the case, then the algorithm will take very long to terminate because it has many different configurations to choose from. We give a generalization of the work of Kendall and Møller which allows us to take as a fixed minimal state a sample E ∼ πκ for an arbitrary κ < λ. The maximal state D(t) will be a birth-and-death process which has the superposition of E and a Poisson process of intensity K(λ − κ) as its equilibrium distribution. Noting that the empty set is trivially a sample from π0 we see that our generalization reduces to the Kendall and Møller algorithm when we take κ = 0. The use of the generalization is that it will allow us to choose an increasing
4.6 Sampling from general point processes
113
sequence 0 = λ(0) < λ(1) < · · · < λ(n) = λ and successively sample from πλ(0) , πλ(1) , . . . , πλ(n) . At each step we can use the sample obtained in the previous step as minimal pattern E to which we add a Poisson point process of intensity K(λ(i + 1) − λ(i)) to obtain the maximal pattern D(0). If we choose the steps from λ(i) to λ(i + 1) small enough, then the difference between D(0) and E will always be small too. The next lemma shows how we can obtain a sample from πλ by adding points to a sample from πκ for an arbitrary κ < λ. Lemma 4.7. Suppose condition (4.15) holds. Let 0 ≤ κ < λ. Then for all x∈Ω X f (x) fκ (y)pλ−κ (x \ y) = fλ (x). (4.19) f (y) y⊆x Proof This lemma basically follows from the superposition property of Poisson processes. By condition (4.15) we have that f (x)/f (y) is bounded. Now it follows from (4.14) that fκ (y) = f (y)e(1−κ)|S|κn(y) and f (x) = fλ (x)e(λ−1)|S| λ−n(x) . Hence X f (x) y⊆x
=
f (y)
pλ−κ (x \ y)fκ(y)
X fλ (x) y⊆x
f (y)
e(λ−1)|S| λ−n(x) e−(λ−κ)|S| (λ − κ)n(x\y) f (y)e(1−κ)|S|κn(y)
= fλ (x)λ−n(x)
X (λ − κ)n(x)−n(y) κn(y) y⊆x
= fλ (x).
� Suppose we have a sample E = y = {y1 , . . . , yn} from πκ for some κ < λ. Now consider a spatial birth-and-death process X(t), t ≥ 0 on the space {y ∪ x : x ∈ Ω} with birth rate b(y ∪ x, ξ) = (λ − κ)f (y ∪ x ∪ {ξ})/f (y ∪ x) and death rate d(y ∪ x, ξ) = 1. One easily checks that (λ − κ)
f (y ∪ x ∪ {ξ}) f (y ∪ x ∪ {ξ}) f (y ∪ x) pλ−κ (x) = 1 pλ−κ (x ∪ {ξ}). f (y ∪ x) f (y) f (y)
114
Chapter 4. The Bombing Model
So X(t) satisfies detailed balance with respect to f (y ∪ x) pλ−κ (x), f (y) which is therefore the density of the stationary distribution of X(t), conditionally on E = y. Hence, by lemma 4.7 the unconditional stationary distribution of X(t) is πλ . Consider another b&d process, D(t), t ≥ 0, on {y ∪ x : x ∈ Ω} with birthrate b(y ∪ x, ξ) = K(λ − κ) and death rate d(y ∪ x, ξ) = 1. Let D0 be the union of y and be a sample from PoK(λ−κ) . We have for all x ∈ Ω K(λ − κ)pK(λ−κ) (x) = 1pK(λ−κ) (x ∪ {ξ}). Hence if we set D(0) = D0 then D(t) is time reversible and in equilibrium. X(t) and D(t) have the same death rates, while by (4.15) the birth rate of D(t) is greater than the birth rate of X(t). Setting X(0) = D(0) it is not difficult to couple D(t) and X(t) such that X(t) ⊆ D(t) for all t. This could be done much like we indicated in the previous subsection for the antihereditary case. In fact, a detailed description of the coupling is given in Kendall and Møller (1999) for the particular—but in no sense special—case κ = 0. They also explain how to apply CFTP to obtain a perfect sample from the stationary distribution of X(t).
References A.J. Baddeley and R.D Gill (1997). Kaplan-Meier estimators for interpoint distance distributions of spatial point processes. Ann. Statist. 25 263–292. A.J. Baddeley (1999a). A crash course in stochastic geometry. In: Proceedings Seminaire Europ´een de Statistique, ‘Stochastic geometry, likelihood, and computation’ , O.E. Barndorff–Nielsen, W.S. Kendall and M.N.M. van Lieshout (editors). CRC Press (Chapman and Hall). A.J. Baddeley (1999b). Spatial sampling and censoring. In: Proceedings Seminaire Europ´een de Statistique, ‘Stochastic geometry, likelihood, and computation’ , O.E. Barndorff–Nielsen, W.S. Kendall and M.N.M. van Lieshout (editors). CRC Press (Chapman and Hall). P.J. Bickel, C.A.J. Klaassen, Y. Ritov and J.A. Wellner (1993). Efficient and Adaptive Estimation for Semiparametric Models. Johns Hopkins University Press, Baltimore. G. Celeux and J. Diebolt (1986). The SEM algorithm: A probabilistic teacher algorithm derived from the EM algorithm for the mixture problem. Computational Statistics Quarterly 2 73–82. A. Chessa (1995). Conditional Simulation of Spatial Stochastic Models for Reservoir Heterogeneity. PhD dissertation, Technische Universiteit Delft. C.F. Chung (1989a). Confidence bands for residual lifetime under random censorship model. J. Multiv. Anal. 29 94–126. C.F. Chung (1989b). Confidence bands for quantile function under random censorship. Ann. Inst. Statist. Math. 42 21–36. D.R. Cox (2000). Some Remarks on Likelihood Factorization. In: State of the Art in Probability and Statistics. M.C.M. de Gunst, C.A.J. Klaassen and A.W. van der Vaart (editors). IMS Lecture notes (to appear). N.A.C. Cressie (1991). Statistics for Spatial Data, John Wiley & Sons. 115
D. J. Daley and D. Vere-Jones (1988). An Introduction to the Theory of Point Processes. Springer-Verlag, New York. A.P. Dempster, N.M. Laird and D.B. Rubin (1977). Maximum likelihood from incomplete data via the EM algorithm. J. Roy. Statist. Soc. Ser. B 39 1–38. S.A. van de Geer (1993). Hellinger-consistency of certain nonparametric maximum likelihood estimators. Ann. Statist. 21 14–44. J.A. Fill and M. Machida (1998). Stochastic monotonicity and realizable monotonicity. Technical Report # 573, Department of Mathematical Sciences, The Johns Hopkins University. Submitted for publication. http://www.mts.jhu.edu/∼fill/ C.J. Geyer (1999). Likelihood inference for spatial point processes, Proceedings Seminaire Europ´een de Statistique, ‘Stochastic geometry, likelihood, and computation’ , O.E. Barndorff–Nielsen, W.S. Kendall and M.N.M. van Lieshout (editos), CRC Press (Chapman and Hall). C.J. Geyer and J. Møller (1994). Simulation procedures and likelihood inference for spatial point processes. Scand. J. Statist./ 21 359–373. C.J. Geyer and E.A. Thompson (1992). Constrained Monte Carlo maximum likelihood for dependent data (with discussion). J. Roy. Statist. Soc. Ser. B 54 657–699. W.R. Gilks, S. Richardson, and D.J. Spiegelhalter (1996). Markov Chain Monte Carlo in Practice. Chapman and Hall, London. R.D. Gill (1989). Non- and semiparametric maximum likelihood estimators and the von Mises method (part I). Scand. J. Statist. 16 97–128. R.D. Gill (1994). Lectures on Survival Analysis. In: D. Bakry, R.D. Gill ´ ´ e de Probabilit´es de Saint Flour XXII-1992, P. and S. Molchanov, Ecole d’Et´ Bernard (editor). Springer Lecture Notes in Mathematics 1581 115–241. P. Groeneboom and J.A. Wellner (1992). Information Bounds and Nonparametric Maximum Likelihood Estimation. Birkh¨auser Verlag, Basel. M.B. Hansen, A.J. Baddeley and R.D. Gill (1996). Kaplan-Meier type estimators for linear contact distributions. Scand. J. Statist. 23 129– 155. M.B. Hansen, A.J. Baddeley and R.D. Gill (1999). First contact distributions for spatial patterns: Regularity and estimation. Adv. Appl. Probab. 31 15–33. 116
Y. Huang and C.-H. Zhang (1994). Estimating a monotone density from censored observations. Ann. Statist. 22 1256–1274. J. Huang and J.A. Wellner (1995). Estimation of a monotone density or monotone hazard under random censorship. Scand. J. Statist. 22 3–33. W.S. Kendall (1997). On some weighted Boolean models. In: Proceedings of the International Symposium on Advances in Theory and Applications of Random Sets, D. Jeulin (editor), pp. 105–120, World Scientific Publishing. ¨ nnes (1998). Perfect simulation in stochastic W.S. Kendall and E. Tho geometry. University of Warwick Research Report 323. http://www.warwick.ac.uk/statsdept/Staff/WSK/ppt.html W.S. Kendall and J. Møller (1999). Perfect Metropolis-Hastings simulation of locally stable spatial point processes. University of Warwick Research Report 347. http://www.warwick.ac.uk/statsdept/Staff/WSK/ppt.html J. Kiefer and J. Wolfowitz (1956). Consistency of the maximum likelihood estimator in the presence of infinitely many incidental parameters. Ann. Math. Statist. 27 887–906. M.J. van der Laan (1993). Efficient and Inefficient Estimation in Semiparametric models PhD dissertation, University of Utrecht. Also: CWI tract 114 (1995). M.J. van der Laan (1995). Efficiency of the NPMLE in the line-segment problem. Scand. J. Statist. 23 527–550. M.J. van der Laan (1998). The two-interval line-segment problem. Scand. J. Statist. 25 163–186. C. Lantu´ ejoul (1997). Conditional simulation of object-based models. In: Advances in Theory and applications of Random Sets, D. Jeulin (editor). World Scientific Publishing Company, Singapore, 271–288. G.M. Laslett (1982a). The survival curve under monotone density constraints with applications to two-dimensional line-segment processes. Biometrika 69, 153–160. G.M. Laslett (1982b). Censoring and edge effects in areal and line transect sampling of rock joint traces. Math. Geol. 14, 125–140. L. Le Cam and G.L. Yang (1988). On the preservation of local asymptotic normality under information loss. Ann. Statist. 16 483–520. M.N.M. van Lieshout (1997). On likelihoods for Markov random sets and Boolean models. In: Proceedings of the International Symposium on 117
Advances in Theory and Applications of Random Sets, D. Jeulin (editor). World Scientific Publishing, Singapore. T. Lindvall (1992). Lectures on the Coupling Method. John Wiley & Sons. J. Lok (1994). The NPMLE of the Orientation Distribution and Comparison of Estimators of the Length Distribution in the Line Segment Problem. Master’s dissertation, University of Utrecht. H. Lum, I. Huang and W. Mitzner (1994). Morphological evidence for alveolar recruitment during inflation at high transpulmonary pressure. J. Appl. Physiol. 68 2280–2286. G. Matheron (1975). Random Sets and Integral Geometry. John Wiley & Sons. I. Meilijson (1989). A fast improvement to the EM-algorithm. J. Roy. Statist. Soc. Ser. B 51 127–138. I.S. Molchanov (1995). Statistics of the Boolean model: From the estimation of means to the estimation of distributions. Adv. in Appl. Probab. 27 63–86. I.S. Molchanov (1997). Statistics of the Boolean model for Practitioners and Mathematicians. John Wiley & Sons. J. Møller (1998). Markov chain Monte Carlo and spatial point processes. In: Proceedings Seminaire Europ´een de Statistique, ‘Stochastic geometry, likelihood, and computation’ , O.E. Barndorff–Nielsen, W.S. Kendall and M.N.M. van Lieshout (editors). CRC Press (Chapman and Hall). S.A. Murphy (1994). Consistency in a proportional hazards model incorporating a random effect. Ann. Statist. 22 712–731. X.X. Nguyen and H. Zessin (1979). Ergodic theorems for spatial processes. Z. Wahrsch. Verw. Gebiete 48 133–158. S.F. Nielsen (1997a). The imputation maximization algorithm. Preprint 2, Institute of Mathematical Statistics, University of Copenhagen. http://www.math.ku.dk/∼feodor/publications/index.html S.F. Nielsen (1997b). On simulated EM algorithms. Preprint 3, Institute of Mathematical Statistics, University of Copenhagen. http://www.math.ku.dk/∼feodor/publications/index.html E.H. Oldmixon, J.P. Butler and F.G. Hoppin (1994). Semi-automated measurement of true chord length distributions and moments by video microscopy and image analysis. J. Microsc. 175 60–69. 118
C.J. Preston (1977). Spatial birth-and-death processes. Bull. Int. Statist. Inst. 46 (2) 371–391 J.G. Propp and D.B. Wilson (1996). Exact sampling with coupled Markov chains and applications to statistical mechanics. Random Structures and Algorithms 9 223–252. B.D. Ripley (1981). Spatial Statistics, John Wiley & Sons. B.D. Ripley (1988). Statistical Inference for Spatial Processes. Cambridge University Press. F.S. Rosenthal (1989). Aerosol recovery following breathholding derived from the distribution of chordlengths in pulmonary tissue. J. Aerosol. Sci. 20 267–277. D.A. Ross (1993). A coherence theorem for ordered families of probability measures on a partially ordered space. Unpublished manuscript. J. Serra (1982). Image Analysis and Mathematical Morphology. Academic Press, London. F.W. Scholz (1980). Towards a unified definition of maximum likelihood. Canad. J. Statist. 8 193–203. D. Stone, D.C. Kamineni and A. Brown (1984). Geology and fracture characteristics of the underground research laboratory near Lac du Bonnet, Manitoba, Tech. Rep. 243, Atomic Energy of Canada Ltd. Research corporation. D. Stoyan, W.S. Kendall, and J. Mecke (1987). Stochastic Geometry and its Applications. Wiley, Chichester. A.W. van der Vaart (1996). Efficient maximum likelihood estimation in semiparametric mixture models. Ann. Statist. 24 862–878. A.W. van der Vaart and J.A. Wellener (1996). Weak Convergence and Empirical Processes. Springer, New York. A.W. van der Vaart (1998). Asymptotic Statistics. Cambridge University Press. Y. Vardi (1982). Nonparametric estimation in renewal processes. Ann. Statist. 10, 772–785. Y. Vardi and D. Lee (1993). From image deblurring to optimal investments: maximum likelihood solutions for positive linear inverse problems (with discussion). J. Roy. Statist. Soc. Ser. B 55 569–612. 119
G.C.G. Wei and M.A. Tanner (1990). A Monte Carlo implementation of the EM algorithm and the poor man’s data augmentation algorithm. J. Amer. Statist. Ass. 85 699–704. E.W. Weibel (1979). Stereological Methods, Volume 2. Academic Press, London. B.J. Wijers (1995a). Nonparametric Estimation for a Windowed LineSegment Process. PhD dissertation, University of Utrecht. Also: CWI tract 121 (1997). B.J. Wijers (1995b). Consistent non-parametric estimation for a one-dimensional line segment process observed in an interval. Scand. J. Statist. 22 335–360. E.W. van Zwet (2000). Perfect stochastic EM. In: State of the Art in Probability and Statistics. M.C.M. de Gunst, C.A.J. Klaassen and A.W. van der Vaart (editors). IMS Lecture notes (to appear).
120
Acknowledgements First of all, I would like to express my gratitude to Richard Gill, my supervisor, for supporting me mathematically while allowing me great freedom. Chapter 3 is based on joint work with Martin Hansen (Aalborg) and Chapter 4 is joint with Marie-Colette van Lieshout (CWI, Amsterdam). I’m looking forward to turning these chapters into papers with them. I am grateful for the hospitality of the maths and stats departments of the University of Western Australia (Perth) and the University of Washington (Seattle) where I enjoyed stays of six and three months respectively. These travels have been supported by the Dutch national science foundation (NWO grants SIR 13-4457 and SIR 13-4641) and by Shell. Despite being head of an understaffed computing support group, Andr´e de Meijer has always found the time to help me out with computer problems. These sessions were both illuminating and enjoyable. It seems to have become a tradition in our department to devote at least a full page to thanking one’s friends and family. As much as I enjoy reading such displays of affection, I shall not include one here. I trust my friends and family will not take its absence as a sign of ingratitude.
121
122
Samenvatting Op vele gebieden, zoals geologie, biologie of medicijnen worden gegevens verzameld bestaande uit een beeld van een proces van geometrische objecten in de ruimte. Lijnsegmenten kunnen breukvlakken in een rotsformatie voorstellen, waargenomen als rechte lijnen op het rotsoppervlak. Punten kunnen de locaties van bomen in een bos weergeven. Cirkelschijfjes kunnen cellen onder een microscoop zijn. Altijd is ons beeld begrensd, ook al strekt het proces zich ver buiten het beeld uit. Er ontstaat een soort censurering van de gegevens, namelijk dat van sommige objecten alleen een gedeelte waarneembaar is zodat de werkelijke omvang onbekend blijft. Dit proefschrift gaat over ruimtelijke statistiek, of preciezer: de mathematisch statistische analyse van ruimtelijke data. We observeren een of meerdere beelden, zoals hierboven beschreven, en stellen ons voor dat deze zijn ontstaan als trekkingen uit een kansverdeling. Het doel is om uit onze waarnemingen deze kansverdeling—of belangrijke eigenschappen ervan—zo goed mogelijk te achterhalen. Wellicht verheldert het volgende voorbeeld wat we bedoelen. Figuur 1.1 in dit proefschrift is een geologische kaart van een gebied van zo’n 160 bij 160 meter van het Canadese schild. In het zwarte deelgebied kunnen we het granieten rotsoppervlak waarnemen. Buiten dit gebied kunnen we het graniet niet zien vanwege begroeiing of water. De witte lijnen in het zwarte deelgebied zijn barsten in de rots. In hoofdstuk 2 geven we een methode om de kansverdeling van de lengte van de barsten te schatten op basis van de kaart. Men zou kunnen zeggen dat ruimtelijke statistiek moeilijker is dan ‘gewone’ statistiek. Een typische bijkomende moeilijkheid is ruimtelijke afhankelijkheid: wat men op verschillende locaties in een beeld waarneemt is zelden onafhankelijk van elkaar. Onafhankelijkheid is een standaard aanname in de statistiek, die in de ruimtelijke problemen zelden kan worden gehandhaafd. Andere moeilijkheden komen door censurering en andere rand-effecten. ‘Randeffecten’ is een verzamelnaam voor wiskundige complicaties die ontstaan als een ruimtelijk proces slechts in een beperkt gebied wordt waargenomen. Als 123
gevolg van al deze moeilijkheden is de ruimtelijke statistiek enigzins een achtergebleven gebied. In mijn proefschrift passen we echter moderne ‘mainstream’ statistische methoden toe in enige ruimtelijke problemen, waarbij we bovengenoemde moeilijkheden omzeilen. De wijze waarop wij dit doen zijn de ‘listen’ uit de titel. In hoofdstuk 1 leggen we ons gereedschap klaar. Nieuw in dit hoofdstuk is een algemene verhandeling over consistentie van de zogeheten meest aannemelijke schatter. Dit resulteert onder andere in Stelling 1.2. Deze stelling geeft voorwaarden waaronder de (niet parametrische) meest aannemelijke schatter in convexe modellen consistent is. In hoofdstuk 2 en 3 kunnen we deze stelling toepassen, hoewel we dit slechts in hoofdstuk 2 daadwerkelijk uitwerken. Ook presenteren we in hoofdstuk 1 een modificatie van de stochastische versie van het bekende EM algorithme. Dit algorithme passen we toe in hoofdstuk 4. In hoofdstuk 2 beschouwen we ‘Laslett’s lijnsegmenten probleem’. Het doel is de verdeling van de lengte van lijnsegmenten, waargenomen door een stochastische verzameling, te schatten. Dit probleem heeft een een ruime geschiedenis en werd onder meer bestudeerd in twee eerdere Utrechtse proefschriften, die van Mark van der Laan en Bart Wijers. Wij beschouwen het probleem in grotere algemeenheid en laten de aanname vallen dat het waarnemingsgebied convex is. Als gevolg hiervan kunnen we verschillende fragmenten van ´e´en lijnsegment waarnemen. In de praktijk is het onmogelijk te onderscheiden welke fragmenten bij elkaar horen, en zodoende zijn ze op een onontwarbare wijze afhankelijk. Onze ‘list’ is een eenvoudiger, maar vergelijkbaar probleem te beschouwen zonder deze afhankelijkheid. Voor dit probleem kunnen we de meest aannemelijke schatter afleiden. We tonen vervolgens aan dat de schatter ook goede eigenschappen heeft in het oorspronkelijke probleem. In hoofdstuk 3 schatten we de kansverdeling van de lengte van een ‘typische koorde’ van een stochastische verzameling. Een koorde is het langste lijnsegment door een gegeven punt van de verzameling in een gegeven richting, dat geheel binnen de verzameling past. De moeilijkheid is dat we de kansverdeling van de stochastische verzamling in termen van de koordelengte verdeling zouden moeten kennen om de meest aannemelijke schatter uit te kunnen rekenen. Dit is helaas zelden het geval. Wederom beschouwen we een eenvoudiger variant van het probleem, leiden de meest aannemelijke schatter af voor dat probleem en laten zien dat de schatter ook goed is in de oorspronkelijke situatie. In hoofdstuk 4 bestuderen we het ‘bommen’ model. We nemen de vereniging waar van enige toevallig rondgestrooide cirkelschijfjes. Men zou zich kunnen voorstellen dat deze schijfjes bom-kraters zijn, hetgeen de naam van dit 124
model verklaart. Op basis van onze waarnemingen willen we het verwachte aantal schijfjes schatten, waarvan het centrum zich in een verzameling van gegeven oppervlakte bevindt. Voor de kenner: We schatten de intensiteit van het Poisson process dat het waargenomen Boolese model genereerde. Het probleem is dat sommige schijfjes geheel bedekt kunnen worden door andere en zodoende volledig onzichtbaar zijn. Hier bestaat onze list uit een algorithme dat ons in staat stelt een steekproef te nemen uit de voorwaardelijke verdeling van de niet-geobserveerde schijfjes, gegeven wat we wel observeren. Met behulp van dergelijke steekproeven kunnen we de meest aannemelijke schatter schatten, zo gezegd. Het algorithme is in grotere algemeenheid toe te passen om puntprocessen te genereren waarvan de zogeheten Papangelou intensiteit van nul is wegbegrensd.
125
126
Curriculum Vitæ De schrijver van dit proefschrift werd geboren te ’s-Gravenhage op 10 november 1970. Van 1983 tot 1989 doorliep hij met goed gevolg het curriculum van het Stedelijk Gymnasium te Leiden. Vanaf 1989 studeerde hij wiskunde aan de Universiteit van Leiden, alwaar hij in 1995 het doctoraal behaalde onder het judicium ‘met genoegen’. Tijdens zijn studie te Leiden bezocht hij de Universiteit van North Carolina te Chapel Hill en het Institut f¨ ur Theoretische Nachrichten Technik und Informations Verarbeitung van de Universteit van Hannover. Van 1995 tot 1999 was hij onder begeleiding van Prof. dr Gill als AiO verbonden aan het Mathematisch Instituut van de Universiteit van Utrecht. In deze periode bezocht hij de Universiteit van West-Australi¨e te Perth en de Universiteit van Washington te Seattle. Naast het schrijven van dit proefschrift gaf hij—immer met veel plezier—het nodige onderwijs. Per 1 oktober zal hij werkzaam zijn als post-doc aan de Universiteit van Californi¨e te Berkeley.
127