Limitation of Transmission Line Switching Overvoltages using Switchsync Relays M. Sanaye-Pasand, M.R. Dadashzadeh, M. Khodayar Abstract-- When an overhead transmission line is energized by closing the line circuit breaker, some switching transients are generated in the power system including the line and the supply network. A traditional method for limiting switching overvoltages to acceptable levels is use of circuit breakers equipped with pre-insertion resistors. These resistors provide efficient limitation of the switching overvoltages. However, they make the circuit breakers more complex and costly. Controlled closing and re-closing of line circuit breakers using switchsync controllers eliminates the need for pre-insertion resistors. The mitigation of the switching overvoltages especially when used in conjunction with surge arresters could provide acceptable results. Calculation of transmission line switching overvoltages for the case that line circuit breakers are equipped with appropriately designed switchsync controllers is performed in this paper. The transient based EMTP software is used to model an appropriate power system and various simulations are performed. Statistical studies have been investigated to determine the maximum switching overvoltages when a switchsync relay for an uncompensated transmission lines is used. Effectiveness of the new line energization method is evaluated in the paper as well. Keywords: Transmission Line Transients, Switching Overvoltages, Switchsync Relay, EMTP.
W
I. INTRODUCTION
hen an overhead transmission line is energized by closing the line circuit breaker, some switching transients are generated not only on the line, but also in the supply network. Transmission line switching transient and its severity depends on the difference between the supply and the line voltages at the instant of energization. If energization occurs at an instant when the difference between supply voltage and the line voltage is high, a large traveling wave would be injected on the transmission line. At the time this wave reaches the open far end of the line, it gets reflected and a high transient overvoltage is experienced. Such switching transients are of concern for many EHV transmission networks, especially for long transmission lines. For transmission networks rated at voltages of 420 kV and above, switching impulse withstand voltage of the system and its equipment is about 2-3 p.u. and therefore, switching
M. Sanaye-Pasand is with Electrical and Computer Engineering Department, University of Tehran, Tehran, Iran (e-mail:
[email protected]). M. R. Dadashzadeh is with Moshanir Power Engineering Consultants, Tehran, Iran (e-mail:
[email protected]). M. E. Khodayar is with Electrical Engineering Department, Sharif University of Technology, Tehran, Iran (
[email protected]) Presented at the International Conference on Power Systems Transients (IPST’05) in Montreal, Canada on June 19-23, 2005 Paper No. IPST05 - 087
overvoltages have to be kept under control [1]. The calculation of switching overvoltages is fundamental for appropriate insulation design of many power system components. On the other hand, equipment insulation design is not usually based on the highest possible amount of overvoltage as this particular event has a low probability of occurrence, and the design based on this amount would not be economical. Besides, in many cases, it might be very difficult to determine the combination of parameters which produces the highest amount of overvoltage. The insulation design of power equipment is based on the concepts of stress and strength. The probability distribution of switching overvoltages (stress) is to be compared to the equipment insulation (strength) that is also described statistically; the goal is to choose the insulation level so as to achieve a failure rate criterion [2]. A traditional method of limiting these switching overvoltages to acceptable levels is to use circuit breakers equipped with preinsertion resistors. These resistors provide efficient limitation of the switching overvoltages, but make the circuit breakers mechanically more complex and also more costly. Controlled closing and reclosing of line circuit breakers using switchsync controllers eliminates the need of preinsertion resistors [1]. The limitation of the switching overvoltages – especially when used in combination with surge arresters – could be similar to what is achieved with preinsertion resistors [1]. In order to determine the necessity of using surge arrester and its characteristics, appropriate switching studies should be performed. In this paper, the traditional methods for statistical switching studies are introduced. The traditional statistical switching studies method should be revised when switching control schemes are used. A new approach based on statistical switching studies and the usage of switchsync relay is proposed. Simulation studies are performed and obtained results and compared with the previous method’s results. II. STATISTICAL SWITCHING STUDIES Breaker closing operations in power systems can produce transient overvoltages whose maximum peaks depend on several factors such as network configuration on the source side of the breaker and the amount of trapped charge in reclosing operations of transmission lines [2]. Therefore, statistical switching studies are used to determine the maximum switching overvoltages along the transmission line. A. Insulation Coordination Assessment Due to economical considerations, it is not practical to use
insulations that stand all levels of overvoltages with no failure. Insulation design of power equipment is based on the frequency of occurrence of a specific event, the overvoltage probability distribution corresponding to this event, and the failure probability of the insulation. Power equipment strength can be described by a cumulative distribution, Pd(V), which is the probability of failure of the insulation under a standard impulse with the value of V. Overvoltage stress probability is described by distribution Po(V). The risk of failure is the probability that the stress exceeds the strength of the insulation, and is obtained by means of the following expression [2]: ∞
∫
R = Po (V ) ⋅ Pd (V ) ⋅ dV
(1)
points along the transmission line are evaluated. Standard deviation (σ) and medium (η) of the overvoltages for these points are calculated considering the maximum voltages obtained during the simulation. As distribution of the switching overvoltages in the network is considered as a Gaussian distribution, the value of U0 for each point on the transmission line is calculated as follows: λ
F (λ ) =
1
∫
2π
0
⋅ exp(−
x2 ) ⋅ dx = 0.98 2
⇒ λ = 2.05
λ=
U0 −η
σ
(2)
⇒ U 0 = η + 2.05 ⋅ σ
0
Fig. 2. IEC simplified statistical based method for insulation coordination
Fig. 1. Overvoltage probability distribution, insulation failure cumulative distribution and risk of failure probability distribution.
The overvoltage probability distribution and insulation failure cumulative distribution are shown in Fig. 1. The curves of overvoltage probability and the failure probability of insulation due to overvoltages are multiplied to obtain the risk of failure curve. The area under this curve indicates the failure probability of the insulation. In practice, finding Pd(V) and Po(V) curves are very difficult and impractical. Therefore, as stated in [3] a simplified statistical based method has been used for insulation coordination. In this method, one point from each curve is considered. As shown on Pd(V) curve in Fig. 2, this point is the voltage at which the probability of insulation failure is 10%. It means that the insulation would stand the overvoltages with the probability of 90%. This point is called Statistical Insulation Withstand Level or SIWL and indicated as Uw [3]. On the Po(V) curve, a voltage is selected in a way that the probability of occurrence of the voltages more than that voltage is 2%. This voltage is called statistical overvoltage and is illustrated as U0. As the probability of occurrence of overvoltages in the network P0(V) is considered constant, the insulation withstand level can be changed by changing the insulation type of the equipment. The proportion Uw/U0 called statistical safety factor changes accordingly [3]. If by changing insulation type of the equipment this factor increases, the risk of failure decreases. In order to coordinate the insulation level, the power network under study is simulated by EMTP statistically and the maximum overvoltages in each switching study in some
B. Uniform Distribution Switching EMTP software provides a statistical switch for overvoltage switching studies. The closing time of a statistical switch is selected randomly according to the probability distribution, which is usually uniform or normal (Gaussian). It is generally assumed that the closing event of an independent breaker pole may occur at any point of voltage signal with equal likelihood. Therefore, the uniform distribution, shown in Fig. 3, is considered for statistical switches. In order to cover all possible switching conditions in the network, the switch of each phase is considered as a statistical switch with uniform probability distribution having the Standard Deviation (SD=σ) of 5 ms [4].
Fig. 3. Uniform distribution
C. Number of Switching If the number of switching simulation studies increases, the simulation time and accuracy increases and vice versa. As a rule of thumb, no less than 100 runs must be performed to obtain a switching overvoltage distribution accurate enough [2]. Nevertheless, the number of enough switching should be increased when the amount of standard deviation increases. D. Modeling of Trapped Charge on Transmission Lines Considering the worst case in practice, closing of the transmission lines occurs for fast reclosing conditions so that the transmission line has a trapped charge on it at the instant of closing. For uncompensated EHV lines without shunt
reactors at both ends, the trapped charge voltage will appear in DC form on different phases [5],[6]. Table I shows the amount of trapped charge voltages assumed for simulations at the instant of switch closure. The trapped charge variation for a modeled 400 kV transmission line is shown in Fig. 4. TABLE I INITIAL TRAPPED CHARGE Va +1.05 Vb -1.05 Vc +1.05 4
x 10
5
Trapped Charge
3 Va Vb Vc
2
opening commands to the circuit breaker are delayed in such a way that making or contact separation will occur at the optimum time instant related to the phase angle. Controlled switching has been used in the past to eliminate harmful electrical transients upon planned switching of mainly capacitor banks, shunt reactors and power transformers. The method is also gaining acceptance for re-energizing of EHV transmission lines to replace traditional pre-insertion resistors. By means of switchsync controllers, both energizing and deenergizing operations can be controlled with regard to the point-on-wave position to mitigate harmful transients [1]. Figure 6 shows the method used in switchsync relays.
Voltage(V)
1
0 -1
Fig. 6. Switchsync relay operating diagram
-2
-3
-4
0
0.01
0.02
0.03
0.04
0.05 0.06 Time(sec)
0.07
0.08
0.09
0.1
Fig. 4. Trapped charge modeling using EMTP
E. Effect of Environmental Parameters The withstand level of insulation depends on different parameters such as air density, rate of raining, environmental pollution and the maximum amount of switching overvoltage. In order to obtain the SIWL for a specific environmental condition, the standard SIWL of the line should be multiplied by a correction factor. This way appropriate statistical safety factor is obtained to coordinate insulation level of the equipment [3]. All the simulations in this paper have been performed considering standard conditions. F. Average Switch Closing Time In order to calculate the maximum switching overvoltage for the worst conditions, the average closing time of the switch is selected in a way that the amplitude of the source voltage for each phase has an opposite sign in comparison to the trapped charge of that phase. Table II and Fig. 5 illustrate the selected closing time for the switch of each phase. 5
x 10
5
Closing at Phases Peaks Va Vb Vc
t=0.0467
4 3
Voltage(V)
2 1 0 -1 -2 -3 t=0.0433 -4 t=0.05 -5
0.04
0.045
0.05
0.055
0.06
Time(sec)
Fig. 5. Average switch closing time for three phases TABLE II AVERAGE SWITCH CLOSING TIME FOR THREE PHASES Phase A Phase A Phase A 0.05 0.0467 0.0433
III. SWITCHSYNC RELAY Controlled switching is a method for reduction of harmful transients via time controlled switching operations. Closing or
As shown in Fig. 6, proper operation of switchsync relays requires practically fixed operating time. Therefore, the breaker operating time should be approximately constant. As a practical example, live tank circuit breakers and disconnecting circuit breakers manufactured by ABB company have spring operating mechanisms. For some of the variants, a motor drive is incorporated as an alternative. All these circuit breakers have stable operating times, which vary only to a limited extent with factors such as ambient temperature and control voltage. For moderate variation of these factors, the opening and closing times will typically show a variation of less than plus/minus 0.5 ms. Similarly, after a long idle time, either in closed or opened position, the circuit breakers will have stable operating times, even upon the first operation [1]. In this research work, the relay model F236 manufactured by ABB is used as the switchsync relay. In this relay, trapped charge on the line, remained from the opening operation, is not recorded. At the closing instant, the circuit breaker is controlled to make the current when the instantaneous phaseto-ground voltages are close to zero. In this procedure, high overvoltages are limited irrespective to the actual trapped charge. This is a straightforward method, and the obtained overvoltage level is often acceptable, especially when this method applied in conjunction with surge arresters. Due to variation of parameters, switchsync controllers must be chosen based on case-by-case basis and often require an assessment of the system switching overvoltages. The best configuration to reduce switching overvoltages is combination of switchsync and surge arresters. The surge arresters may be placed at line ends, as a normal part of the protection system for the substations, or may also be placed along the line [7]. Statistical switching studies using switchsync relay, determine the necessity of surge arrester along the line. IV. SYSTEM AND EQUIPMENT MODELING A simple power system is modeled using real data selected from a part of the Iran national network. The system includes a transmission line connected to an equivalent network
I
I
I
Wave-imp
U Wave-imp
B8 B0
U
B1
B2
B3
B4
B5
B6
B7
Fig. 7. System switching study model using EMTP
A. Transmission Line Models with frequency dependent parameters are usually used for accurate modeling of EHV lines during switching overvoltage evaluation [8]. To model system’s transmission line, a 400 kV, 160 km untransposed line is represented by J. Marti's frequency dependent model. The tower configuration for this line is shown in Fig. 8. As shown in Fig. 7, transmission line model is divided into eight equal parts to obtain the profile of switching overvoltages along the line. The modeled transmission line’s parameters are as follows: Number of phases = 3 Number of bundles = 2 Conductor: ACSR Curlew, 1033 kcmil Number of shield wires = 2 Shield wire: Alumweld 7 No. 8, 115.6 kcmil
Fig. 8. Conductor arrangement for the 400 kV tower
B. Source In order to evaluate the effect of system sources on switching studies while a switchsync relay is used, two sources are considered to feed the line. One of the sources is directly connected to the line, while the other one is connected to the transmission line under study through a different 150 km transmission line. Moreover, the wave impedance, which equals to 200 ohm, is considered for both sources. The wave impedance has a significant effect on switching study results and makes the simulation more realistic. Parameters of both of the sources are R1=8.5, X1=78, R0=0.8 and X0=25.12 Ohms. C. Arrester Two surge arresters are placed at both ends of the transmission line under study. A typical 360 kV gapless ZnO arrester is modeled and used for all simulations [5].
V. REVISING STATISTICAL SWITCHING STUDIES In the previous sections, the traditional method for statistical switching studies was introduced. In contrast to the cases for which statistical switches are used with or without preinsertion resistor, usage of switchsync relays result in different procedure and phenomena. As a result, the traditional statistical switching studies method should be revised when switching control schemes are used. A new approach based on statistical switching studies and the usage of switchsync relay is proposed in this section. The modeling of trapped charge on the transmission line and environmental parameter effects are not changed for the new approach. However, other aspects of switching studies should be revised which are explained in the next sections. A. Average Switch Closing Time As mentioned in section II-F, in switching studies made with preinsertion resistances and without switchsync relays, the closing instant of the statistical switch took place on the maximum voltage of the source for each phase and on the opposite polarity of the trapped charge on the line. According to the switchsync relay's operating principals, the switching instances for different phases should be adjusted at the zero point of voltage signals with the time differences of 3.33 ms between them. Since for the previous method the voltage sources are adjusted with average closing time at voltage peaks, for simulating the new method the voltages of all sources can be shifted π/2 or -π/2 in phase to obtain an average closing time at zero point. This way, it would not be necessary to change statistical switch parameters. The advantage of this method over the average closing time changing is the consistency of trapped charge amount at the closing instance. If the average switch closing time had been shifted 5 ms to close at zero point, the transmission line trapped charge would have been damped. Therefore, the amount of maximum switching overvoltage would have been computed less and vise versa. Two different cases could be considered for this method. Source voltage and line voltage due to the trapped charge on the line are shown in Fig. 9 for one of the cases. According to Fig. 9, when the phase shift equals π/2, source voltage at the switching instant increases with the same polarity as the trapped charge of the line (case 1). 5
4
Case 1
x 10
3
2
1 Voltage(V)
through a statistical switch. Trapped charge on the line is modeled by a source. Surge arresters are modeled on both ends of the line as well. Various switching studies are performed using switchsync relay method as well as other methods and system overvoltages are studied and compared for different methods. Figure 7 shows schematic diagram of the system modeled using the EMTP software.
0 -1
-2
-3
-4
0
0.01
0.02
0.03 Time(sec)
0.04
0.05
0.06
Fig. 9. Source voltage and line mid point voltage for phase C, case 1
According to Fig. 10, when the phase shift equals -π/2,
source voltage at the switching instant increases with the opposite polarity of the trapped charge on the line (case 2). The overvoltages, which are experienced on the transmission line in each of theses two cases, are different. Therefore, the maximum switching overvoltages with their specific probability for the two cases must be calculated considering related mediums and standard deviations. They will be introduced and explained in the next section. 5
2
Voltage(V)
1
0 -1
-2
-3
0
0.01
0.02
0.03 Time(sec)
0.04
0.05
0.06
Fig. 10. Source voltage and line mid point voltage for phase C, case 2
B. Insulation Coordination Assessment As stated in section II-A in order to coordinate the transmission line insulation level, U0 should be calculated. In the case the breaker is not equipped with switchsync relay, the amount of U0 is evaluated by (2). In contrast, when the breaker is equipped with a switchsync relay, (2) must be modified by considering the two mentioned cases (case 1 and case 2) with their proponent probabilities as shown in (3): 0.5 × P (ϕ = 90) + 0.5 × P(ϕ = −90) = 0.98 (3) Equation (4) shows the cumulative distribution probability function for cases 1 and 2. U 0 −η1
σ1
∫
P(ϕ = 90) =
P(ϕ = −90) =
−
1
0 U 0 −η 2 σ2
∫ 0
2π
e
1 2π
x2 2
⋅ dx
(4) −
e
x2 2
⋅ dx
By substituting (4) in (3), it can be concluded that: U 0 −η1
σ1
0.5 ×
∫ 0
1 2π
e
−
U 0 −η 2 σ2
2
x 2
⋅ dx + 0.5 ×
∫ 0
Maximum Switching Overvoltage (pu)
2.2 2.1 2 1.9 1.8 1.7 1.6 1.5 1.4
0
20
40 60 80 100 120 Distance from the closing end of the line (km)
140
160
Fig. 11. line overvoltage profile for cases 1 and 2, and combined case.
Case 2
3
-4
Combined Cases Case 1 Case 2
2.3
C. Statistical Switching Standard Deviation As mentioned in section II-B, in order to cover all the possible states in switching studies without using a switchsync relay, the standard deviation of the statistical switch was set to 5 ms. In the case that the breaker uses a switchsync relay, the switching instant is predefined, and the only problem is the error which might occur for the breaker at the closing instant. Inasmuch as switchsync relay is a simple digital relay and no complexities exist in its algorithm, the error related to it is negligible [1]. The breaker error arises when the closing instant of the switch differs in each switching due to the environmental conditions, so this type of relay is only suggested for repeatable breakers. Besides, the switchsync relay may not be correctly adjusted with the breakers that yield an error in detecting the zero crossing of the voltage. These errors can be modeled by statistical switches in statistical switching studies. As such, the standard deviation of switch represents the error of breaker and switchsync relay set. For the breakers studied in this paper opening and closing times will typically show a small variation of less than plus/minus 0.5 ms. As the breaker error is small, a small SD should be considered for statistical switching. In order to evaluate effect of SD of the switch on the switching overvoltage studies, the amount of maximum switching overvoltage versus the changes in SD is evaluated and depicted in Fig. 12. As shown in this figure, the amount of maximum switching overvoltage increases when the amount of SD increases. Therefore, the accuracy of breaker closing time has a significant effect on the amount of overvoltage. 2.4
1 2π
e
−
2
x 2
⋅ dx = 0.98
(5)
In contrast to (2), which was easily solved using analytical method and led to a simple algebraic equation, the above equation cannot be solved easily. Therefore, a suitable software is used to solve this equation numerically. In order to obtain maximum switching overvoltage profile, two switching studies for cases 1 and 2 should be performed resulting in voltage mediums and standard deviations for several points on the transmission line. Then, U0 for each point should be calculated form (5). Figure 11 shows the voltage profile of the transmission line for case 1, case 2, and the combined cases.
Transmission Line Voltage Profile using Switchsync Relay with Different SD SD = 0.5 ms SD = 1 ms SD = 2 ms
2.3 Maximum Switching Overvoltage (pu)
x 10
4
Transmission Line Voltage Profile for Two Cases and Combined Case
2.4
2.2
2.1
2 1.9
1.8
1.7 1.6 0
20
40 60 80 100 120 Distance from closing end of the line (km)
140
160
Fig. 12. Effect of SD changes in variation of maximum switching overvoltage
D. Number of Switching As mentioned in section II-C, required number of switching should be increased when the amount of standard deviation increases. For the case that a switchsync relay is used for limiting transmission line's switching overvoltage, the amount of SD decreases in comparison to the amount of SD
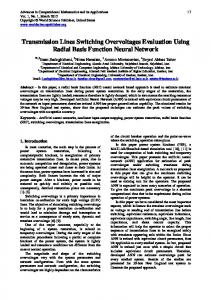
for the traditional methods. As a result, the number of required switching can be reduced. Several simulations with different number of switching between 50 and 300 were performed. It was found that the maximum deviation for obtained results is at most 0.02 pu. As performing simulation studies using powerful present day's computers does not take considerable amount of time, the number of switching is considered to be 100 runs. This number is consistent with the number of runs used for the previous traditional method. VI. SIMULATION RESULTS In order to compare different methods, various studies were performed. Results obtained for the three cases shown in Table III are presented in this section. The traditional and revised statistical switching analysis methods were used to study the effect of using preinsertion resistors and/or switchsync relays. Figure 13 shows the maximum switching overvoltage along the transmission line for these cases. As shown in this figure, preinsertion resistor has significant effect on decreasing the switching overvoltage. The switchsync relay method also decreases switching overvoltage by about 0.25 pu. EHV long transmission lines are generally compensated by shunt reactors to reduce the system overvoltages due to Franti effects. The switchsync relay used in this paper is designed to be used for uncompensated transmission lines. The problem of overvoltage for short EHV transmission lines is usually less. The maximum switching overvoltage for short lines is usually less or just a little higher than SIWL of the line insulation. As the switchsync relay used in this study reduces the overvoltage by about 0.25 pu, therefore, this kind of switchsync relay can reduce the maximum switching overvoltage of short lines appropriately to the safe amount. By using some surge arresters along the transmission line in conjunction with the switchsync relay, overvoltages could be reduced further [9] and [10]. More advanced switchsync relays should be used for long compensated transmission lines to reduce the overvoltage below SIWL of the line insulation. Transmission Line Voltage Profile Using Different Methods 2.5
Switchsync Relay Direct Switch Pre - Insertion Resistor
Maximum Switching Overvoltage (pu)
2.4
switching overvoltages, but make the circuit breakers mechanically more complex and also more costly. Controlled closing and reclosing of line circuit breakers using switchsync relay can reduce line switching overvoltages. In this paper, the traditional statistical study is revised in order to meet the requirements of using this kind of relay. Different effects of parameters on the switching overvoltages are evaluated. According to the results obtained through several simulations, although this kind of relay is not as effective as preinsertion resistor, but the range of obtained overvoltage limitation is acceptable for uncompensated transmission lines. For long or compensated lines, some surge arresters along the transmission line or more complex switchsync relay are required. VIII. REFERENCES [1] [2]
"Controlled Switching Application Guide", Edition 1, ABB., 2004. J.A. Martinez, R. Natarjan, E. Camm, "Comparison of statistical switching results using gaussian, uniform and systematic switching approaches," in Proc. 2000 IEEE Power Engineering Society Summer Meeting, vol. 2, pp. 884-889. [3] Insulation coordination-Part2 :Application guide, IEC Standard 712:1996. [4] M.M. Morcos, "Phase-to-Ground switching Transient in EHV Systems," Proc. 22nd Annual North American Conference 1990, pp. 203-210. [5] S.H. Hosseini, M. Abedi, B. Vahidi , "Digital computer studies of random switching of iranian standard 400kV lines," Proc. of the 3rd International Conference on Properties and Applications of Dielectric Materials; July 8-12, 1991 Tokyo, Japan, pp. 542-545. [6] K. Froehlich C. Hoelzl, M. Stanek, A.C. Crarvalho, W. Hofbauer, P. Hoegg, B. L. Avent, D.F. Peeli and J. H. Sawada, "Controlled closing on shunt reactor compensated transmission lines," IEEE Trans. Power Delivery, vol. 12, no. 2, pp. 734-740, April 1997. [7] L. Stenstrom and M. Mobedjina, "Limitation of switching overvoltage by use of transmission line surge arresters," in Proce. 1998 CIGRE SC 33 International Conference Zagreb, Croatia. [8] H.W. Dommel, Electromagnetic Transients Program. Refrence Manual (EMTP Theory Book), Bennovile Power Administration, Portland 1986. [9] A.C. Legate, J.H. Brunke, J.J. Ray, E.J. Yasuda , "Elimination of closing resistors on EHV circuit breakers," IEEE Trans. Power Delivery, vol. 3, no. 1, Jan. 1998. [10] Y. Musa, A. J. K. Keri, J.A. Halladay, "Application of 800-kV dead tank circuit breaker with transmission line surge arrester to control switching transient overvoltages," IEEE Trans. Power Delivery, vol. 17, no. 4, pp. 957-962, Oct. 2002.
IX. BIOGRAPHIES
2.3 2.2
Majid Sanaye-Pasand, graduated in electrical engineering in 1988, Tehran, Iran, and received his M.Sc. and Ph.D. in 1994 and 1998, Calgary, Canada, respectively. His areas of interest include power system analysis and control, digital protective relays and application of AI. He is at present an assistant professor at University of Tehran.
2.1 2 1.9 1.8 1.7 1.6 1.5
0
20
40 60 80 100 120 Distance from the closing end of the line (km)
140
160
Fig. 13. Comparison of different methods of limiting switching overvoltages TABLE III SIMULATED CASES Without Pre-insertion Resistor 1 With Pre-insertion Resistor = 200 Ω 2 F236 Switchsync relay with SD = 0.5 ms 3
VII. CONCLUSIONS Preinsertion resistors provide efficient limitation of the
Mohammad Reza Dadashzadeh was born in Iran. He obtained B.S. and M.S. degrees in electrical engineering from Tehran University. He is currently working in Moshanir Power Engineering Consultants, and serves as a system study senior engineer. His areas of interest include power system analysis, control, and digital protection. Mohammad Smaeil Khodayar was born in Iran. He obtained B.S. degree in Tehran Polytechnic, and he is studying towards M.S. degree in electrical engineering at Sharif University of Technology. His areas of interest include power system analysis and control.