work analyzes a particular digital libraryâthe website of the. Bureau of Labor .... ing on a focused subset of the data helps to overcome prob- lems two and three .... Once the Editor's Desk documents were assigned to clusters, we constructed a ...
Machine Learning for Information Architecture in a Large Governmental Website ∗
Miles Efron, Gary Marchionini, John Elsas and Julinang Zhang School of Information and Library Science CB#3360, 100 Manning Hall University of North Carolina Chapel Hill, NC 27599-3360 {efrom, march}@ils.unc.edu, {jelsas, junliang}@email.unc.edu ABSTRACT
The project goal is to classify the site’s web content according to these inferred concepts as an initial step towards data This paper describes ongoing research into the application of filtering via active user interfaces (cf. [8]). Many digital limachine learning techniques for improving access to governbraries already make use of content classification, both exmental information in complex digital libraries. Under the auspices of the GovStat Project (http://www.ils.unc.edu/govstat),plicitly and implicitly; they divide their resources manually by topical relation; they organize content into hierarchically our goal is to identify a small number of semantically valid oriented file systems. The goal of the present research is to concepts that adequately spans the intellectual domain of develop another means of browsing the content of these cola collection. The goal of this discovery is twofold. First lections. By analyzing the distribution of terms across docwe desire a principled aid to information architects. Secuments, our goal is to supplement the agencies’ pre-existing ond, automatically derived document-concept relationships information structures. Statistical learning technologies are are a necessary precondition for real-world deployment of appealing in this context insofar as they stand to define a many dynamic interfaces. The current study compares condata-driven—as opposed to an agency-driven—navigational cept learning strategies based on three document represenstructure for a site. tations: keywords, titles, and full-text. In statistical and user-based studies, human-created keywords provide signifOur approach combines supervised and unsupervised learnicant improvements in concept learning over both title-only ing techniques. A pure document clustering [7] approach to and full-text representations. such a large, diverse collection as BLS led to poor results in early tests [1]. But strictly supervised techniques [2] are 1. INTRODUCTION inappropriate, too. Although BLS designers have defined The GovStat Project is a joint effort of the University of high-level subject headings for their collections, as we disNorth Carolina Interaction Design Lab and the University cuss in Section 2, this scheme is less than optimal. Thus we of Maryland Human-Computer Interaction Lab. Citing endhope to learn an additional set of concepts by letting the user difficulty in finding governmental information (espedata speak for themselves. cially statistical data) online, the project seeks to create an integrated model of user access to US government statistiThe remainder of this paper describes the details of our concal information that is rooted in realistic data models and cept discovery efforts and subsequent evaluation. In Section innovative user interfaces. To enable such models and in2 we describe the previously existing, human-created conterfaces, we propose a data-driven approach, based on data ceptual structure of the BLS. This section also describes evimining and machine learning techniques. In particular, our dence that this structure leaves room for improvement. Next work analyzes a particular digital library—the website of the we turn to a description of the concepts derived via conBureau of Labor Statistics (http://www.bls.gov)—in efforts tent clustering under three document representations: keyto discover a small number of linguistically meaningful conword, title only, and full-text. Section 6 describes a two-part cepts, or ”bins,” that collectively summarize the semantic evaluation of the derived conceptual structures. Finally, we domain of the site. conclude in Section 7 by outlining upcoming work on the project. ∗ This research was supported by NSF EIA grant 0131824.
2.
STRUCTURING ACCESS TO THE BLS WEBSITE
The Bureau of Labor Statistics (BLS) is a federal government agency charged with compiling and publishing statistics pertaining to labor and production in the US and abroad. Given this broad mandate, the BLS publishes a wide array of information, intended for diverse audiences. The agency’s website (http://www.bls.gov) acts as a clearinghouse for this
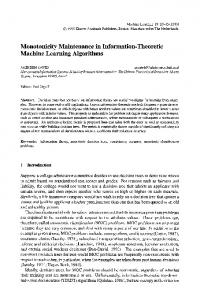
Figure 1: Relation Browser Prototype process. With over 15,000 text/html documents (and many more documents if spreadsheets and typeset reports are included), providing access to the collection provides a steep challenge to information architects.
2.1
The Relation Browser
The starting point of this work is the notion that access to information in the BLS website could be improved by the addition of a dynamic interface such as the relation browser described by Marchionini and Brunk [8]. The relation browser allows users to traverse complex data sets by iteratively slicing the data along several facets. In Figure 1 we see a prototype instantiation of the relation browser, applied to the FedStats website (http://www.fedstats.gov). The relation browser supports information seeking by allowing users to form queries in a stepwise fashion, slicing and re-slicing the data as their interests dictatate. Thus in Figure 1, users mights limit their search set to those documents about ”energy.” Within this subset of the collection, they might further eliminate documents published more than a year ago. Finally, they might request to see only documents published in PDF format. As Marchionini and Brunk discuss, capturing the publication date and format of documents is trivial. But successful implementations of the relation browser also rely on topical classification. This presents two stumbling blocks for system designers: • Information architects must define the appropriate set of topics for their collection • Site maintainers must classify each document into its appropriate categories
Figure 2: The BLS Home Page These tasks parallel common problems in the metadata community: defining appropriate elements and marking up documents to support metadata-aware information access. Given a collection of over 15,000 documents, these hurdles are especially daunting, and automatic methods of approaching them are highly desirable.
2.2
A Pre-Existing Structure
Prior to our involvement with the project, designers at BLS created a shallow classificatory structure for the most important documents in their website. As seen in Figure 2, the BLS home page organizes 65 ”top-level” documents into 15 categories. These include topics such as Employment and Unemployment, Productivity, and Inflation and Spending. We hoped initially that these pre-defined categories could be used to train a 15-way document classifier, thus automating the process of populating the relation browser altogether. However, this approach proved unsatisfactory. In personal meetings, BLS officials voiced dissatisfaction with the existing topics. Their existence, it was argued, owed more to the institutional structure of BLS than it did to the inherent topology of the website’s information space. In other words, the topics reflected official divisions rather than semantic clusters. This impression was borne out quantitatively. This is a very shallow classificatory structure; each of the 15 top-level categories is linked to a small number of related pages. Thus there are 7 pages associated with Inflation. Altogether, the link structure of this classificatory system contains 65 documents; that is, excluding navigational links, there are 65 documents linked from the BLS home page, where each hyperlink connects a document to a topic (pages can be linked
10 4
6
8
Document clustering (cf. [11]) provided an obvious, but only partial solution to the problem of automating this type of high-level information architecture discovery. The problems with standard clustering are threefold.
1. Mutually exclusive clusters are inappropriate for identifying the topical content of documents, since documents may be about many subjects.
2
Eigenvlue Magnitude
12
14
we desired a means of concept discovery that would be based not on the structure of the agency, but on the content of the material. To begin this process, we crawled the BLS website, downloading all documents of MIME type text/html. This led to a corpus of 15,165 documents. Based on this corpus, we hoped to derive k ≈ 10 topical categories, such that each document di is assigned to one or more classes.
0
2. Due to the heterogeneity of the data housed in the BLS collection (tables, lists, surveys, etc.), many documents’ terms provide very noisy topical information.
0
10
20
30
40
50
60
Eigenvalue Rank
3. For application to the relation browser, we require a small number (k ≈ 10) of topics. Without significant data reduction, term-based clustering tends to deliver clusters at too fine a level of granularity.
Figure 3: Scree Plot of BLS Categories to multiple topics). Based on this hyperlink structure, we defined M, a symmetric 65 × 65 matrix, where mij counts the number of topics in which documents i and j are both classified on the BLS home page. From an intuitive standpoint, one of the most problematic aspects of the pre-existing BLS topic structure was the fact that its classes reflect the structure of the organization. Since many offices in BLS are concerned with issues of Business Costs, for example, the home page of the Producer Price Index is linked to three of the fifteen categories. To analyze the redudancy inherent in the pre-existing structure, we derived the principal components of M (cf. [12]). Figure 3 shows the resultant scree plot. Because all 65 documents belong to at least one BLS topic, the rank of M is guaranteed to be less than or equal to 15 (hence, eigenvalues 16 . . . 65 = 0). What is surprising about Figure 3, however, is the precipitous decline in eigenvalue magnitude as eigenvalue rank exceeds three. The four largest eigenvlaues of the data account for 62.2% of the total variance in the data. This fact, in conjunction with the obvious gap between eigenvalues three and four suggests a high degree of redundancy among the topics. While some interclass redundancy is necessary (to accomodate multi-topic documents), this distribution reinforces the the agency’s assertion that the pre-existing categories were less than optimal.
3.
A HYBRID APPROACH TO TOPIC DISCOVERY
To aid in the discovery of a new set of high-level topics for the BLS website, we turned to unsupervised machine learning methods. In efforts to let the data speak for themselves,
In light of these problems, we take a hybrid approach to topic discovery. First, we limit the clustering process to a sample of the entire collection, described in Section 4. Working on a focused subset of the data helps to overcome problems two and three, listed above. To address the problem of mutual exclusivity of standard clusters, we combine unsupervised with supervised learning methods, as described in Section 5
4.
FOCUSING ON CONTENT-RICH DOCUMENTS
To derive empirically evidenced topics we initially turned to cluster analysis. Let A be the n × p data matrix with n observations in p variables. Thus aij shows the measurement for the ith observation on the j th variable. As described in [7], the goal of cluster analysis is to assign each of the n observations to one of a small number k mutually exclusive groups, each of which is characterized by high intra-cluster correlation and low inter-cluster correlation. Though the algorithms for accomplishing such an arrangement are legion, our analysis focuses on so-called k-means clustering1 , during which, each observation oi is assigned to the cluster ck whose centroid is closest to it, in terms of Euclidean distance. The model is fitted by minimizing the sum of squared error (sse), given in Equation 1: 1 We have focused on k-means as opposed to other clustering algorithms for several reasons. Chief among these is the computational efficiency enjoyed by the k-means approach. Because we need only a ”flat” clustering there is little to be gained by the more expensive hierarchical algorithms. In future work we may turn to model-based clustering [2], although k-means is identical to standard EM clustering subject to certain assumptions.
sse =
|k| K X X
= �xik − xk �2
(1)
k=1 i=1
where xik is the ith observation in the kth cluster, and xk is the centroid of the kth cluster. Medioid-based clustering by k-means is well-studied in the statistical literature, and has shown good results for text analysis (cf. [4, 11]). However, k-means clustering requires that the researcher specify k, the number of clusters to define. When applying k-means to our 15,000 document collection, indicators such as the gap statistic [13] and an analysis of the mean-squared distance across values of k, suggested that k ≈ 80 was optimal. This paramterization led to semantically intelligible clusters. However, 80 clusters are far too many for application to an interface such as the relation browser. Moreover, the granularity of these clusters was unsuitably fine. For instance, the 80-cluster solution derived a cluster whose most highly associated words (in terms of log-odds ratio) were drug, pharmacy, and chemist. These words are certainly related, but they are related at a level of specificity far below what we desired. To remedy the high dimensionality of the data, we resolved to limit the algorithm to a subset of the collection. In consultation with employees of the BLS, we continued our analysis on documents that form a series titled From the Editor’s Desk (http://www.bls.gov/opub/ted). These are brief articles, written by BLS employees. BLS employees suggested that we focus on the Editor’s Desk because it is intended to span the intellectual domain of the agency. The column is published daily, and each entry describes an important current issue in the BLS domain. The Editor’s Desk column has been written daily (five times per week) since 1998. As such, we operated on a set of N = 1279 documents. Limiting attention to these 1279 documents not only reduced the dimensionality of the problem. It also guaranteed that the clustering process learned on a relatively clean data set. While the entire BLS collection contains a great deal of non-prose text (i.e. tables, lists, etc.), the Editor’s Desk documents are all written in clear, journalistic prose. Each document is highly topical, further aiding the discovery of term-topic relations. Finally, the Editor’s Desk column provided an ideal learning environment because it is well-supplied with topical metadata. Each of the 1279 documents contains a list of one or more keywords. Additionally, a subset of the documents (1112) contained a subject heading. This metadata informed our learning and evaluation, as described in Section 6.1.
5.
COMBINING SUPERVISED AND UNSUPERVISED LEARNING FOR TOPIC DISCOVERY
To derive suitably general topics for the application of a dynamic interface to the BLS collection, we combined document clustering with text classification techniques. Specifically, using k-means, we clustered each of the 1279 documents into one of k clusters, with the number of clusters chosen by analyzing the within-cluster mean squared distance at different values of k (see Section 6.1). Construct-
ing mutually exclusive clusters violates our assumption that documents may belong to multiple classes. However, these clusters mark only the first step in a two-phase process of topic identification. At the end of the process, documentcluster affinity is measured probabilistically. Once the Editor’s Desk documents were assigned to clusters, we constructed a k-way classifier that calculates P (Ck |di ), the probability that a new document di is a member of class Ck . We tested three statistical classification techniques: probabilistic Rocchio (prind), naive Bayes, and support vector machines (SVMs). All were implemented using McCallum’s BOW text classification library [9]. Prind is a probabilistic version of the Rocchio classification algorithm [5]. Interested readers are referred to Joachims’ article for further details of the classification method. Like prind naive Bayes attempts to classify documents into the most probable class. It is described in detail in [10]. Finally, support vector machines were thoroughly explicated by Vapnik [14], and applied specifically to text in [6]. They define a decision boundary by finding the maximally separating hyperplane in a high-dimensional vector space in which document classes become linearly separable. Having clustered the documents and trained a suitable classifier, the remaining 14,000 documents in the collection are labeled by means of automatic classification. That is, for each document di we derive a k-dimensional vector, quantifying the likelihood that di belongs to each class C1 . . . Ck . Deriving topic scores for the entire 15 thousand-document collection thus requires only several minutes of CPU time. The output of this process is a score for every document in the collection on each of the automatically discovered topics. These scores may then be used to populate a relation browser interface, or they may be added to a traditional information retrieval system. In future work evaluation using both of these approaches will be undertaken.
6.
EVALUATION OF CONCEPT DISCOVERY
Prior to implementing a relation browser interface and undertaking the attendant user studies, it is of course important to evaluate the quality of the inferred concepts, and the ability of the automatic classifier to assign documents to the appropriate subjects. To evaluate the success of the two-stage approach described in Section 5, we undertook two experiments. During the first experiment we compared three methods of document representation for the clustering task. The goal here was to compare the quality of document clusters derived by analysis of full-text documents, documents represented only by their titles, and documents represented by human-created keyword metadata. During the second experiment, we analyzed the ability of the statistical classifiers to discern the subject matter of documents from portions of the database other the the Editor’s Desk.
6.1
Comparing Document Representations
Documents from The Editor’s Desk column came supplied with human-generated keyword metadata. Additionally, The titles of the Editor’s Desk documents tend to be germane to the topic of their respective articles. With such an array of distilled evidence of each document’s subject matter, we un-
dertook a comparison of document representations for topic discovery by clustering. We hypothesized that keywordbased clustering would probably provide useful clusters. But we hoped to see whether comparable performance could be attained by methods that did not require extensive human indexing, such as the title- or full-text representations. To test this hypothesis, we defined three modes of document representation—full-text, title-only, and keyword only—we generated three sets of topics, Tf ull , Ttitle , and Tkw , respectively. Topics based on full-text documents were derived by application of k-means clustering to the 1279 Editor’s Desk documents, where each document was represented by a 1908dimensional vector. These 1908 dimensions captured the TFIDF weights of each term ti in document dj , where all terms that occurred at least twice in the data were retained. To arrive at the appropriate number of clusters for these data, we inspected the within-cluster mean-squared distance for each value of k = 1 . . . 20. We found evidence of a decrease in error as k approached 10. To select a single integer value, we calculated which value of k led to the least variation in cluster size. This metric stemmed from a desire to suppress the common result where one large cluster emerges from the k-means algorithm, accompanied by several accordingly small clusters. Without reason to believe that any single topic should have dramatically high prior odds of document membership, this heuristic led to kf ull = 10. Clusters based on document titles were constructed similarly. However, in this case, each document was represented in the vector space spanned by the 397 terms that occur at least twice. Using the same method of minimizing the variance in cluster membership, ktitle , the number of clusters in the title-based representation was also set to 10. The dimensionality of the keyword-based clustering was very similar to that of the title-based approach. There were 299 keywords in the data, all of which were retained.The median number of keywords per document was also 7, where a keyword is understood to be either a single word, or a multi-word term such as ”consumer price index.” Using the keywords, the documents clustered into 10 classes. To evaluate the clusters derived by each method of document representation, we used the subject headings that were included with 1112 of the Editor’s Desk documents. Each of these 1112 documents was assigned 1 or more subject headings, which were withheld from all of the cluster applications. Our analysis began with the assumption that documents with the same subject headings should cluster together. To facilitate this analysis, we took a conservative approach; we considered multi-subject classifications to be unique. Thus if document di was assigned to a single subject prices, while document dj was assigned to two subjects, international comparisons, prices, documents di and dj are not considered to come from the same class. Table 6.1 shows all Editor’s Desk subject headings that were assigned to at least 10 documents. As noted in the table, there were 19 such subject headings, which altogether covered 609 (54%) of the documents with subjects assigned. These document-subject pairings formed the basis of our
Table 1: Top Editor’s Desk Subject Headings Subject Count prices 92 unemployment 55 occupational safety and health 53 international comparisons, prices 48 manufacturing, prices 45 employment 44 productivity 40 consumer expenditures 36 earnings and wages 27 employment and unemployment 27 compensation costs 25 earnings & wages, metro. areas 18 benefits, compensation costs 18 earnings & wages, occupations 17 employment, occupations 14 benefits 14 earnings & wage, regions 13 work stoppages 12 earnings & wages, industries 11 Total 609
Table 2: Contingecy Table for Three Document Representations Representation Right Wrong Accuracy Full-text 392 217 0.64 Title 441 168 0.72 Keyword 601 8 0.98
analysis. Limiting analysis to subjects with N > 10 kept the resultant χ2 tests suitably robust. The clustering derived by each document representation was tested by its ability to collocate documents with the same subjects. Thus for each of the 19 subject headings in Table 6.1, Si , we calculated the proportion of documents assigned to Si that each clustering co-classified. Further, we assumed that whichever cluster captured the majority of documents for a given class constituted the ”right answer” for that class. For instance, There were 92 documents whose subject heading was prices. Taking the BLS authors’ classifications as ground truth, all 92 of these documents should have ended up in the same cluster. Under the full-text representation 52 of these documents were clustered into category 5, while 35 were in category 3, and 5 were in category 6. Taking the majority cluster as the putative ”right” home for these documents, we consider the accuracy of this clustering on this subject to be 52/92 = 0.56. Repeating this process for each topic across all three representations led to the contingency table shown in Table 6.1. The obvious superiority of the keyword-based clustering evidenced by Table 6.1 was borne out by a χ2 test on the accuracy proportions. Comparing the proportion right and wrong achieved by keyword and title-based clustering led to p ≈ 0. Due to this result, in the remainder of this paper, we focus our attention on the clusters derived by analysis of the Editor’s Desk keywords. The ten keyword-based clusters
Table 3: Keyword-Based Clusters benefits costs international jobs plans compensation import employment benefits costs prices jobs employess benefits petroleum youth occupations prices productivity safety earnings prices productivity safety wages index output health pay inflation nonfarm occupational
are shown in Table 6.1, represented by the five terms most highly associated with each cluster, in terms of the log-odds ratio. Additionally, each cluster has been given a label by the researchers. Evaluating the results of clustering is notoriously difficult (cf [13]). In order to lend our analysis suitable rigor and utility, we made several simplifying assumptions. Most problematic is the fact that we have assumed that each document belongs in only a single category. This assumption is certainly false. However, by taking an extremely rigid view of what constitutes a subject—that is, by taking a fully qualified and often multipart subject heading as our unit of analysis—we mitigate this problem. Analogically, this is akin to considering the location of books on a library shelf. Although a given book may cover many subjects, a classification system should be able to collocate books that are extremely similar, say books about occupational safety and health. The most serious liability with this evaluation, then, is the fact that we have compressed multiple subject headings, say prices : international into single subjects. This flattening obscures the multivalence of documents. We turn to a more realistic assessment of document-class relations in Section 6.2.
6.2
Accuracy of the Document Classifiers
Although the keyword-based clusters appear to classify the Editor’s Desk documents very well, their discovery only solved half of the problem required for the successful implementation of a dynamic user interface such as the relation browser. The matter of roughly fourteen thousand unclassified documents remained to be addressed. To solve this problem, we trained a statistical classifier, as described above in Section 5. For each document in the collection di , this classifier gives a pi , a k vector of probabilities or distances (depending on the classification method used), where pik quantifies the strength of association between the ith document and the kth class. Estimating these associations from the Editor’s Desk data is difficult. Because we have only 1279 documents and 10 classes, the number of training documents per class is relatively small. In addition to models fitted to the Editor’s Desk data, then, we constructing a fourth model, supplementing the training sets of each class by querying the Google search engine (http://www.google.com) and applying naive Bayes to the augmented test set. For each class, we created a query by submitting the three terms with the highest log-odds ratio with that class. Further, each query was limited to the domain www.bls.gov. For each class we retrieved roughly up to 400 documents from Google (the actual number varied depending on the size of the result set returned
Table 4: Cross Validation Results for 4 Classifiers Method Av. Percent Accuracy SE Prind 59.07 1.07 Naive Bayes 75.57 0.4 SVM 75.08 0.68 Naive Bayes (augmented) 58.16 0.32
by Google). This led to a training set of 4113 documents in the ”augmented model,” as we call it below. To test the ability of each classifier to locate documents correctly, we first performed a 10-fold cross-validation on the Editor’s Desk documents. During each fold, 33% of the documents (i.e. 422) were withheld during model fitting. These 422 documents were then classified, and the total accuracy was computed for that run. Using this methodology, we compared the performance of the four classification models described above. Table 6.2 gives the results from cross validation. Although naive Bayes is not significantly more accurate for these data than the SVM classifier, we limit the remainder of our attention to analysis of its performance. Our selection of naive Bayes is due to the fact that it appears to work comparably to the SVM approach for these data, while being much simpler, both in theory and implementation. Cross validation on the augmented model appeared to decrease classification accuracy (accuracy= 58.16%). As we discuss below, however, augmenting the training set appeared to help generalization during our second experiment. The results of Table 6.2 are encouraging. However, the success of our classifiers on the Editor’s Desk documents that informed the cross validation study may not be good predictors of the models’ performance on the remainder to the BLS website. To test the generality of the naive Bayes classifier, we solicited input from 11 human judges who were familiar with the BLS website. The sample was chosen by convenience, and consisted of faculty and graduate students who work on the GovStat project. However, none of the reviewers had prior knowledge of the outcome of the classification before their participation. For the experiment, a random sample of 100 documents was drawn from the entire BLS collection. On average each reviewer classified 83 documents, placing each document into as many of the categories shown in Table 6.1 as he or she saw fit. Results from this experiment suggest that room for improvement remains with respect to generalizing to the whole collection from the class models fitted to the Editor’s Desk documents. In Table 6.2, we see, for each classifier, the number of documents for which it’s first or second most probable class was voted best or second best by the 11 human judges. In the context of this experiment, we consider a first- or second-place classification by the machine to be accurate because the relation browser interface operates on a multiway classification, where each document is classified into multiple categories. Thus a document with the ”correct” class as its second choice would still be easily available to a user. Likewise, a correct classification on either the most
Table 5: Human-Model Agreement on 100 Sample Docs. Human Judge 1st Choice Model Model 1st Choice Model 2nd Choice N. Bayes (aug.) 14 24 N. Bayes 24 1 nd Human Judge 2 Choice Model Model 1st Choice Model 2nd Choice N. Bayes (aug.) 14 21 N. Bayes 21 4
0.00
0.15
Human Classifications
jobs
prices
spending
costs
prices
spending
costs
30
40
jobs
Figure 5: Distribution of Classes Across Documents
10
20
Frequency
50
0.00
60
0.10
70
Machine Classifications
0
to complex digital library content (where documents will be classified along multiple categories), the augmented model is preferable. But this is not necessesarily the case in general. 0
1
2
3
4
5
6
7
Number of Human-Assigned Classes
Figure 4: Number of Classes Assigned to Documents by Judges popular or second most popular category among the human judges is considered correct, in cases where a given document was classified into multiple classes. There were 44 multiclass documents in our sample, as seen in Figure 4. The remaining 56 documents were assigned to 1 or 0 classes. Under this rationale, The augmented naive Bayes classifier correctly grouped 73 documents, while the smaller model (not augmented by a Google search) correctly classified 50. The p-value on the resultant χ2 test is p = 0.001, suggesting that increasing the training set improved the ability of the naive Bayes model to generalize from the Editor’s Desk documents to the collection as a whole. However, the improvement afforded by the augmented model comes at some cost. In particular, the augmented model is significantly inferior to the model trained solely on Editor’s Desk documents if we concern ourselves only with documents selected by the majority of human reviewiers—i.e. only first-choice classes. Limiting the ”right” answers to the left column of Table 6.2 gives p = 0.02 in favor of the non-augmented model. For the purposes of applying the relation browser
It must also be said that 73% accuracy under a fairly liberal test condition leaves room for improvement in our assignment of topics to categories. We may begin to understand the shortcomings of the described techniques by consulting Figure 5, which shows the distribution of categories across documents given by humans and by the augmented naive Bayes model. Interestingly, the majority of reviewers put documents into only three categories, jobs, benefits, and occupations. On the other hand, the naive Bayes classifier distributed classes more evenly across the topics. This behavior suggests areas for future improvement. Most importantly, we observed a strong correlation among the three most frequent classes among the human judges (for instance, there was 68% correlation between benefits and occupations. This suggests that improving the clustering to produce topics that were more orthogonal might improve performance.
7.
CONCLUSIONS AND FUTURE WORK
Many developers and maintainers of digital libraries share the basic problem pursued here. Given increasingly large, complex bodies of data, how may we improve access to collections without incurring extraordinary cost, and while also keeping systems receptive to changes in content over time. Data mining and machine learning methods hold a great deal of promise with respect to this problem. Empirical methods of knowledge discovery can aid in the organization and retrieval of information. As we have argued in this paper, these methods may also be brought to bear on the design and implementation of advanced user interfaces.
This study explored a hybrid technique for aiding information architects as they implement dynamic interfaces such as the relation browser. Our approach combines unsupervised learning techniques, applied to a focused subset of the BLS website. The goal of this initial stage is to discover the most basic and far-reaching topics in the collections. Based on a statistical model of these topics, the second phase of our approach uses supervised learning (in particular, a naive Bayes classifier, trained on individual words), to assign topical relations to the remaining documents in the collection. In the study reported here, this approach has demonstrated promise. In its favor, our approach is highly scalable. It also appears to give fairly good results. Comparing three modes of document representation—full-text, title only, and keyword—we found 98% accuracy as measured by collocation of documents with identical subject headings. While it is not surprising that author-generated keywords should give strong evidence for such learning, their superiority over full text and titles, was dramatic, suggesting that even small amount of metadata can be very useful for data mining. However, we also found evidence that learning topics from a subset of the collection may lead to overfitted models. After clustering 1279 Editor’s Desk documents into 10 categories, we fitted a 10-way naive Bayes classifier to categorize the remaining 14,000 documents in the collection. While we saw fairly good results (classification accuracy of 75% with respect to a small sample of human judges), this experiment forced us to reconsider the quality of the topics learned by clustering. The high correlation among human judgments in our sample suggests that the topics discovered by analysis of the Edtior’s Desk were not independent. While we do not desire mutually exclusive categories in our setting, we do desire independence among the topics we model. Overall, then, the techniques described here provide an encouraging start to our work on acquiring subject metadata for dynamic interfaces automatically. It also suggests that a more sophisticated modeling approach might yield better results in the future. In upcoming work we will experiment with streamlining the two-phase technique described here. Instead of clustering documents to find topics and then fitting a model to the learned clusters, our goal is to expand the unsupervised portion of our analysis beyond a narrow susbset of the collection, such as The Editor’s Desk. In current work we have defined algorithms to identify documents likely to help the topic discovery task. Supplied with a more comprehensive training set, we hope to experiment with Hyvarinen’s independent component analysis [3], a factor anlaytic matrix factorization that has shown promise for text mining applications. Topic discovery and document classification have long been recognized as fundamental problems in information retrieval and other forms of text mining. What is increasingly clear, however, as digital libraries grow in scope and complexity, is the applicability of these techniques to problems at the front-end of systems such as information architecture and interface design. Finally, then, in future work we will build on the user studies undertaken by Marchionini and Brunk in efforts to evaluate the utility of automatically populated dynamic interfaces for the users of digital libraries.
8.
REFERENCES
[1] M. Efron, G. Marchionini, and J. Zhang. Implications of the recursive representation problem for automatic concept identification in on-line governmental information. In Proceedings of the ASIST Special Interest Group on Classification Research (ASIST SIG-CR), 2003. [2] T. Hastie, R. Tibshirani, and J. Friedman. The Elements of Statistical Learning: Data Mining, Inference, and Prediction. Springer Series in Statistics. Springer, New York, 2001. [3] A. Hyvarinen, J. Karhunen, and E. Oja. Independent Component Analysis. Wiley Interscience, 2001. [4] A. K. Jain, M. N. Murty, and P. J. Flynn. Data clustering: a review. ACM Computing Surveys, 31(3):264–323, September 1999. [5] Thorsten Joachims. A probabilistic analysis of the Rocchio algorithm with TFIDF for text categorization. In Douglas H. Fisher, editor, Proceedings of ICML-97, 14th International Conference on Machine Learning, pages 143–151, Nashville, US, 1997. Morgan Kaufmann Publishers, San Francisco, US. [6] Thorsten Joachims. Text categorization with support vector machines: learning with many relevant features. In Claire N´edellec and C´eline Rouveirol, editors, Proceedings of ECML-98, 10th European Conference on Machine Learning, pages 137–142, Chemnitz, DE, 1998. Springer Verlag, Heidelberg, DE. [7] Leonard Kaufman and Peter J. Rosseeuw. Finding Groups in Data: an Introduction to Cluster Analysis. Wiley, 1990. [8] G. Marchionini, S. Haas, C. Plaisant, B. Shneiderman, and C. Hert. Toward a statistical knowledge network. In Proceedings of the National Conference on Digital Government Research, pages 27–32, Boston, 2003. National Science Foundation. [9] Andrew Kachites McCallum. Bow: A toolkit for statistical language modeling, text retrieval, classification and clustering. http://www.cs.cmu.edu/ mccallum/bow, 1996. [10] T. Mitchell. Machine Learning. McGraw Hill, 1997. [11] E. Rasmussen. Clustering algorithms. In W. B. Frakes and R. Baeza-Yates, editors, Information Retrieval: Data Structures and Algorithms, pages 419–442. Prentice Hall, 1992. [12] G. Strang. Linear Algebra and its Applications. International Thompson Publishing, 1988. [13] R. Tibshirani, G. Walther, and T. Hastie. Estimating the number of clusters in a dataset via the gap statistic, 2000. [14] V. N. Vapnik. The Nature of Statistical Learning Theory. Springer, 2000.