Remote Sens. 2014, 6, 8261-8286; doi:10.3390/rs6098261 OPEN ACCESS
remote sensing ISSN 2072-4292 www.mdpi.com/journal/remotesensing Article
Mapping Banana Plants from High Spatial Resolution Orthophotos to Facilitate Plant Health Assessment Kasper Johansen 1,*, Malte Sohlbach 2, Barry Sullivan 3, Samantha Stringer 3, David Peasley 4 and Stuart Phinn 1 1
2
3
4
Biophysical Remote Sensing Group, School of Geography, Planning and Environmental Management, The University of Queensland, Brisbane, QLD 4072, Australia; E-Mail:
[email protected] Trimble Geospatial, Arnulfstrasse 126, Munich 80636, Germany; E-Mail:
[email protected] Australian Banana Growers’ Council Inc., South Gate East Commercial Centre, 250 Sherwood Road, Rocklea, QLD 4106, Australia; E-Mails:
[email protected] (B.S.);
[email protected] (S.S.) Peasley Horticultural Services, P.O. Box 542 Murwillumbah, NSW 2484, Australia; E-Mail:
[email protected]
* Author to whom correspondence should be addressed; E-Mail:
[email protected]; Tel.: +61-7-3346-7016; Fax: +61-7-3365-6899. Received: 31 March 2014; in revised form: 21 August 2014 / Accepted: 22 August 2014 / Published: 2 September 2014
Abstract: The Banana Bunchy Top Virus (Genus: Babuvirus) reduces plant growth and prevents banana production. Because of the very large number of properties with banana plants in South East Queensland, Australia, a mapping approach was developed to delineate individual and clusters of banana plants to help plant identification and enable prioritization of plant inspections for Banana Bunchy Top Virus. Due to current outbreaks in South East Queensland, there are concerns that the virus may spread to the major banana growing districts further north. The mapping approach developed was based on very high spatial resolution airborne orthophotos. Object-based image analysis was used to: (1) detect banana plants using edge and line detection approaches; (2) produce accurate and realistic outlines around classified banana plants; and (3) evaluate the mapping results. The mapping approach was developed based on 10 image tiles of 1 km × 1 km and was applied to orthophotos (3600 image tiles) from September 2011 covering the entire Sunshine Coast Region in South East Queensland. Based on field inspections of the classified maps,
Remote Sens. 2014, 6
8262
a user’s mapping accuracy of 88% (n = 146) was achieved. The results will facilitate the detection of banana plants and increase the inspection rate of Banana Bunchy Top Virus in the future. Keywords: banana plants; Banana Bunchy Top Virus; orthophotos; high spatial resolution; object-based image analysis; eCognition
1. Introduction While banana cultivation has a long history, the Banana Bunchy Top Virus (BBTV) was first documented in Fiji in 1889, where it significantly affected banana production [1]. BBTV is a circular single-stranded DNA virus that causes the Bunchy Top disease in bananas. The virus has been assigned to the Nanoviridae family in the genus Babuvirus [2]. BBTV was introduced into Australia in planting material from Fiji in 1913. During the 1920s and 1930s BBTV devastated the banana industry in state of New South Wales, Australia, but at the same time a considerable effort was put into BBTV research to effectively control the disease [1]. Banana plants can only be infected from (1) infected plant material and (2) the banana aphid when carrying the virus [3]. When people give away young banana plants or suckers to others the BBTV can spread. The aphid is a small black insect that, once feeding on an infected banana plant, becomes a carrier of the BBTV. The wind can carry aphids many kilometres, which may result in further spreading the BBTV. Hook et al. [3] showed that the incubation period of BBTV or appearance of symptoms in banana plants ranged from 25 to 85 days after aphid inoculation. No outbreaks of BBTV have been identified in North Queensland, Australia since a single outbreak in a plantation near Innisfail in 1954. More than 90% of Australia’s banana production takes place in North Queensland [4]. While the movement of bananas and control of BBTV is still under official regulation, the responsibility of detecting BBTV is increasingly left to the banana growers. The diagnosis of BBTV is generally performed by visual inspection of the symptoms of the infection. Symptom-bearing leaves develop dark green streaks of variable length in the leaf veins, midribs and petioles. Leaves become progressively dwarfed and develop marginal chlorosis or yellowing. As the disease develops, the leaves become more upright and crowded or bunched at the apex of the plant [1]. Plant growth is stunted and the production of bananas will significantly decrease or stop once a banana plant becomes infected. Infected banana plants cannot recover from the disease and new suckers will also be infected [3]. Once BBTV is detected, the only way to get rid of it is by destroying the infected banana plant. This is done by injecting the infected banana plant with (1) systemic insecticide to prevent aphids from spreading to other plants and (2) glyphosate to destroy the plant. Bio Pest Oil is also used to suppress aphid activity and prevent aphids from flying from the infected banana plants [5]. BBTV is currently present in New South Wales and in South East Queensland, with the Sunshine Coast in Queensland being the northern most point of detection at present. It is essential to prevent the spread of BBTV to the major banana growing areas in Queensland, such as Tully and Innisfail, which would have significant economic consequences for the Australian banana industry. The annual
Remote Sens. 2014, 6
8263
farm gate value of banana production in Australia is approximately AU$450 million, making it the largest horticulture industry in Queensland [4]. In South East Queensland there are many backyard growers over a large area, which make inspection of banana plants and identification of BBTV very time-consuming and labour-intensive. Cook et al. [6] used a simulation model to estimate the likely benefits of exclusion of the BBTV from commercial banana plantations over time relative to a nil management scenario in which no surveillance or containment activities take place. A range of possible future incursion scenarios showed that the disease exclusion would prevent annual losses of AU$15.9–27.0 million for the Australian banana industry, and that improvements in disease surveillance and incursion response will greatly enhance future cost benefits. The Queensland Government collects very high spatial resolution aerial orthophotos on a regular basis over urban and peri-urban areas of South East Queensland. These orthophotos represent a potential means of detecting individual and clusters of banana plants over large areas on an annual basis. The development of a mapping approach for automatic detection and delineation of banana plants from very high spatial resolution orthophotos may facilitate the detection of banana plants and increase the inspection rate of BBTV by targeting field based searches and inspections of banana plants, especially in the vicinity of areas where plants with BBTV have been detected, as the neighbouring areas are more likely to be infected. In response to the threat of BBTV to the Australian banana industry, the National Banana Bunchy Top Project was established in 2009. The project is administered through the Australian Banana Growers’ Council, using funds from compulsory grower levies, which are matched by funding from the Federal Government through Horticulture Australia Limited, to eradicate BBTV from commercial plantations, backyard banana plants and feral banana plants. This research was part of the National Banana Bunchy Top Project, to develop a mapping approach for detection and delineation of banana plants. Specifically, the objective of this research was: To develop a mapping approach using object-based image analysis to map banana plants within 10 selected 1 km × 1 km tiles using existing very high spatial resolution orthophotos and apply the approach to the whole Sunshine Coast Regional Council area (~3100 km2). No automatic mapping approach currently exists for mapping individual banana plants and clusters of banana plants. 2. Study Area The study area was located in the Sunshine Coast Region, Queensland, Australia (Figure 1) and included 10 tiles each covering 1 km × 1 km (Figure 2). The Sunshine Coast Region is located north of Brisbane and contains residential and semi-rural areas that have experienced rapid population growth over the last decades. Small tropical fruit farms, including banana farms, exist on the Sunshine Coast. However, the majority of banana plants are found in backyards. The 10 orthophoto tiles selected for this research represented a number of different environments from rural to high density urban areas (Figure 2).
Remote Sens. 2014, 6 Figure 1. The study area on the Sunshine Coast (yellow outline), Queensland, Australia.
8264
Remote Sens. 2014, 6
8265
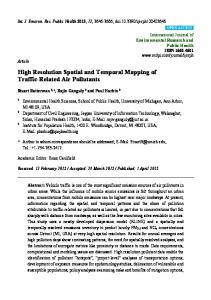
Figure 2. Ten selected orthophoto tiles in the Sunshine Coast Region represented as true colour composites each covering 1 km × 1 km. (a,b) area around Kin Kin; (c–e) area around Nambour; (f,g) area around Buderim; and (h–j) area around Beerwah. Coordinates represent the approximate centre of each image tile. (a)
152°53ʹ40ʺE,26°15ʹ05ʺS
(b)
100 50 0
100 Meters
(d)
152°56ʹ05ʺE,26°38ʹ20ʺS
100 50 0
100 Meters
100 Meters
152°56ʹ40ʺE,26°38ʹ20ʺS
100 50 0
100 Meters
100 50 0
100 Meters
152°55ʹ30ʺE,26°51ʹ55ʺS
152°59ʹ05ʺE,26°38ʹ20ʺS
100 50 0
100 Meters
100 50 0
100 Meters
100 50 0
100 Meters
(f)
100 50 0
100 Meters
153°05ʹ10ʺE,26°41ʹ05ʺS
(i)
(h)
(j)
152°56ʹ05ʺE,26°49ʹ10ʺS
100 50 0
(e)
(g)
153°02ʹ05ʺE,26°41ʹ35ʺS
152°52ʹ30ʺE,26°15ʹ35ʺS
(c)
100 50 0
100 Meters
152°56ʹ05ʺE,26°51ʹ20ʺS
Remote Sens. 2014, 6
8266
3. Data and Methods 3.1. Image and Field Data Ten orthophoto tiles each covering 1 km × 1 km were selected for this research project from a total of 3600 tiles covering the whole of the Sunshine Coast Region. The 10 tiles, selected to represent the majority of landscape variation on the Sunshine Coast, were captured between 10 and 16 September 2011 and consisted of four multi-spectral bands with 0.10 m pixels located in the blue, green, red and near infrared (NIR) part of the spectrum. The 10 tiles all had a large number of banana plants or clusters of banana plants, occurring within different types of urban, peri-urban and semi-rural environments typical for the Sunshine Coast Region. In addition, the 10 tiles were also selected because BBTV had been detected within these tiles and there was an interest in identifying other banana plants in the vicinity of those infected banana plants. GPS recordings of banana plant locations were collected on the 16 October 2012 through an initial inspection of several properties in the Sunshine Coast Region, including one of the 10 image tiles, and used for calibration purposes for the development of the mapping approach. Forty-two sites with banana plants were visited for calibration purposes. A two-day field campaign was carried out on 25 and 26 March 2013 to collect independent validation data to assess if the banana plants identified in the remaining nine orthophotos were banana plants, and if the method used for mapping banana plants had omitted any banana plants. This was done once the maps of delineated banana plants had been completed. To provide an understanding of why some banana plants were omitted with the existing mapping approach, omission errors were assessed by systematic door-knocking to inspect all properties along the streets within four of the 10 selected image tiles (two tiles in Kin Kin and two tiles in Buderim). In addition to the four image tiles systematically assessed, 97 out of 134 of those banana plant sites delineated in the five remaining orthophotos used for validation were inspected to assess the presence of banana plants. A total of 164 sites with banana plants were visited for validation purposes within the nine image tiles. One hundred and forty-six out of 183 sites (80% of sites) mapped with banana plants were checked in the field. Access constraints prevented 37 mapped banana plant sites from being checked in the field. A GPS receiver was used to record a single point based location of all 164 identified sites with banana plants to an accuracy within 3 m. The extent of banana plants at each site varied from approximately 1 m2 (single dwarf plant) to 3000 m2 (small plantation). In the majority of cases, a cluster of less than 20 banana plants were found at each location, with the exception of three small plantations and 11 clusters of banana plants varying in sizes from approximately 200–500 m2. Banana plants that were identified in the field, but could not be visually identified in the orthophotos and could not be determined to have an age of more than 1.5 years, were omitted from the accuracy assessment because of the 1.5 year time gap between the capture date of the orthophotos and the field validation campaign. Classification accuracies were calculated based on the collected independent field data. 3.2. Initial Evaluation of Banana Plant Detection and Delineation Approaches Most tree crown detection and delineation algorithms are based on two distinct spectral properties of tree crowns and their representation in high spatial resolution image data: (1) the association of
Remote Sens. 2014, 6
8267
a tree apex with a local maximum image brightness value; and (2) delineation of the crown boundary by local minima brightness values [7]. One of the most fundamental assumptions of crown delineation algorithms is that the centre of a crown appears radiometrically brighter than the edge [8,9] due to the more direct illumination of the crown peak [10]. The valley-following approach (local minima approach) was developed in Canada [11] based on delineation of tree crown boundaries by finding the shaded parts between the tree crowns, which appear to have low brightness values [12]. Quackenbush et al. [13] found canopy illumination and background effects to significantly reduce mapping accuracies of conventional pixel-based classifications of individual trees, especially in highly heterogeneous landscapes such as urban areas [14]. Hence, object-based image analysis is now considered more appropriate for single tree classification because of the added information available using objects [15]. Bunting and Lucas [16] used an object-based image analysis approach to delineate tree crowns of mixed species and achieved accuracies between 48% and 88%. Their approach did also look for object maxima as seeds for tree crown identification with subsequent expansion from the seed location to the edges of the tree crowns and clusters. However, these tree crown delineation and object-based approaches were not found suitable for the delineation of individual and clusters of banana plants because the banana plants’ structure, composition and leaf shape, which prevent the detection of a sunlit apex. Leaves are spirally arranged and may grow up to 3 m long and about 0.60 m wide (Figure 3a). As leaves are easily torn by the wind, the leaves often appear with a frond look (Figure 3b). This causes some parts of the leaves to be sunlit and other parts to be shaded (Figure 3a,b), and hence reducing the ability to use spectral information for the detection of banana plants. Hence the main focus of the detection of banana plants was on the leaf shape and length and the contrast between the leaves/leaf shadows and the ground. As most banana plants are 10%; b. The difference of the mean Blue, Green, Red and NIR values between two neighbouring objects were