a GuangxiâASEAN Marine Research Center, Guangxi Academy of Sciences, 98 Da Ling ... Landsat-7 ETM+ multispectral images of different dates and spatial ...
MAPPING BATHYMETRY FROM MULTI-SOURCE REMOTE SENSING IMAGES: A CASE STUDY IN THE BEILUN ESTUARY, GUANGXI, CHINA Zhongwei Deng b, Minhe Ji a, b, *, Zhihua Zhang b a
Guangxi–ASEAN Marine Research Center, Guangxi Academy of Sciences, 98 Da Ling Road, Nanning, China The Key Lab of GIScience, Chinese Ministry of Education, East China Normal University, 3663 North Zhongshan Road, Shanghai 200032, China-(mhji)@geo.ecnu.edu.cn
b
KEY WORDS: Bathymetry Mapping, Remote Sensing, Reflectance Ratio, Coastal Estuary, Seabed Terrain, QuickBird
ABSTRACT: This article examines several major bathymetry mapping methods and describes an experimental procedure of determining seabed bathymetry from multi-source passive remote sensing data. Issues to be addressed include how to deal with less desirable spectral data quality and the absence of in-situ water depth measurements. A case study was presented using DigitalGlobe QuickBird and Landsat-7 ETM+ multispectral images of different dates and spatial resolutions to determine water depth for the Beilun Estuary, China. The preliminary results have led to three findings. First, it was feasible to use the tidal water line derived from the nearinfrared bands as a good approximation of water surface when observed tidal data is absent. Second, the reflectance ratio transform model developed by Stumpf et al. was proven suitable for spectrally-based water depth estimation when in-situ data is absent. Finally, the data quality problem caused by thin clouds could be effectively removed by fusing remote sensing images of two different sources.
1. INTRODUCTION Shallow water bathymetry is important for seabed morphology studies, environmental research, and resource management of coastal zones. Conventional approaches to bathymetry mapping rely on field surveys of water depth at sampled locations. Such approaches are however characterized as being labor-intensive and time-consuming (Liu et al. 2003). Moreover, it is often difficult to achieve the desired mapping accuracy just based on a limited number of sampled points. On the other hand, the state-of-the-art mapping approaches include using ship-borne underwater dragging sonar to record returned sounding signals in a fixed time interval for extensive water depth measurements (Li et al. 2004). This advanced approach can accurately depict the underwater terrain and suitable for marine engineering design and construction, but its high cost makes it less accessible for generic low-budget research projects with lower accuracy requirements. Ever since the 1970s, satellite remote sensing technology has been gradually adopted as an alternative to minimize field work for clear water bathymetry mapping. The synoptic view, easy access, and dynamic nature have made the remote sensing approach a rather cost-effective way to provide quick solutions to bathymetry mapping for studies of the fast-changing coastal environment. 1
The ability of light to penetrate the water body provides a physical basis for modeling water depth from remote sensing spectral data. Specific models, however, can be diverse in their structures and constructions. One group of models is based on the transmission equation of electromagnetic radiation in water. By measuring the optical parameters within the water body, water depth can be computed through a theoretical model. Using a two-stream assumption, for instance, Lyzenga (1979) simplified the classical irradiation equation by neglecting the attenuation effect of water body and obtained the relationship between water-leaving radiant energy and water depth. These * Corresponding author
models, however, require a complex estimation for a number of water column reflectance parameters, some of which can be very difficult to obtain; they thus are not widely used in practical water depth mapping (Wang et al. 2007a). Another group is empirical models based on the statistical relationship between pixel values and field-measured water depth. These models require no reflectance parameters of the water column and are simplistic in their development; therefore, they are widely applied in many case studies. For example, Lyzenga (1978, 1981) assumed that there existed a linear relationship between water depth and a linear combination of the logarithmic radiant intensity and achieved a good water depth estimation from one of the new variables resulting from a principal component analysis. Zhang (1998) compared equations constructed through different arrangements of spectral values and water depths from four data subsets of satellite imagery and digital bathymetry. He reported to be able to bring down the relative errors of the estimated water depth from 37% to 17% by calibrating the initial model using an nonlinear, exponential function. Wang et al. (2007b) experimented to model the relationship between Landsat-7 ETM+ and in-situ water depth measurements through a momentum BP artificial neural network, and their case study indicated that the ANN model was capable of handling non-linearity inherent in the data for better results. However, statistical models are usually developed for specific study areas, and the assumption about the existence of correlations between in-situ water depth and remote sensing data may not hold. This often leads to less desirable estimations and the derived models less transferable. The third group of methods integrates the merits of both theoretical and statistical models by simplifying the former through the use of statistical regression to estimate the photochemical parameters. The existing methods include bottom-albedo based single-band models and multi-band ratio models, as more commonly seen in the studies outside China (Wang et al. 2007a). The initial single-band model assumes an ideal situation with vertical homogeneity for water body’s
1321
The International Archives of the Photogrammetry, Remote Sensing and Spatial Information Sciences. Vol. XXXVII. Part B8. Beijing 2008
photochemistry, high and invariable bottom albedo, and shallow water (Polcyn et al. 1969, 1973). Although rarely found in reality, this theoretical model laid an important framework for further development. Under the assumption of no variability of bottom albedo in relation to bottom composition, Brown (1971) achieved higher accuracy of water depth mapping by taking the ratio between two bands to minimize the bottom effects. Holding water quality and atmospheric conditions constant, Philpot (1989) discussed the effects of incrementing the number of influencing factors for water depth mapping, including bottom composition and water types. The results indicated that spectral analysis alone became increasingly unreliable when increasing the level of model complexity, unless ancillary data such as spatiotemporal data of the image can be also incorporated. The most significant progress in this research direction was made by two individuals in their efforts to minimize the use of in-situ data for light attenuation coefficients in water columns. Christian (2001) explored the estimation of the attenuation coefficients using only water levels present on multi-temporal images in reference to simultaneous sea level observations, and obtained absolute water depth directly from remote sensing images. On the other hand, Stumpf et al. (2003) was able to reduce five standard coefficients down to two for bathymetry mapping by developing a reflectance ratio model based on the variable radiant absorptivity among spectral bands, and the calibration of the model only required a few water depth points from nautical charts. With the advantages of minimum requirement for in-situ data and robustness in handling complex bottom types, this model has been developed into a commercially available software module by ENVI™. This study considers three practical issues in shallow water bathymetry mapping. First, as depth modeling from remote sensing imagery requires sufficient water clarity, bottom type homogeneity, and good atmospheric conditions, in practice these ideal conditions are rarely existent simultaneously. This study used remote sensing data acquired from two sources and dates to compensate the unevenness of data quality. Second, insitu water depth data can sometimes be difficult or even impossible to acquire for a project at hand. This is particularly true when we dealt with a politically sensitive region located between two countries in this study. For this we adopted the reflectance ratio model by Stumpf et al. to minimize field measurements. Third, tidal effects also need to be accounted for since image data can only describe water depth at the very moment when the orbital sensor passed over. In this study we used samples from a nautical chart for the tidal calibration.
2. METHODOLOGY 2.1 Study Area The Berlun Estuary is located in the southwest region of the Guangxi province, China, with a greater region involved in this study ranging from 107°51′ to 108°12′ E longitude and from 21°25′ to 21°40′ N latitude (Fig. 1). Serving as an international border between China and Vietnam, the Beilun River has Dongxing, China on its north bank, Henin-Hardenne, Vietnam on its west bank, and its water discharged into the vast Beibu Gulf of South China Sea. The trumpet-shaped estuary has a width of 6 km and a water area of about 66.5 km2, 37.4 km2 of which are inter-tidal beaches, and with the under-tide and shallow water area of 29.1 km2 (Chen and Qiu, 1999). As a coastal region of Guangxi with high precipitation and open to
the vast water of the sea, the estuary is strongly influenced by hydrological dynamics from both the river and the ocean. The estuary has been experiencing rapid and constant morphological changes, leading to the formation of a highly complex seabed terrain. One big issue relating to the environmental change of the area is the northward migration of the thalweg at the river mouth over the past several decades. This migration was caused by the long-time collapse of bank soils and beaches being washed away on the northern side of the Beilun estuary, which in turn resulted from the river and ocean dynamics as well as the increasing intensity of human activities in the region. The bathymetry mapping project is part of the effort to build an inventory of natural resources and manage the tropical ecosystem in the region, as well as providing important theoretical parameters and scientific basis for the thalweg monitoring and related decision making.
Figure 1. The study area is located in the south coast of China
2.2 Spectral and Ancillary Datasets The major datasets selected for this study included two remote sensing images, with each from a different space-borne sensor system, and one 1:25,000-scale nautical chart. One image was QuickBird multispectral data acquired on 11-03-2003. With four spectral bands (3 visible and 1 near infrared) and a spatial resolution of 2.44 m, this dataset was deemed suitable for highprecision bathymetry extraction. The primary evaluation of the QuickBird data revealed that although the overall quality of the image was good, there existed some thin cloud over the lower portion of the image (Fig. 2a). That formed the reason for looking into other sources for supplementary data. The second image was a Landsat-7 ETM+ dataset acquired on 11-06-2000 with seven spectral bands and excellent data quality, yet a 30-m spatial resolution. Due to budget constraints and data availability, this was the only choice for this project. The nautical chart contained bathymetric lines in a 5-m interval, which were used as a surrogate for the field-measured water depth for image tidal correction.
1322
The International Archives of the Photogrammetry, Remote Sensing and Spatial Information Sciences. Vol. XXXVII. Part B8. Beijing 2008
2.3.2 Geometric Correction: Images from both sources were first rectified to a set of ground control points derived from large-scale topographic maps of the study area and then transformed to the Universal Transverse Mercator projection with the WGS84 datum. The ground control points were carefully selected and fine-tuned to manage the final error down to below half of the image pixel. The relative error between the two images after image-to-image registration was kept down to ±15 meters.
a. QuickBird (band 4, 3, 2)
b. Landsat ETM+ (band 4, 3, 2)
Figure 2. Multipspectral images of the study area (the Beilun Estaury) located along the land-water interface of Beihai Gulf 2.3 Data Preparation Several steps were involved in the preparation of the spectral and bathymetric data for water depth mapping. They included atmospheric correction, geometric correction, tidal correction, and the extraction of bathymetric values from the nautical chart and the corresponding pixel values from both images. A detailed discussion is provided below. 2.3.1 Atmospheric Correction: The atmospheric correction is based on the algorithm developed by Gordon et al. (1983) and by Stumpf and Pennock (1989) for several remote sensors, including Coastal Zone Color Scanner, Advanced Very High Resolution Radiometer, and Landsat Thematic Mapper. In this model, the reflectance of water, Rw, of a particular spectral band is defined as
Rw =
πLw (λ ) Ed (λ )
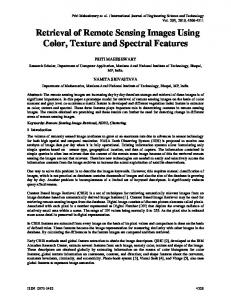
2.3.3 Tidal Correction: Both the QuickBird image and the ETM+ image recorded the water depth of the particular moments when the respective orbital sensors passed over the study area, whereas the water depth marked on the nautical chart was already corrected to the theoretical sea level datum of China (i.e. 1956 Huanghai Mean Sea Level). Therefore, the image-induced water depth needs to be standardized to the same datum. With no sea level observation station in the study area and other sources for tidal correction parameters, an alternative and indirect approach was used in this study. By taking the advantage of close to total absorption of near infrared energy in clear water, the water-land interface was demarcated using the near infrared band of each image for its acquisition date and time. Specifically as shown by the case of land-to-water spectral profiling in Fig. 3, the reflected energy drops rapidly when moving from land to water along the profile in comparison to the reflected red and green energy, forming a sharp tonal contrast between water and land on the image. Therefore, the value of the turning point on the spectral curve of the profile was matched to the water depth value measured at the same location on the nautical chart for tidal correction. The addition of the offset value to the image-induced water depth resulted in the standardized water depth for the satellite’s passing-over time for both images.
(1) Band2
Where
Lw = the water-leaving radiance Ed = the down-welling irradiance entering the water λ = the wavelength of the spectral band Rw = found by correcting the total reflectance RT for the aerosol and surface reflectance, as estimated by the near-IR band, and for the Rayleigh reflectance Rr. This can be expressed as
Rw = RT (λi ) − Y (λIR ) − Rr (λi ) Where
Band3 Band4
a. Location of the profile change
(2)
i = denote visible bands IR = near-infrared band Y = the constant to correct for spectral variation and depends on aerosol type.
In this study, the correction presumes a maritime atmosphere with a spectral variation similar to that of the water surface specular reflectance. This assumption is reasonable for the ETM+ data as well as the portion of the QuickBird data with no cloud cover. Water vapors with large diameters might require a separate aerosol correction. Since we intended to replace the bad portion of the QuickBird data with the ETM+ data, this rather complex atmospheric correction procedure was not performed.
b. patterns of pixel value
Figure 3. A land-to-water spectral profile, showing the pixel value change in different bands with the change of distance 2.3.4 Water Depth Extraction Model: Water absorptivity varies spectrally from band to band. As the depth increases, the reflected irradiance decreases faster in the high-absorptivity spectral band (e.g. green band) than in the low-absorptivity band (e.g. blue band). Based on that, Stumpf et al. (2003) developed a reflectance ratio model as follows.
1323
Z = m1
ln(nRw (λi )) − m0 ln(nRw (λ j ))
(3)
The International Archives of the Photogrammetry, Remote Sensing and Spatial Information Sciences. Vol. XXXVII. Part B8. Beijing 2008
Where Rw(λi) and Rw(λj) = the atmospherically-corrected pixel value for bands i and j m1 = a tunable constant to scale the ratio to depth n = a fixed constant, mainly for ensuring a positive value after the log transform and a linear response between the ratio and the depth m0 = an offset value when Z = 0 In the ratio model, only two parameters (i.e. m0 and m1) need to be estimated. Procedurally, we first corrected the tidal effect on the remotely sensed data to the bathymetric datum, then computed for blue and green bands the averages of the pixel values of along the 0-m and -5-m bathymetric lines, which were input into the model to estimate equation coefficient m1 and constant m0. These parameters were further fine-tuned for producing better matches between the model output (Z) and the sampled in-situ data until the root mean squared error (RMSE) of the model was managed down to an acceptable level.
The effectiveness of the data fusion was further evaluated by applying simple correlation analyses to the water depth data for the cloud-covered and no-cloud regions, respectively. The two regions were identified using a cloud mask developed directly from the QuickBird image. The analytic results revealed a sharp contrast between the two regions. The correlation coefficient for the no-cloud region is 0.74, compared to 0.26 for the cloudcovered region. Therefore, water depths derived from spectral data under a cloudy condition were proven unreliable, and their replacement by quality data of a different source or time became necessary. Water depth maps after data fusion were shown in Fig. 5. The morphology of the seabed in the estuary can be clearly seen on the maps of different scales. Yet the larger scale (i.e. 1:10,000) map revealed some artifacts with a regular texture, seeming as a result of the pixel size. Although not done in this study, presumably these artifacts could be removed through a spatial filter.
2.3.5 Fusion of QuickBird and Landsat ETM+ data: As mentioned earlier, the reason for using two spectral images of different sensors was due to the data quality and data availability problems. The high-resolution QuickBird data provided a great base image for large-scale bathymetry mapping, but the lower left portion of the image suffered from cloud covers. In the absence of another image with comparable resolution, we found the high-quality, medium-resolution ETM+ image a suitable supplement for this study. The fusion of the two spectral datasets was conducted in the following steps. The water depth was first derived from each of the images following the procedure discussed in sections 2.3 and 2.4. This resulted in two digital bathymetry maps of the different times. These two depth maps were then overlaid and analyzed to explore their co-variability (Fig. 4). A profile was constructed across the study area, deliberately crossing the area with no cloud and the area with thin cloud. The profile plot (Fig. 4b) indicated that there was a close match on the first part of the profile between the two derived water depths until it reached the 170th pixels along the profile. This 170th pixel is exactly the break point between the no-cloud region and the cloud-covered region. This suggested that in the region where there was no cloud cover, the water depth patterns produced from both the QuickBird and ETM+ images were comparable to each other. In other words, it was reasonable to replace the cloud-covered portion of the QuickBird-induced water depths with the corresponding ETM+ results.
a. Profiling of the overlain water depth images
b. Covariablity of water depth along the profile
Figure 4. Overlay of water depths induced from the two multispectral images for covariability analysis
1:10,000
1:100,000 Figure 5. Water depths mapped from QuickBird, with a lower left portion being replaced by the ETM+ induced results
3. DISCUSSION AND CONCLUSION The remote sensing approach demonstrated in this study was proven effective for clear, shallow water bathymetry mapping. This is especially true when the study area is inaccessible for field data collection, such as the case in the Beilun estuary. Two biggest challenges identified in this article were lack of in-situ data and uneven quality of spectral data within the same image. This study evaluated existing computer-based models that utilize multi-date remote sensing data to compensate the lack of field data for model calibration and verification. The model implemented in the study required only two parameters to be estimated, and thus greatly reduced the constraints for large amount of field data. It proved feasible when it was possible to correct tidal effects on images of different dates, and this correction was done by deriving a few bathymetric values from a nautical chart. The study also investigated strategies of using spectral data from different sources or dates to alleviate the atmospheric effects on remote sensing imagery of tropical and subtropical regions. The degree of success was proven largely depending on the comparability of images in terms of spatial and spectral resolutions. The Quickbird and ETM+ used in this study are compatible in spectral resolution for bathymetry
1324
The International Archives of the Photogrammetry, Remote Sensing and Spatial Information Sciences. Vol. XXXVII. Part B8. Beijing 2008
mapping, but their spatial resolutions are too much far apart. Although the resultant water depths had a good correlation between ETM+ and Quickbird, replacing a 2.44-m water depth data with that of 30 m could greatly degrade the precision and subsequently downplay the usefulness of the final product. Scrutiny of the derived water depth values along the profile in Fig. 4b reveals that the two curves do not match with each other really well even for the no-cloud portion of the study area. While both curves have the similar trend, the QuickBird results seem to always overstep the ETM+ results in both low and high values. This phenomenon might be caused largely by the difference of spatial resolution as well as, to a lesser degree, possible morphological changes due to the large time interval (i.e. three years) between the images. In the first case, morphological details that were captured by the high-resolution QuickBird sensor might have been averaged into a single, lower-resolution pixel of ETM+, so that the peaks and valleys on the QuickBird curve were flattened towards their opposite directions. This implies that it is important to acquire remote sensing data with compatible spatial resolutions if consistency and high precision are required in bathymetry mapping. The bathymetry mapping approach introduced in this study still needs more rigorous field verification and further improvement. The model could be further adjusted using field measurements with a finer magnitude for better results. Since the primary purpose of this study was to build a GIS database for a longterm monitoring of the coastal environment in the region, collecting and analyzing remote sensing data and ancillary data for land and water characterization will be a continuous effort. This will allow us to re-evaluate the approach and procedure presented in this study and search for better solutions.
REFFERENCES Brown, W.L., Polcyn, F.C., and Stewart, S.R, 1971. A method for calculating water depth, attenuation coefficients, and bottom reflectance characteristics in proceedings. Seventh International Symposium on Remote Sensing of the Environment, pp. 663-680. Chen B. and Qui S., 1999. Dynamic background of riverbed erosion in the Beilunhe estuary. Guangxi Sciences, 6(4), pp.317-320. Di, K., 1999. Shallow water depth extraction and chart production from ETM+ image in Nansha islands and nearby sea area. Remote Sensing for Land & Resources, 41(3), pp. 59-64. Li, W., Hu, P., Xiao, D., Liu, C., 2004. The application of the multibeam sounding to the marine engineering exploration. Geophysical & Geochemical Exploration, 28(4), pp. 373-376. Liu, Y., Anisul, I. M., and Jay Gao, J., 2003. Quantification of shallow water quality parameters. Progress in Physical Geography 27(1), pp. 24–43.
Lyzenga, D. R., 1978. Passive remote Sensing techniques for mapping water depth and bottom features. Applied Optics, 17 (3), pp. 379-383. Lyzenga, D. R., 1979. Shallow-water reflectance modeling with applications to remote sensing of ocean floor. Proceeding of 13th International Symposium on Remote Sensing of Environment, pp. 583-602. Lyzenga, D. R., 1981. Remote sensing of bottom reflectance and water attenuation parameters in shallow water using aircraft and Landsat data. International Journal of Remote Sensing, 2(1), pp.71-82. Melsheimer, C. and Liew, S-C., 2001. Extracting bathymetry from multi-temporal spot images, paper presented at the 22nd Asian Conference on remote sensing, 5-9 November 2001, CDROM. Philpot, W. D., 1989. Bathymetric mapping with passive multispectral imagery. Applied Optics, 28(8), pp. 1569-1579. Polcyn, F. C. and Sattinger, I. J., 1969, Water depth determination using remote sensing techniques. Proceedings of the 6th International Symposium on Remote Sensing of Environment, pp. 1017-1028. Polcyn, F. C., and Lyzenga, D.R., 1973. Calculation of water depth from ERTS-MSS data. Proceedings Symposium on Significant Results Obtained from ERTS-1, pp.1433-1436. Stumpf, R. P. and Holderied, K., 2003. Determination of water depth with high-resolution satellite imagery over variable bottom types, Liminology and Oceanography, 48(1), pp. 547556. Wang, Y., Dong, W., and Zhang, P., 2007a. Progress in water depth mapping from visible remote sensing data. Marine Science Bulletin, 26 (5), pp. 92-101. Wang, Y., Zhang, P., Dong, W., and Zhang, Y., 2007b. Study on remote sensing of water depths on based on BP artificial neural network. Marine Science Bulletin, 9(1), pp. 26-35. Zhang, D., Zhang, Y. and Wang, W., 1998. Establishment of RS-fathoming correlation model. Journal of Hohai University, 26(6), pp. 95-99.
ACKNOWLEDGEMENTS This study was fully supported by the Guangxi Natural Science Foundation’s Returned Oversea Scholar Funds #0639007. The authors would like to thank Mr. Yuan Peng and Mr. Lei Fu of Guangxi Academy of Sciences for their assistance in the data acquisition stage of this project.
1325
The International Archives of the Photogrammetry, Remote Sensing and Spatial Information Sciences. Vol. XXXVII. Part B8. Beijing 2008
1326