HRVATSKI GEOGRAFSKI GLASNIK 73/1, 245 – 255 (2011.) UDK 631.963(497.521)(234 Medvednica) 502.4(497.521)(234 Medvednica)
Original scientific paper Izvorni znanstveni članak
Mapping the Forest Change: Using Landsat Imagery in Forest Transition Analysis within the Medvednica Protected Area Luka Valožić, Marin Cvitanović The Medvednica Nature Park was established in 1981. At that time its main phenomena were forests and forest communities which covered some two thirds of the protected area. The Park is located in close vicinity to Zagreb, the largest city in Croatia, which has been characterised by a considerable growth in population and area during the last several decades. This article reconstructs a segment of Medvednica protected area’s environmental history from 1978 to 2007. The study combines textual and tabular as well as cartographic and remote sensing data in order to provide a clear insight into the proportions of deforestation and reforestation, and their spatial patterns across the entire area of the Park. Results indicate forest transition on more than one tenth of the protected area. These are mostly contact zones of human activities and forest communities located at the edges of the protected area and at its higher elevations. Results also indicate net forest gain of 8.3% over the 1978-2007 period. Key words: forest cover, environmental change, Medvednica protected area, maximum likelihood classifier, remote sensing
Kartiranje promjene šumskog pokrova: analiza prostorne promjene šumskog pokrova u Parku prirode Medvednica pomoću Landsatovih snimaka Park prirode Medvednica osnovan je 1981. godine. Glavni su fenomen zaštićenog prostora šume i šumske zajednice, koje zauzimaju oko dvije trećine njegove površine. Park se nalazi u neposrednoj blizini Zagreba, najvećega grada u Hrvatskoj, koji tijekom nekoliko posljednjih desetljeća bilježi konstantan rast. Ovaj rad rekonstruira segment povijesti okoliša zaštićenog područja Medvednice od 1978. do 2007. Istraživanjem tekstualnih i tabličnih te kartografskih i multispektralnih satelitskih podataka nastojalo se dati jasan uvid u prostorne dimenzije deforestacije i reforestacije unutar čitavog područja Parka prirode Medvednica. S obzirom na to da su šume bile glavni razlog osnutka Parka prirode Medvednica, primarni fokus istraživanja bio je usmjeren upravo na prostorne promjene šumskog pokrova. Rezultati upućuju da se promjena šumskog pokrova (deforestacija ili reforestacija) odvija na više od jedne desetine ukupne površine Parka. Riječ je o kontaktnim zonama ljudskih aktivnosti i šumskih zajednica koje se nalaze uglavnom na rubu te zonama na višim nadmorskim visinama zaštićenog područja. Rezultati također pokazuju da bilanca prostornih promjena šumskog pokrova ide u korist reforestacije za otprilike 8.3% tijekom razdoblja 1978. – 2007.
245
Hrvatski geografski glasnik 73/1 (2011.) Ključne riječi: šumski pokrov, promjene okoliša, Park prirode Medvednica, metoda maksimalne vjerodostojnosti, daljinska istraživanja
INTRODUCTION The importance of forests (and subsequently of forests in urban areas) is substantial. Research has shown that forest cover decreases storm-water runoff, increases groundwater recharge (Matteo et al., 2006), affects carbon stock release and improves air quality (Meyfrodit and Lambin, 2008; McPherson et al. 1994), as well as decreases erosion and watershed temperatures (Kreutzweiser et al., 2009; Brockett and Gottfried, 2002). In addition, forests in close proximity to urban areas enhance recreational benefits (Glick and Chang, 1998) and improve property values (Thompson et al., 1999). Forests present a significant resource but are faced at the same time with increasing pressures from land use and land cover change all around the globe (Gaveau et al., 2007; Aung et al., 2004; Munroe and York, 2003; Zeng et al., 2005). Since humans are often considered a major force of degradation of landscape, how to reduce human disturbances has become a major issue in contemporary society and politics. One of the key policies in mitigating these trends is the creation of protected areas (PAs). According to IUCN1 (1994), protected areas are areas ”of land and/or sea especially dedicated to the protection and maintenance of biological diversity and of natural and associated cultural resources and managed through legal or other effective means”. By 2008, there were over 120,000 protected areas in the world, covering a total of about 21 million square kilometres of land and sea. The terrestrial protected areas listed in the World Database on Protected Areas cover 12.2% of the world surface (WDPA, 2010). In Croatia, there are currently 461 protected areas distributed in nine different categories: Strict Reserve, National Park, Special Reserve, Nature Park, Regional Park, Monument of Nature, Protected Landscape, Park Forest and a Monument of Park Architecture. They cover 7.95% of Croatia, which includes 11.4% of its land area and 1.3% of territorial waters in the Adriatic Sea. The largest percentage of the territory is protected under the category of Nature Park (3.71% in total), with the Medvednica PA being one of 11 Nature Parks in Croatia (Upisnik zaštićenih prirodnih vrijednosti, 2010). THE MEDVEDNICA PROTECTED AREA The Medvednica Nature Park was established in 1981, covering a surface of 22,826 hectares. It is located in north-western Croatia, in the western part of the Medvednica massif. The massif, approximately 40 km long and 9 km wide, stretches from south-west to north-east between 15°49’45” and 16°07’45” east longitude and 45°49’00” and 45°59’00” north latitude. The highest peak of Mt. Medvednica – Sljeme, as well as the Medvednica PA is located in the central part of the massif, at an altitude of 1,033 m (Boehm et al., 1979). The main phenomena of the Medvednica PA are well preserved forests and forest 246
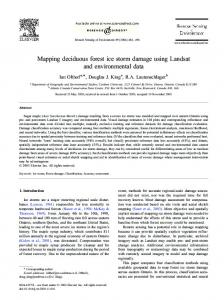
Fig. 1 The Medvednica Protected Area in Croatia Sl. 1. Park prirode Medvednica u Hrvatskoj
Mapping the Forest Change: Using Landsat Imagery in Forest Transition Analysis within the Medvednica Protected Area
247
Hrvatski geografski glasnik 73/1 (2011.)
communities, which encompass about two-thirds of the Park. Its southern and eastern parts were within the limits of the Zagreb urban area until recently, Zagreb being the largest city in Croatia with a population of around 800,000 people (2001 Census, www.dzs.hr). Zagreb has been characterised by a substantial growth in population and area during the last century, with the relative culmination in the 1960s (Bašić, 2003). Today around 70% of the metropolitan population is concentrated in the central city, but the focus of population growth has moved in the last few decades toward the satellite towns and the outskirts of the urban region, including the Podsljeme area on the foothills of the Medvednica PA (Vresk, 1997). The first attempts to protect Medvednica forests date back to 1932 when an area of around 1,300 hectares in the central part of the massif was declared a protected park forest. As a consequence of the continuing growth of Zagreb, and primarily in order to protect Medvednica forest from human-induced degradation, an area of 8,000 hectares of mostly forested area was declared an Excursion Site (”izletište”) in 1963, with 1,042 ha additionally protected as a Nature Reserve. Finally, in 1981, the Medvednica Nature Park was established, covering an area of 22,826 hectares, with forests covering 14,550 hectares. Out of these 14,550 hectares, privately owned forest covered 5,988 hectares (41%)2. There were several additional activities with the main purpose of protecting and managing the Medvednica PA. In 1976, the Committee for Medvednica Management (Odbor za uređenje Medvednice) was founded, and in 1977 the Social Compact on the Bases of Communal Activities in Organised Medvednica Management (Društveni dogovor o osnovama zajedničkog djelovanja na organiziranom korišćenju Medvednice) was concluded. In 1988 a special study entitled ”Nature Park Medvednica – forest management guidelines” was conducted and as a result of it, an area of 668.4 hectares of forest within the PA was declared a Special Purpose Forest (Meštrović et al., 1998). Since humans are often considered a major force of degradation and the impact of human disturbances on landscape structure exhibits clear distance-decay effects (Zeng et al., 2005; Karanth et al., 2006), the proximity of the Zagreb urban area has played a major role in shaping the current condition of the Medvednica PA. Some research (Slavuj et al., 2009) has shown that, as a consequence of social restructuring, unplanned construction and unsuitable city development activities, parts of the Medvednica PA area have suffered severe landscape degradation. This was one of the main reasons for passing a law in 2009 which reduced the total area of the Park from 22,826 hectares to 17,938 hectares (NN 25/2009). However, the research outlined in this paper is based on the PA’s borders before 2009. DATA To understand the contemporary dynamics of the PA’s main phenomenon – its forest cover – we observed land conversions that cause forest loss or gain across three time intervals. The changes were examined in detail on the local scale using remote sensing imagery and a maximum likelihood classifier algorithm. Data used in this study can be divided into two main groups. The first group is made up of cartographic and tabular data produced by Croatian institutions and agencies as a part of environmental studies or topographic maps. The second major group of data is comprised of remote sensing imagery recorded by the 248
Mapping the Forest Change: Using Landsat Imagery in Forest Transition Analysis within the Medvednica Protected Area
Landsat satellite system that has been operational since the early 1970’s. The first group of data was important for the definition of the protected area’s borders and its forest cover area, past and present (recent). An environmental study done by the State Environmental Protection Institute (Boehm et al., 1979) from the period prior to establishment of the Medvednica PA, is accompanied by a black and white, paper thematic map on a scale of 1:50,000 that shows the proposed PA’s borders and forest cover area categorized by the ownership criteria (private or state). This document was used as an official reference for the forest cover size and distribution on Medvednica before it was declared a protected area. A Master Plan of Medvednica PA made by the Croatian Ministry of Environmental Protection, Physical Planning and Construction, dating from the year 2005, and its cartographic material was used to gain insight into the more recent state of the PA. This study contains several colour digital maps on a 1:25,000 scale. These maps were used to clearly define the area of interest – the PA’s borders since its establishment in the 1981 until recent revision in 2009. In order to use the mentioned maps as data sources in GIS applications, they had to be georeferenced. Digital and previously georeferenced topographic maps of 1:25,000 scale were used for that purpose. The second dataset consists of multispectral imagery recorded by the Landsat satellites 2, 5 and 7. It was selected and downloaded from the New Earth Explorer webportal administrated by USGS and NASA. More specifically, the selected data is a part of Global Land Survey (GLS) archive, a rich source of Landsat multispectral data organized into four temporal groups: GLS 1975, GLS 1990, GLS 2000 and GLS 2005. The main advantage of this archive is that its satellite imagery is already georeferenced, terrain corrected, projected and, what is perhaps most important, preselected for their low cloud cover percentage. It should also be mentioned that all of the remote sensing data can be acquired completely free of charge. Four downloaded and used datasets for the area of interest were dated: August 23rd 1978, September 10th 1991, August 2nd 2000 and July 21st 2007. The first dataset from 1978 was recorded by the Landsat 2 Multispectral Scanner System (MSS) in 4 channels with a 60-meter spatial resolution. The second dataset from 1991 was recorded by the Landsat 5 Thematic Mapper (TM) in 7 channels with a resolution of 30-60 m. The last two datasets were acquired by the Landsat 7 Enhanced Thematic Mapper Plus (ETM+) in 8 channels with a resolution varying from 15 to 60 m. Because of different spectral channels and the resolution of lesser quality for the dataset from 1978, it was not used in mapping the spatial distribution of the forest cover change in the PA. Instead, a period between 1991 and 2007 was selected. METHODS Georeferenced topographic maps of 1:25,000 scale were first used to georeference the 2005 Environmental Study thematic maps, which were themselves based on such cartographic material and had it as a bleak spatial reference in the background. Such data has made georeferencing with low (sub-pixel) RMS error possible (Richards, Jia, 2006). The classic paper thematic map from the 1978 Environmental Study had first to be scanned before it could be georeferenced with the help of 2005 Environmental Study thematic maps. Because of the poor quality of the 1978 map and its lack of precise spatial 249
Hrvatski geografski glasnik 73/1 (2011.)
references, georeferencing was done largely by selection of easily recognisable features such as traffic nodes as ground control points (Campbell, 1996; Lillesand et al., 2003; Richards and Jia, 2006). This and the map’s scale of 1:50,000 made its georeferencing of lesser quality. Once georeferenced, these thematic maps could be used in a GIS application for the digitising and measuring of the PA’s area and its forest cover. Vector polyline and polygon shapefiles were created and the application’s geometry calculator was used to obtain concrete area values for the mentioned polygon features. Supervised classification with maximum likelihood classifier algorithm (Campbell, 1996; Richards and Jia, 2006) was performed on the Landsat multispectral satellite imagery. All four original bands (channels) were used in the classification of the 1978 dataset. A different approach was made with the remainder of the datasets (1991, 2000, and 2007). In order to avoid the negative influence that mountainous terrain has on spectral values detected by sensors (such as shadows) and to emphasise and differentiate vegetation cover, certain band ratios (see Lillesand et al., 2003; Richards and Jia, 2006) were calculated and put together into RGB composites. The following Landsat TM and ETM+ band ratios were used to reduce the dimensionality of the processed data and to focus on the land cover features of interest: B4/B3, B5/B4, and B5/B7 (Bahadur, 2009). All of these bands are of the same spatial resolution of 30 meters and cover the red, near infrared and shortwave infrared portions of the EM spectrum. Two final classification categories - forest and nonforest - were made for each year’s dataset by merging a dozen of the training sets. The majority filter (3x3) was applied to avoid the problem of isolated pixels or speckling that could be a result of misclassification. Such an operation was also used as an apparatus for generalization of raster datasets. The cells were counted from each year’s finalized raster and their number (sum) revealed the area size of the forest cover. Tab. 1 Forest and non-forest ratios 1978-2007 Tab. 1. Omjeri šumskih i nešumskih površina 1978. – 2007.
Forest Non-forest
1978 68,16 31,84
Net Forest Gain 1978-2007
8,33%
PA’s Percentage 1991 2000 72,85 72,53 27,15 27,47
2007 76,49 23,51
The rasters with just two classes: forest and non-forest, that came out as results of classification of the 1991 and 2007 datasets were used for detection and mapping of forest cover transition. Simple raster math was applied on classified cells to obtain four new categories: forest remains forest, forest turns into non-forest, non-forest remains non-forest, non-forest turns into forest. The resulting map shows areas without land cover change, areas of deforestation and areas of reforestation (or secondary succession).
250
Fig. 2 The forest transition in the Medvednica Protected Area from 1991 to 2007 Sl. 2. Prostorna promjena šumskog pokrova u Parku prirode Medvednica 1991. – 2007.
Mapping the Forest Change: Using Landsat Imagery in Forest Transition Analysis within the Medvednica Protected Area
251
Hrvatski geografski glasnik 73/1 (2011.)
DISCUSSION The classification results from the latest 2007 dataset were compared with the higher resolution satellite images available through the Google Earth application that served as the ground truth data. A hundred random sample points were produced and cross-referenced. Images at disposal through the free version of the Google Earth application date from October 2006, April 2007, and June 2008. Classification results on the locations of the sample points matched the ground truth reference data in 93 of 100 cases. In five cases, the ground truth data showed that non-forest was misclassified as forest. In two other misclassification cases forest was mistaken for non-forest. Error matrix produced with such data indicated an overall classification accuracy of 93.14%. Some of the sample points were positioned on the very border between forested and non-forested areas and, as such, their class was debatable. If such sample points were to be interpreted as correctly classified, overall classification accuracy would increase to 95.1%. Tab. 2 Error matrix of the 1991-2007 classification data Tab. 2. Matrica konfuzije klasificiranih podataka 1991. – 2007.
Classification Percentage data Non- Row Producers’s Errors of Producers’s Errors of Mapping Reference Forest -forest Total Accuracy Omission Accuracy Omission Accuracy data Forest 73 2 75 73/75 2/75 97,33 2,67 91,25 Non-forest 5 Column 78 Total User’s 73/78 Accuracy Errors of 7/78 Omission
22
27
24
102
22/24
22/27
5/27
81,48
Overall Classification Accuracy
2/24
PA’s Percentage
Process
Forest to Non-forest
3,83
Deforestation
Non-forest to Forest
7,48
Reforestaion
18,52
75,86
93,14
Uncertainties could arise from georeferencing errors made in this study itself or those present in the Google Earth and Landsat imagery. Apart from positional errors, those remote sensing datasets could also be flawed in a spectral manner by a variety of problems regarding the sensors themselves, atmospheric conditions and topographic shadows. Possible errors made during the vector feature creation could also reduce the overall classification accuracy. Converting vector features into raster datasets of desired resolution (cell size 30 m) leads to a certain degree of generalisation that could be interpreted as an error or uncertainty. Finally, the MLC classification method itself may be a source of misclassified pixels. The overall minimum classification accuracy of 93% can be characterised as being relatively high, compared to other studies of this type. One of the reasons for that is a very small number of examined land cover classes. 252
Mapping the Forest Change: Using Landsat Imagery in Forest Transition Analysis within the Medvednica Protected Area
RESULTS AND CONCLUSION The results of this paper can be divided into two categories. The tabular data demonstrate the forested and non-forested area ratios for three time intervals (calculated from four remote sensing datasets) in the Medvednica PA for the 1978 – 2007 period (Tab. 1). This data shows that the overall net forest gain for the period is 8.33%. It has to be mentioned that the data produced in this paper for the year 1978 slightly differs from the official 1979 Environmental Study data (Boehm et al., 1979). Namely, the official data about the Medvednica PA from the Study gives a figure of 64% of forested area in 1979, while this research estimates the initial 1978 forested area to have been at 68% of the total PA’s surface. In addition, the digitalisation of the 1979 Study map gave a result of 67% of forested area, which is much closer to the data acquired from this research (68%) than the official data (64%). The main reason for such difference could arise from the definition of the forest itself. The area classified as forest in this study is a surface (pixels) mostly covered with forest canopy or dense/tall shrubs, while there is no clear definition of what falls into the forest category in the 1979 Study. Thus, the results in this paper (both relative and absolute) are based solely on the data acquired from original research and are not compared with the official data. When compared to the official data, the results would indicate even larger changes in the forest cover. As such, the estimates in this paper can be characterised as conservative. The second category of data was used in order to gain a clear insight into the geographical distribution of forest transition in the Medvednica PA. The 1991-2007 period was selected for the mapping of the process (Fig. 1). From these results, it can be concluded that forest transition is occurring in the Medvednica PA. It is limited to slightly over 11% of the Protected Area’s surface with reforestation taking up 7.5% of the overall change, and deforestation 3.8%. The change in the forest cover occurs mostly on the edges of the forested area and the higher elevation zones. While the higher elevation zones are the main tourist area of the PA (with a ski-centre, a hotel, several mountain lodges and the accompanying infrastructure), the edges of the forested areas are easily accessible and much closer to larger urban areas. Accessibility of forests has been shown to have an effect on the extent of forest change. When forests are easy to access, either because they are located at lower elevations or can be easily approached through road and rail networks, they tend to suffer higher levels of human impact (Lele et al., 2010). This study demonstrates that the main phenomena of the Medvednica PA – forests and forest communities – are not shrinking in size, but precisely the opposite. However, the study does not discuss other components of the protection within the PA, such as the preservation of biodiversity and cultural resources and cannot be used to assess fully the overall success of the Medvednica Protected Area since its establishment in 1981. This paper has been realised within the Urban Systems in Croatia’s Spatial Development and Environmental Change and Cultural Landscape as Development Resource projects, supported by the Ministry of Science, Education and Sports of the Republic of Croatia. 253
Hrvatski geografski glasnik 73/1 (2011.) NOTES 1 2
International Union for Conservation of Nature The data in this chapter are the official numbers of the „Medvednica Nature Park” Public Institution and are taken from the Environmental Study made by Boehm et al., 1979.
REFERENCES Aung, M., Swe, K., Oo, T., Moe, K., Laimgruber, P., Allendorf, T., Duncan C. and Wemmer, C., 2004: The environmental history of Chatthin Wildlife Sanctuary, a protected area in Myanmar (Burma), Journal of Environmental Management 72 (4), 205-216. Bahadur, K., 2009: Improving Landsat and IRS Image Classification: Evaluation of Unsupervised and Supervised Classification through Band Ratios and DEM in a Mountainous Landscape in Nepal, Remote Sensing 1 (4), 1257-1272. Bašić, K., 2003: Zagreb: Population change 1991-2001, Hrvatski geografski glasnik 65 (2), 55-66. Boehm, D., Bralić, I., Budak- Rajičić, J., Deželić, R., Kamenarović, M., Mikulić, Z., Oršić, D., Rukavina, M. and Šobat, A., 1979: Park prirode ” Medvednica”, studija zaštite prirode, Republički zavod za zaštitu prirode, Zagreb. Brockett, Charles D. and Gottfried, Robert R., 2002: State Policies and the Preservation of Forest Cover: Lessons from Contrasting Public-Policy Regimes in Costa Rica, Latin American Research Review 37 (1), 2002. Campbell, J.B., 1996: Introduction to Remote Sensing, Guilford, New York. Gaveau, David L.A., Wandono, H. and Setiabudi, F., 2007: Three decades of deforestation in Southwest Sumatra: Have protected areas halted forest loss and logging, and promoted re-growth?, Biological Conservation 134, 495 – 504. Glick, R.H. and Chang, G.C., 1998: Design and implementation of wetponds to control urban stormwater runoff., Paper No. 982088, American Society of Agricultural. Engineering, Saint Joseph, MI. Karanth, Krithi K., Curran, Lisa M. and Reuning-Scherer, Jonathan D., 2006: Village size and forest disturbance in Bhadra Wildlife Sanctuary, Western Ghats, India, Biological Conservation 128 (2), 147-157. Kreutzweiser, David P., Capell, Scott S. and Holmes, Stephen B., 2009: Stream temperature responses to partial-harvest logging in riparian buffers of boreal mixedwood forest watersheds, Canadian Journal of Forest Research 39 (3). Lele, N., Nagendra, H. and Southworth, J., 2010: Accessibility, Demography and Protection: Drivers of Forest Stability and Change at Multiple Scales in the Cauvery Basin, India, Remote Sensing 2, 306-332. Lillesand, T.M., Kiefer, R.W. and Chipman, J.W., 2004: Remote Sensing and Image Interpretation, Fifth Edition, Wiley, Hoboken. Matteo, M., Randhir, T. and Bloniarz, D., 2006: Watershed-Scale Impacts of Forest Buffers on Water Quality and Runoff in Urbanizing Environment, Journal of Water Resources Planning and Management 132 (3), 144-152. Meštrović, Š., Matić, S., Tustonjić, A. and Pavelić, J., 1998: Šume Medvednice jučer – danas – sutra, Šumarski list 7-8, 315-328. McPherson, E., Nowak, D., and Rowntree, R., 1994: Chicago’s urban forest ecosystem: Results of the Chicago urban forest climate project, General Technical Rep. No. NE-186, USDA Forest Service. Meyfroidt, P. and Lambin, Eric F., 2008: Forest transition in Vietnam and its environmental impacts, Global Change Biology 14, 1–18.
254
Mapping the Forest Change: Using Landsat Imagery in Forest Transition Analysis within the Medvednica Protected Area Munroe, Darla K. and York, Abigail M., 2003: Jobs, Houses, and Trees: Changing Regional Structure, Local Land-Use Patterns, and Forest Cover in Southern Indiana, Growth and Change 34 (3), 299-320. Richards, J.A. and Jia, X., 2006: Remote Sensing Digital Image Analysis: An Introduction, Springer, Berlin. Slavuj, L., Cvitanović, M. and Prelogović, V., 2009: Emergence of problem areas in the urban structure of postsocialist Zagreb, Spatium International Review 21, 76-83. Thompson, R., Hanna, R., Noel, J. and Piirto, D., 1999: Valuation of tree aesthetics on small urban-interface properties, J. Arboriculture 25 (5), 225–234. Vresk, M., 1997: Suburbanizacija Zagreba, Hrvatski geografski glasnik 59 (1), 49-70. Zeng, H., Sui, Daniel Z. and Ben Wu, X., 2005: Human disturbances on landscapes in protected areas: a case study of the Wolong Nature Reserve, Ecological Research 20 (4), 487 – 496.
SOURCES Census of population, households and dwellings, 31st March 2001, www.dzs.hr, 29.12.2010. Guidelines for Protected Area Management Categories, IUCN, Cambridge, UK and Gland, Switzerland, www. iucn.org, 30.12.2010. New Earth Explorer, http://edcsns17.cr.usgs.gov/NewEarthExplorer/, 30.12.2010 Prostorni plan Parka prirode Medvednica, Grad Zagreb – Gradski zavod za prostorno uređenje, Zagreb, 2005. Upisnik zaštićenih prirodnih vrijednosti, stanje 18. svibnja 2010., http://www.dzzp.hr/zasticena-podrucja/zasticena-podrucja-u-hrvatskoj/zasticena-podrucja-u-hrvatskoj-nacionalne-kategorije-714.html World Database on Protected Areas (WDPA), http://www.wdpa.org, 29.12.2010. Zakon o izmjenama Zakona o proglašenju zapadnog dijela Medvednice parkom prirode, NN 25/2009, http:// narodne-novine.nn.hr/clanci/sluzbeni/2009_02_25_537.html, 15.01.2011.
Received (Primljeno): 2011 – 01 – 10 Accepted (Prihvaćeno): 2011 – 03 – 25
Luka Valožić, Junior researcher, University of Zagreb, Faculty of Science Department of Geography Marulićev trg 19/II, 10000 Zagreb
[email protected] Marin Cvitanović, Junior researcher, University of Zagreb, Faculty of Science Department of Geography Marulićev trg 19/II, 10000 Zagreb
[email protected]
255