Mini-Matlab Lesson 7: Direction fields and phase plots. Using Matlab ... This can
be accomplished by creating the meshgrid, and then using the *quiver(X, Y, U, V,
sc)* command ... phase planes within a graphical user interface (GUI). It can be ...
Mini-Matlab Lesson 7: Direction fields and phase plots Using Matlab to plot direction fields and phase plots Contents Mesh grids Direction fields Phase plots DFIELD & PPlANE Mesh grids The [X,Y] = meshgrid(x,y) command takes in two vectors and returns two arrays. If x is of length n and y is of length m, then the arrays are of size m x n. This allows us to create surfaces, f(x, y), which operate on an array of points (x, y). clear; close all; x = linspace(-3, 3, 10); y = linspace(-3, 3, 5); [X, Y] = meshgrid(x, y) surf(x,y, X+Y); % Surface plot view(-100, 25); % Rotate view xlabel('x', 'FontSize', 16); ylabel('y', 'FontSize', 16); title('Plot of z = x + y', 'FontSize', 16);
X = -3.0000 -3.0000 -3.0000 -3.0000 -3.0000
-2.3333 -2.3333 -2.3333 -2.3333 -2.3333
-1.6667 -1.6667 -1.6667 -1.6667 -1.6667
-1.0000 -1.0000 -1.0000 -1.0000 -1.0000
-0.3333 -0.3333 -0.3333 -0.3333 -0.3333
0.3333 0.3333 0.3333 0.3333 0.3333
1.0000 1.0000 1.0000 1.0000 1.0000
1.6667 1.6667 1.6667 1.6667 1.6667
2.3333 2.3333 2.3333 2.3333 2.3333
-3.0000 -1.5000 0 1.5000 3.0000
-3.0000 -1.5000 0 1.5000 3.0000
-3.0000 -1.5000 0 1.5000 3.0000
-3.0000 -1.5000 0 1.5000 3.0000
-3.0000 -1.5000 0 1.5000 3.0000
-3.0000 -1.5000 0 1.5000 3.0000
-3.0000 -1.5000 0 1.5000 3.0000
-3.0000 -1.5000 0 1.5000 3.0000
-3.0000 -1.5000 0 1.5000 3.0000
Y =
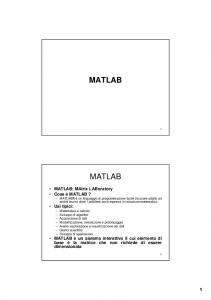
Direction fields In your first problem set, you were asked to plot the direction field for
This can be accomplished by creating the meshgrid, and then using the *quiver(X, Y, U, V, sc)* command. At each of the m x n points in the meshgrids X and Y, *quiver* plots the vectors whose x and y components are given by U and V. The extra argument, sc, is a numerical value which multiplies the length (over their automatically determined length) of the arrows by sc. n = x = y = [X,
10; m = 10; linspace(-3, 3, n); linspace(-3, 3, m); Y] = meshgrid(x, y);
quiver(X, Y, ones(m, n), X - Y + 1, 1.5); axis([-3 3 -3 3]); xlabel('x', 'FontSize', 16); ylabel('y', 'FontSize', 16); title('Plot of direction field for dy/dx = x - y + 1', 'FontSize', 16);
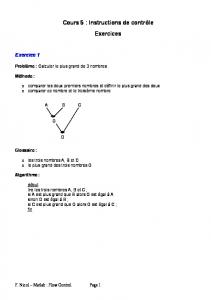
Phase plots We can also use quiver to draw phase plots. As an example, consider
x1 = linspace(-2, 2, 20); x2 = linspace(-1, 1, 10); [X1,X2] = meshgrid(x1, x2); quiver(X1, X2, -X1 + X1.^3, -2*X2, 2); axis([-2 2 -1 1]); xlabel('x_1', 'FontSize', 16); ylabel('x_2', 'FontSize', 16); title('Phase plot', 'FontSize', 16);
DFIELD & PPlANE John Polking (Rice U.) has written a Matlab program which can create direction fields and phase planes within a graphical user interface (GUI). It can be downloaded from http://math.rice.edu/~dfield/ Save the dfield and pplane .m files in a directory on your computer, and simply type 'dfield' or 'pplane' to run the programs. Published with MATLAB® 7.12