In this paper, an effective Taguchi methodology has been utilized for selection of ... of experiment neural network optimization technique on induction hardening ...
IOSR Journal of Mechanical and Civil Engineering (IOSRJMCE) ISSN : 2278-1684 Volume 1, Issue 2 (July-Aug 2012), PP 28-32 www.iosrjournals.org
Mathematical modeling for selection of process parameters in induction hardening of EN8 D steel P. G. Kochure and K. N. Nandurkar Department of Production Engineering, K.K.Wagh Institute of Engineering Edu. And Research, Nashik (India)
Abstract: Mathematical modeling with computer application is becoming more and more popular in study, development of setup, maintenance of induction heating process. It can be used to explain, demonstrate and predict the process performance of induction hardening system. Different methods used to solve the field problems. In this paper, an effective Taguchi methodology has been utilized for selection of optimum process parameters of induction hardening of EN8 D steel. Various parameters such as power and heating time have been explored by experimentation. An orthogonal array, L9 , analysis variance of ANOVA are applied study the performance characteristic of induction hardening process. Hardness has been considered as performance characteristic. Analysis of variance (ANOVA) of response variable shows a significant influence of process variables i.e. power and heating time. The experimental results shows that the predicted mathematical models suggested could describe the performance characteristics within the limits of the factors being investigated .The results of regression equations have been verified by confirmation tests. Also microstructure analysis is done for justification of hardening work. Keywords: ANOVA, induction hardening, mathematical model, micro structure , orthogonal array, Taguchi methodology .
I.
Introduction
Induction hardening process have found ever-increasing applications to improve the performance and life of the parts used in automobile engineering. Thin surface layers i.e 0.25 to 2.3 mm of the work piece made of steel can be hardened by this process. Y.Totic ,R.Sadeler,H.Altum investigated the effects of heating time, feed rate and temperature on wear characteristics of AISI 4140 steel in induction hardening process. [13] Julie.K, Timothy James.[12] studied the effect of feed rate and gap between coil and work piece, quench distance and part temperature by using design of experiment neural network optimization technique on induction hardening process and reported a significant improvement in the process. R Kolleck, R.Veit[7] focused on reduction of processes cycle time, rising energy, costs eco friendly process and need of new heating technologies in hardening process and proposes the inductive heating alternative methodology for boron alloyed steel. Robert Cryderman , Nima Sham Soei , Al Fatemi [9] In this paper study investigates the influences of induction hardened parts produced from steel bars. Resit Unal, Edwin B.Dean [8] In this paper authors were presented the overview of the Taguchi method its steps involved and state that , it is a systematic and efficient approach for determining the optimum experimental configuration of design parameters for performance, quality and cost. Principle benefits include considerable resource savings determination of important factors affecting operation. Performance and cost,and quantitative recommendations for design parameters which achieve lowest cost, high quality solutions. In this paper, best working parameters are selected for generation of desired hardness values and pattern in EN8 D steel, by using Taguchi method. Because Taguchi method showed to be a very useful in process improvement provide confident information about influence of factors on a response variable and less number of experiments than traditional method to improve the process while not compromising the desired goals. [3] The Taguchi method uses a special design of orthogonal array to study the entire parameters space with less number of experiments. The experiments results are then transformed in to signal to noise (S/N) ratio. Taguchi recommends the use of |S/N ratio to measure the quality characteristics deviating from the desired values i.e. lower the better higher the better, and nominal the better. The S/N ratio of each level of process parameter is computed based on S/N ratio analysis. A greater S/N ratio corresponds to the better quality characteristics. The ANOVA tables has been used to investigate and test the significance of design parameters. It indicates which parameters are significantly affecting the response parameters. In the analysis. the sum of squares and variance are calculated. F test values at 95% confidence level is used to decide the significant factors affecting the process.
www.iosrjournals.org
28 | Page
Mathematical modeling for selection of process parameters in induction hardening of EN8 D steel II. Experimental procedure. 2.1 Work piece material
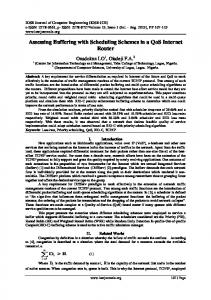
Figure 1a : case study shaft
figure 1 b :detailed view of
slot
The automobile shaft i.e. selector and shifting shaft was selected for study. The work piece material used for present study was EN8 D steel. Its composition was 0.40% Carbon, 0.22% Silicon, 0.71% Manganese , 0.02% Sulphur , and 0.024% Phosphorus . Material conforms to BS 970(1955) for EN8 D steel. This material is suitable for variety of automotive components such as axle, crank shaft, spline shafts and gears etc. The length of work piece is 177 and diameter 19mm respectively. The static induction hardening has been performed on the slot portion of work piece. 2.2 . Experimental apparatus High frequency induction hardening machine (40 kw, 200khz) make Sanket Power Systems has been used for the performing the experiments . A source of high frequency of electricity is used to drive a large alternating current through a copper coil. The passage of a current through this coil generates a intense and rapidly changing magnetic field in the space within the work coil. The work piece to be heated is placed within this magnetic field where eddy current is generated within the work piece and resistance leads to heating of work piece. The core of the work piece remains unaffected by this process . Induction hardening temperature was above 850 ºC . 2.3 Experimental plan. In this investigation two factors at three levels have been studied. Factors and their levels are shown in table 1 . The factors and levels are selected on the basis of literature review and their range were finalized after pilot runs.[11] Table 1 : process parameters and their levels Sym bol P T
Process parameters
Level I
Level II
Level III
Power (kw) Heating time (sec)
10 02
12 03
14 04
The values of factors of induction hardening process were utilized for conducting design of experiments in induction hardening machine for EN8 D steel. The response variables to be investigated were hardness HRc, and its developed pattern i.e. case depth , Based on available in put parameters and their levels an orthogonal array lay out is designed for Taguchi method by using soft ware MINITAB . Table 2 : Experimental data as per designed array L9 E xp.Runs No 1 2 3 4 5 6 7 8 9
ower kw 10 10 10 12 12 12 14 14 14
Heating P time sec 02 03 04 02 03 04 02 03 04
Hardness HRc 55 56 57 57 57 58 58 58 60
Case depth(mm) Outer Vertical Top 8.70 2.0 8.75 2.3 9.20 2.5 9.00 2.2 9.20 2.4 9.45 3.3 9.00 3.0 9.35 3.2 9.60 4.0
www.iosrjournals.org
Centre 0.4 0.5 0.8 0.5 0.9 1.5 1.0 1.3 1.8
Inner Vertical 8.75 8.85 9.25 9.05 9.25 9.50 9.10 9.30 9.50
Top 2.2 2.4 2.7 2.3 2.8 3.6 3.2 3.5 3.9
Centre 0.5 0.6 0.9 0.6 0.7 1.6 1.1 1.4 1.8
29 | Page
Mathematical modeling for selection of process parameters in induction hardening of EN8 D steel As given in table 2 performance test involves nine runs. Accordingly nine runs were carried out to study the effects of input parameters. Same work coil is used for all runs.[14] 2.4 Experimental technique As shown in table 2 nine experiments are conducted. Each experiment is conducted for three times to reduces the experimental errors. Hardness was measured by Rockwell hardness testing machine for C scale at 150 kg load, having diamond indenter at 120 degrees . While automatic Vickers‟s hardness testing machine is used to measure case depth achieved at various locations.
III.
Results and discussions.
The mean of three experimental values of each run is mentioned in the table 2 further analysis of results were carried by using software MINITAB. 3.1 Analysis of variance (ANOVA) The ANOVA tables has been used to investigate and test for significance of design parameters. It indicates which parameters are significantly affecting the output parameters. In the analysis the sum of squares and variance are calculated . F-test values at 95% confidence level is used to decide the significant factors affecting the process and percentage contribution. Since the p values are less than 0.05 and larger F values indicates that these factors have statistically significant effects on the performance . The ANOVA analysis for response are shown in table 3. Table 3: ANOVA results for hardness.[2][5] Source
DF
SS
MS
Power 2 10.6667 5.33333 Heating time 2 4.6667 2.33333 Error 4 0.6667 0.16667 Total 8 16.0000 S = 0.4082 R-Sq = 95.83% R-Sq(adj) = 91.67%
F
P
32.00 14.00
0.003 0.016 Significant
All F-ratios are based on the residual mean square error. Main Effects Plot (data means) for hardness power
59.0
Main Effects Plot (data means) for SN ratios
heating time
heating time
19.4
Mean of SN ratios
58.5
Mean of hardness
power
19.5
58.0 57.5 57.0
19.3 19.2 19.1 19.0
56.5
18.9
56.0
10 10
12
14
2
3
4
12
14
2
3
4
Signal-to-noise: Larger is better
Fig. 2 a : plot for hardness
Fig. 2 b : plot for hardness
Fig. 2a and 2b shows main effects plot (data means) of mean and S/N ratio graphs for hardness. Where the horizontal line is the value of total mean of S/N ratio. Basically larger the S/N ratio better is the quality characteristics for process. Table 4: Significance of induction hardening parameters for hardness Response
Process parameter
Mean S/N ratio Level 1
Level II
Level III
35.17 35.12
35.37 35.32
Significance of induction hardening parameter Max-Min
Hardness P T
34.96 35.06 P = power , T = heating time
0.41 0.25
Significance of induction hardening parameters (difference between max and min values) indicates that power is significantly contributing towards the induction hardening performance as difference gives higher values .According to ANOVA analysis as shown in the table 3 most effective parameter with respect to hardness
www.iosrjournals.org
30 | Page
Mathematical modeling for selection of process parameters in induction hardening of EN8 D steel is power. As per the S/N ratio analysis from the graphs and significance the levels of parameters to be set getting optimum values of hardness are P3- T3 i.e. 14 kw-4 sec. The analysis of graphs and ANOVA results clearly indicates that the increase in power and heating time increases hardness of work piece Confirmation test: After identifying the best levels of process parameters, a new experiment was designed and conducted with predicted levels of process parameters optimum parameters found are P-14kw, T-4 sec, comparison between estimated values and confirmation test value shows a small difference between these values.These values correlate each other. This indicates that ANOVA results are closely match with the Taguchi results.[1] Surface Plot of hardness vs heating time, power
Contour Plot of hardness vs heating time, power 4.0
57.5
heating time
3.5 60.0
hardness
57.5
55.0 10
3 12 power
14
3.0
56.5
57.0
11
12 power
2.5
4 heating time
2
2.0 10
Fig. 3 a : 3D surface plot for Hardness
13
14
Fig. 3 b: Contour plot for Hardness
Fig. 3 a and 3b shows 3D surface graph and contour plot for hardness of EN8 D steel respectively . These fig.s show the effect of power and heating time on the response as hardness. It is clear from the above figures that increase in power and heating time increases hardness of work piece.
IV.
Mathematical Model
The relationship between dependent variables and independent variables is characterized by a mathematical model called a regression model. Multiple linear regression equations were modeled for relationship between process parameters i.e. power and heating time to evaluate hardness for any combination of factor levels in a range specified model for multiple regression equation is y = β0 + β1 + β1x1 + β2x2+β3x3+------+ βpxp+ ε
(1)
Where y is dependent parameter, x1, x2 , x3……. xp are independent parameters , β are regression parameters and ε is residue.[3] The regression coefficients have been obtained by using experimental data. The regression equations for response characteristics as a function of two parameters of the material EN8 D steel considered in this experiment are given below. The insignificant coefficients identified from ANOVA have been omitted from equation for various responses . In this case, regression equation is formulated in terms of parameters i.e. power and heating time by using MINITAB software.
The regression model equation for response in terms of power and heating time is given below Hardness = 46.8 + 0.667 Power + 0.833 Heating time (2) Table 5: confirmation for regression equation of hardness Response Hardness
Exp No. 2 3 5 8
Exp value 56 57 57 58
Model value 55.269 58.802 57.303 58.637
%Variation 0.055% 3.161% 0.531% 1.098%
V. Confirmation for regression equation In order to validate the regression equation , experimental data were compared with data obtained by putting the same experimental conditions in the regression equation . The results are given in the table 5. Percentage variation estimated for the equation 2 for hardness in the range of 0.055% to 3.161 %. These results obtained by regression equation closely co relate with each other which validated the regression equation developed . Thus the developed equation can be used to predict hardness for any combination of factor levels in the specified range[2].
www.iosrjournals.org
31 | Page
Mathematical modeling for selection of process parameters in induction hardening of EN8 D steel VI.
Micro structure analysis
Fig. 4 : Micro structure of the surface of induction hardened EN8 D steel Uniform distribution of carbon cannot be assumed in the case of induction hardening many times carbon can not be diffused to a uniform concentration throughout the structure. The fig. shows micro structure image of the surface of induction hardened EN8 D steel at 250X , polished and etched at 3% Nital solution. Micro structure shows fine tempered martensite with uniformly distributed ferrites. No micro cracks observed in the induction hardened zone. Uniform distribution of ferrites and pearlites are observed in the core. which indicated the distribution of uniform hardness .
VII.
Conclusion
Taguchi method of experimental design with L9 orthogonal array has been applied for selection of optimum process parameters of induction hardening of EN8 D steel. The experimental investigation shows the effects of process parameters such as power, heating time on hardness and case depth pattern achieved on work piece. The optimum parameters found are 14 kw power and heating time 4 sec. power is the most influential parameter. Further multiple regression equations are formulated for estimating predicted values of hardness of slots for a specified range. The results obtained by regression equations closely co relate each other which validates the regression equation developed. And micro structure analysis justified the hardening work.
References [1] [2]
[3] [4] [5] [6]
[7] [8] [9] [10]
[11] [12] [13] [14]
Amit kohli and Hari Singh , “ Optimization of process parameters in induction hardening using surface response method‟‟ Indian Academy sciences ,sadhana Vol 36 –Part 2, 2010 P 87-91 Bala Murugan Gopalsamy , Biswanath Mondal and sukamal ghosh , “Taguchi method and ANOVA : An approach for process parameters optimization of hard machining while machining hardened steel’’ Journal of Scientific & Industrial Research Vol 68 , August 2009 , p 686-695. Douglas C. Montgomery, Wiley India, Pvt. Ltd. New Delhi ‘’Design and analysis of experiments „‟ 2009 ,P3-13,19,392-400 Keith M. Bower M.S. MINITAB Inc. “ ANOVA by MINITAB‟‟ Scientific Computing and Instrumentation , Feb.2000 M .N .Das , N. C. Giri, New Age international (p) Ltd. Publisher , New Delhi ‘’Design and Analysis of experiments’’ 1999,P 1315 M. Kaladhar, K.V.Subbaiah, Ch.Srinivasa Rao, And k.narayana Rao, “Application of Taguchi approach and Utility Concept in solving the Multi-objective Problem when turning AISI 202 Austenitic Stainless Steel‟‟ Journal of Engg . Science and Technology , 2011 ,p 55-61 R. Kolleck (3)a,*, R. Veit a, M. Merklein b, J. Lechler b, M. Geiger (1)b “Investigation on induction heating for hot stamping of boron alloyed steels ‟‟ 2009 Resit Unal, Edwin B.Dean , “ Taguchi approach to design optimization for quality and cost : An overview‟‟ Annual Conference of the international Society of parametric Analysts, 1991 p 1-9 Robert Crydermana, Nima Shamsaeib, Ali Fatemib, “Effects of continuous cast section size on torsion cook deformation and fatigue of induction hardened 1050 steel shafts ‟‟ 2010 S. Kamaruddin, Zahid A. Khan and S. H. Foong, December “ Application of Taguchi method in the optimization of injection moulding parameters for manufacturing products from plastic blend”. IACSIT International Journal of Engineering and Technology, Vol.2, No.6, 2010 , p 574-580. Software MINITAB release 14 Timothy James Stich, Julie K., “ The Application of Artificial Neural. Networks to Monitoring and Control of an Induction Hardening Process. ‟‟ Journal of Industrial Technology, 16(1):1-11(2000). Y. Totik, R. Sadeler, H. Altun and M. Gavgali. “ The effects of Induction Hardening on Wear Properties of AISI 4140 Steel in dry sliding conditions ‟‟, Materials & Design 24(1):25-30(2003). http://www.camo.com/rt/Resources/design_of_experiment/html
www.iosrjournals.org
32 | Page