Maxtream: Stabilizing P2P Streaming by Active Prediction of Behavior Patterns .... a method to predict load in the uplink of source peers ac- tively, and do not ...
Maxtream: Stabilizing P2P Streaming by Active Prediction of Behavior Patterns Shay Horovitz and Danny Dolev Hebrew University of Jerusalem {horovitz,dolev}@cs.huji.ac.il
Abstract In theory, peer-to-peer (P2P) based streaming designs and simulations provide a promising alternative to serverbased streaming systems both in cost and scalability. In practice however, implementations of P2P based IPTV and VOD failed to provide a satisfying QoS as the characteristic fluctuational throughput of a peer’s uplink leads to frequent annoying hiccups, substantial delays and latency for those who download from it. A significant factor for the unstable throughput of peers’ uplink is the behavior of other processes running on the source peer that consume bandwidth resources. In this paper we propose Maxtream - a machine learning based solution that actively predicts load in the uplink of streaming peers and coordinates source peers exchanges between peers that suffer from buffer underrun and peers that enjoy satisfactory buffer size for coping with future problems. Simulation and experiments have shown that the solution successfully predicts upcoming load in popular protocols and can improve the QoS in existing P2P streaming networks.
1. Introduction Following the increased popularity of P2P file sharing applications and a substantial growth in the creation of user generated content (UGC), came a corresponding increase in initiatives for building the ultimate streaming media network with minimal cost and high quality, both for broadcasting live TV and video on demand applications. Yet, so far there is no known winning recipe for building such networks. While there are some implementations that proved to be scalable and cost effective, they failed with the end user’s experience due to a mixture of low quality video content and QoS problems. Popular implementations of P2P based networks in the industry such as Joost [8] and PPLive [11] were reported to often suffer from a variety of QoS problems [31, 5, 10, 6]
like broken streams, streaming audio/video hiccups, substantial latency and major delays in live broadcasts. While in server based streaming services it is possible to solve QoS problems with buffering/caching, the instability of peers upload in P2P streaming networks require a much larger cache, which makes it impractical - as even when networks’ policy allowed extremely unbearable latencies of up to 2 minutes [31, 23], users still faced the above problems. Instead of watching movies using streaming services, users still prefer to wait for the media content to be downloaded using either file sharing services or follow the latest fashion by using alternative non-P2P services such as RapidShare and MegaUpload [12, 3] for downloading movies. Recent studies have shown that the major factor that has direct impact on QoS in P2P networks is the behavior of users at the source peers [24, 21, 28] - taking occasional actions that heavily use bandwidth such as sending Email, online games, running other P2P applications in parallel or even terminating the process of the P2P network while it is streaming. While it is reasonable to claim that users that watch online TV will not run other processes in parallel, in reality many users tend to keep their file sharing P2P applications and Email clients running in the background. In addition, for many other users watching online broadcasts such as sports events (in a small frame, not in full screen) is a background task while they use other software. This behavior leads to fluctuational rate of packets for the client peer which might be reflected by latencies, delays and hiccups in P2P streaming networks. Thus there is a need for a solution that will address the problem of user behavior in P2P streaming networks and provide a mechanism that is able to absorb the instability of source peers and allow stable throughput at the client side. In this paper we propose Maxtream - a machine learning based solution that employs Support Vector Machines (SVM) [30] to actively predicts load in the uplink of streaming peers and coordinates source peers exchanges between peers that suffer from buffer underrun and peers that enjoy satisfactory buffer size for coping with future problems. Maxtream discerns patterns of communications with no prior knowledge about any protocol structure therefore it
is able to predict load on new protocols as well. Experiments demonstrate high accuracy in predicting upload link load on popular P2P protocols such as eMule and BitTorrent running on typical home machines with DSL links. The solution is also applicable for encrypted protocols, as demonstrated on an obfuscated version of eMule. The remainder of this paper examines these issues both analytically and empirically. In Section 2 we discuss related work in this field. Section 3 elaborates on the problem and present different scenarios where the user behavior has influence on his machine’s upload bandwidth. Section 4 presents Maxtream and discusses implementation alternatives. Section 5 presents our experiments on popular protocols and the results of our simulations.
2. Related Work Previous research designs proposed several ideas to improve P2P streaming networks’ performance. [29] presented a topology of clusters and a multicast tree is built on top of hierarchy of clusters. [21] presented a simulated P2P VOD network based on maintaining an application multicast tree. [19] proposed tree based overlay intended for hundred of clients in a multicast group. [33] offered a P2P VOD network that pre-caches content on peers. [22] presented a P2P VoD that streams the video between the clients in a tree. [17] is a high-bandwidth content streaming/distribution system that is built upon Pastry and Scribe. [27] employs distributed streaming to obtain the content from multiple peers simultaneously. [28] progressively evaluates various combinations of senders to determine a subset of the senders that can collectively provide maximum throughput. Most of the above designs do not relate to the user behavior influence on the streaming process. Those that do mention behavior, limit it only to node leaves. Most research papers tend to ”divide the world” into strong peers that can take part in the streaming network and weak peers that can’t. The decision if a peer is strong or weak is usually made preliminary based on measurements such as ping roundtrip time. Once it was decided, the decision remains unchanged and a peer that was strong can not turn into a weak peer anymore. However, in reality peers often change the throughput they supply to their clients due to other processes that consume upload bandwidth and not only while leaving the network. A strong peer might become weak at some stage and a weak peer might become strong. None of the above works present an active approach for handling the user behavior factor. Some research papers proposed to embed machine learning algorithms in P2P networks. [20] uses Maximum Likelihood Estimation to evaluate trust and reputation for peers bilateral interactions. [15] employs SVM for selecting
neighbors in an unstructured network as Gnutella, to optimize the path of queries in the network. [9] presents an SVM based classification tool for ISPs to differentiate between P2P-TV protocols by counting packets in a given time frame. [32] and [26] classify classes of protocols according to predefined templates of sequences of IP addresses and port values for recognizing anomalies at the backbone. [16] predicts latency between nodes based on IP address values. [18] proposed an SVM based solution for predicting the available bandwidth in an internet path by transmitting probing packets. These papers do not offer a method to predict load in the uplink of source peers actively, and do not address the influence of user behavior on the source’s available bandwidth. Additional related work that concerns the problem of source peers’ upload stability in P2P networks is referred in Section 3.
3. Problem: P2P Streaming QoS and the Buffering Tradeoff While P2P dominate the internet with over 60% of all upstream data in ISPs [12], its success can only be attributed to file sharing applications and not streaming [3]. As massive media content web sites like YouTube avoided P2P so far and are willing to pay the traffic bill for being the 3rd in global traffic rankings for web sites [1], one might ask what prevents commercial media content services from using P2P. In theory, P2P based streaming designs and simulations provide a promising alternative to server-based streaming systems both in cost and scalability. In order to examine what made P2P streaming less popular than its alternatives around the world, we looked for evidence about problems with these networks. One of the most promising P2P streaming networks was Joost [8]. Joost suffered from severe QoS problems that were reported by its users such as connection loss, hiccups [7] and degraded throughput [5] that affected video quality. Joost also failed in broadcasting live events [6]. Recently, Joost finally abandoned P2P completely for a server based solution [4]. Another highly popular P2P streaming network is PPLive [11], which is also reported to suffer [10] from occasional glitches, re-buffering and broken streams. While in server based streaming services it is possible to solve streaming QoS problems with buffering, the instability of peers’ upload in P2P streaming networks require a much larger buffer, which puts QoS in question again for the latency - as even though PPLive offers only modest low-quality narrow-band P2P video streaming [25], its subscribers experience a latency between tens of seconds [31] to two minutes [23]. The above problems puts P2P technologies in question
for commercial system designers, due to QoS problems. As most P2P systems already run a best effort approach by prioritizing peers with minimized infrastructure problems like delay and packet loss, they still miss a key factor in degrading P2P performance - the user behavior. In addition, this approach is blind to a large number of weak sources that remain unused, while the small group of strong sources are exploited and overused [25]. In our previous work [24] we analyzed the factors for the instability of source peers in P2P networks and found that the aspect that has the greatest impact is the behavior of users at source peers. The most obvious occurrence is the case where the user at the source peer invokes applications that heavily use bandwidth such as Email clients, online games or other P2P applications. By doing so, the bandwidth available for the client connected to that machine may be drastically reduced and become significantly unstable. Recent studies confirm that the major factor that has direct impact on QoS in P2P networks in the behavior of users at the source peers [21, 28]. This behavior leads to fluctuational rate of packets for the client peer which might be reflected by a reduced download rate in file sharing networks or latencies, delays, hiccups and freezes in streaming P2P networks. As we were interested in a deeper understanding of what kind of protocols or applications are responsible for upstream load in peers, we installed Darwin [2] and VideoLan [13] streaming servers on 10 different home machines with DSL links and broadcasted from each of these machines to our client machine separately. In parallel, each of these machines were running the applications that were installed on them and used regularly. Using a software based sniffer [14], we captured the packets in the uplink and the downlink of each of these machines in a time frame of 24 hours, and then analyzed the log. We first calculated the streaming throughput received from each machine while there are no other processes running in parallel. Then we allowed the users of these machines to use them regularly and we checked what protocols and processes were running when the average throughput of the streaming was reduced. In Figure 1 we present the applications that degraded the streaming throughput the most and their fraction in the total time when the streaming’s quality was reduced. Over the time when we allowed these processes to run, we experienced lengthy latency, delay and hiccups. Notice that the top applications that affected streaming were P2P file sharing applications and mail clients that sent large attachments. Yet, other users might use other applications, therefore we can not rely on adjusting our solution for specific protocols, and an appropriate solution must face different user behaviors, different processes and protocols with no prior knowledge about the structure of protocols used by a specific user. In [24] we presented a solution for stabilizing the uplink
Figure 1. Top applications that affect streaming QoS and their relative fraction in time of P2P sources in file sharing networks, based on a special new role called Feeder. The key concept of Feeders is that we can use normal peers that are currently online and free to serve as a proxy cache for the benefit of a client peer that wishes to download a file. But unlike file sharing applications that are left running in the background even when the user is not actively using its computer, in streaming applications the situation is different. Streaming applications are running mostly when the user is actively using them. When the user is no longer interested in watching media content, the application is turned off, thus the chances of finding free peers that are connected to a streaming network are low. Thus there is a need for a solution that will address the problem of user behavior in streaming P2P networks and provide a mechanism that is able to perform the following: 1. Absorb the instability of source peers and allow stable throughput at the client side 2. Perform well on new protocols with no prior knowledge about protocol structure
4. Maxtream Maxtream is a machine learning based solution that actively predicts load in the uplink of streaming peers and coordinates source peers exchanges between peers that suffer from buffer underrun and peers that enjoy satisfactory buffer size for coping with future problems. Following is a detailed explanation of the key elements of the system.
4.1
Behavior Aware Streaming Concept and Mutual Source Exchange
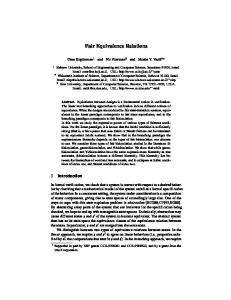
Figure 2 illustrates the concept of user behavior aware streaming. N1 ,N2 ,N3 ,N4 ,N5 and N6 represent nodes/peers in a streaming network. While there are numerous topologies for streaming networks such as trees or mesh based, we do not limit our design to a specific topology. As such, N1 , N2 and N3 are unnecessarily at the same level on the graph. Notice that the throughput that N3 provides to N5 is high and stable. This high throughput allowed N5 to fill its
buffer over time, therefore N5 is immune to network problems to some extent. The larger buffer N5 accumulated, the bigger problem it can absorb without affecting its user experience. Now let’s assume that due to earlier problems, N4 ’s buffer was reduced and is almost empty, such that its user can still watch a movie with no interruption, but a further problem in the future will empty the buffer and cause a hiccup. As can be seen on the link between N2 and N4 , N2 begins with providing a stable throughput for N4 , but later on at time tp − � the user at N2 opened a file sharing P2P software or any other process that consume upload bandwidth. A few seconds later, if nothing else happens, at time td the throughput between N2 and N4 will be dropped and become unstable due to the new software/process. In a regular streaming network - the buffer on N4 might get emptied as N4 does not have enough time to connect to an alternative source. Maxtream’s agent that runs on N2 , predicts at time tp that it will soon have to share it’s upload bandwidth with another process, therefore it immediately notifies N4 to replace a source. N4 then disseminates a request for source to his neighbor peers. N5 receives N4 ’s request and since its buffer is full, it has a better chance to absorb the drop in throughput of N2 without completely emptying its buffer; therefore N4 and N5 exchange sources, thus N4 did not experience a hiccup. In case that the drop in the upload throughput of N2 will not recover, in time, N5 ’s buffer will continue emptying as well, and when reached to a level that requires action, N5 will disseminate a request for an alternative source from another peer that gain a large buffer, or even switch sources with N4 again if in the meantime N4 managed to gain a large buffer. In our experiments, we disseminated the request for alternative sources using a Gnutella like approach - by sending the request to the peer’s neighbors, the neighbors forward the request to their neighbors and the mechanism continues in this manner up to a certain predefined radius. Among the peers that receive the request, the peers that are potentially suitable are the peers that already filled their buffer enough to cope with a temporal drop. This approach also preserves the scalability of the networks as the changes in the network’s topology are local. Yet, this Gnutella like approach can be switched with any other message passing mechanism that already exists on each P2P network.
4.2
Faulty Source Hopping
The key motivation for mutual source exchange in Maxtream is the potential of a ”strong” peer (one that has enough cache or buffer size) to absorb problems in sources that experience a temporal drop in their throughput. As we mentioned above, if the drop in throughput lasts long enough to
Figure 2. Maxtream concept chart endanger the buffer of the previously strong peer, a second source exchange will be needed. Moreover, while the drop still exists - the ”faulty” source travels between ”strong” peers. Yet, if the drop does not recover eventually, we are not interested in it as a source as it only empties its client peers’ buffers. Thus, we need a mechanism that will limit the journey of a faulty source. An optional solution for this problem is by ”pushing” the faulty source to the borders of the network’s topology - for example, in a tree based network, we wish this source to eventually become a leaf and cease to serve as a source. Similarly, in a mesh we are interested to push faulty sources to the bounds of the network. We use a counter that counts the exchanges of each source due to drops in a given time frame and in case it crossed a predefined threshold we move the fault source one level below in the tree (or one step towards the bounds in a mesh) and reset the counter. If the drop continues, eventually the faulty source will become a leaf.
4.3
Monitoring Module
The monitoring module is responsible for collecting data for the learning module. It acts as a packet sniffer for both inbound and outbound links and logs packet arrival time, header and payload. While the monitoring is done as a background process, we only log information in a database for a limited time - while we actually try to learn. This time should be sufficient to gain enough information so that the user behavior can be predicted in the future, given a set of measurements. For the average user, our experience showed that logging along one full day is sufficient. We recommend re-running the learning process from time to time, in order to adapt to the user’s new habits and trends.
4.4
Learning Module
The learning module extracts the data that was collected by the monitoring module into sets of features and values for the learning algorithm. In the heart of this module we
Figure 3. Load Vicinity Pattern Prediction run a Support Vector Machines (SVM) [30] classification algorithm, yet the assembly of feature:value pairs is not straightforward as we elaborate here. We wish our learning algorithm to link the collected data to the occurrences of traffic load in the uplink. As illustrated in Figure 3: S1 ,S2 and S3 are sessions. A session is identified by source IP and port, and destination IP and port, thus it begins with the first packet that was sent between our peer i on port x and a peer j on port y and ends with the last message that was sent between the same peers on the same ports. If the time between 2 sequential messages is larger than a specific predefined threshold, we see it as 2 sessions. Notice that sessions might overlap as in sessions S1 and S2 but still we can identify the session of a packet using the key of IPs and ports. V1 , V2 and V3 are the vicinities of S1 ,S2 and S3 respectively. A vicinity is a collection of packets that were collected around a predefined time period at the beginning of each session. Notice that the vicinity begins a few milliseconds before the beginning of a session. In session S4 and its vicinity V4 we show the change in uplink utilization due to that session. Notice that typically, the load in the uplink begins a few seconds after the beginning of a session and not immediately, as in most P2P algorithms the very first messages are used for preliminary negotiation, thus we can use the packet P3 and its neighbors to predict the upcoming load and still have enough time to notify the client about it. In some protocols, packets that are in the vicinity but precede the session like P2 can tell us about the upcoming load due to some negotiation between the peers or between a peer to its supernode. Maxtream’s key strategy is that we can predict a traffic load by examining the properties of packets that precede the load - meaning the packets in the vicinity of sessions that loaded the uplink. Following we present different properties that proved to be significant for prediction and their extraction algorithm. 4.4.1
Load Vicinity Pattern Prediction
In this method we look at the first bytes (15 bytes were found to be effective) of the payload of each packet that is in the vicinity and extract feature:value pairs for SVM so it can learn specific patterns. For example, in eMule’s clientclient protocol, the 1st byte is always 0xE3 and in the hand-
shake message the 6th is always 0x01; we mark them as Byte:Value pairs that form a pattern: 1:0xE3, 6:0x01. We’d like SVM to realize these patterns out of the messages in the vicinity. Since close values such as 1:0xE3 and 1:0xE4 might belong to completely different protocols or different messages of the same protocol, we can’t present SVM these values directly as it will not relate them as discrete values. Therefore, we collect the most popular byte:value instances of packets in the vicinities of all sessions while giving priority to byte:value pairs that appear in different sessions. Notice the algorithm pseudocode in Figure 4. First, we run over all packets in the log of captured network activity PacketLog over a predefined time frame (24 hours in our experiments). We gather packets with the same source IP and port and destination IP and port into a session and store the accumulated byte count of packets’ payload in a session list - SessionList. Short sessions are deleted from the list as they do not indicate a significant traffic that might threat the available throughput in the uplink. Then, we look for packets that reside in the vicinity of the beginning of long sessions. In the algorithm it appears that we look only for one session for simplicity, yet in our experiments we addressed all sessions that begin in the vicinity of a packet, as there might be more than one. As can be seen in Figure 3 we are interested also in packets that precede the beginning of a long session as they might indicate of an upcoming session. We create ByteValueList - a list that stores the counts of specific byte values in specific index of location in the packet’s payload. This will assist us in collecting the most popular Byte:Value instances that take part in a pattern that identifies one or more packets that precede traffic load. Notice that in case we have multiple instances of the same Byte:Value pair, we only relate to one instance, as we are interested in patterns that reside in as many sessions as possible and minimize the influence of a pattern that might have repeated itself in a specific session. Finally, as we supply the training set for SVM, each item in the training set contains the following features: Source IP, Source port, Destination IP, Destination port and then we create a feature per each of the top popular items in ByteValueList; i.e. if the most popular byte:value pair is 5:0xE3 and the value of the 5th byte of the packet we examine is 0xE3 then we insert 1:1 for the training item; if the second most popular byte:value pair is 3:0xB6 and the value of the 2nd byte of the packet we examine is 0xC2 then we insert 2:0 since the values are different and so forth for the next popular byte:value items, up to a certain amount of features (we found that the top 100 popular yield satisfactory results). We label as +1 training items that represent packets in the vicinity that contain at least one instance of the top popular byte:value pairs. We supply the training set also packets that are not in the vicinity and label them as -1. When we run the prediction module to look for upcoming loads in the up-
algorithm. SVM classifies it as either leading to uplink load or not. If SVM classified the packet as leading for load, we check if the uplink bandwidth is already larger than a predefined threshold, as we assume that if the uplink is hardly used there will be enough bandwidth for the new session without dropping our client’s needs. In case we already crossed the predefined threshold, we immediately notify the client to select a different feeder.
4.6
Figure 4. Extracting popular Byte:Value instances for building patterns link, we simply propose recent captured packets’ properties to SVM with the appropriate features and SVM classifies the packet as leading to uplink load or not. For differentiating between positive and negative labels, we feed SVM with additional randomly selected packets (not in the vicinity of the beginning of sessions) and label them as negative. 4.4.2
Packet Size Sequence Prediction
While looking at the data we captured in the beginning of sessions, we noticed an interesting phenomenon in P2P protocols - the byte count of the first packets form a sequence that repeats itself with minor differences for nearly all sessions of the same protocol. For example, a typical packet size sequence for eMule is {0, 0, 0, 125, 108, 11, 11, 41, 83, 77, 55, 55, 22}. Since we noticed some slight differences between separate instances of the sequence, we can’t use it as a serial set of features for SVM as in some cases the value of 108 in eMule might appear as the byte count of the 5th packet while in other cases it will be the byte count of the 6th packet due to an extra packet. Therefore, we relate these values as a histogram, and simply define a predefined number of features (we found 30 to yield good results) for the most popular byte count values in a similar manner to the previous algorithm. For example, if the most popular byte count is 125, we supply the training set a feature with a value of 1 or 0 if the vicinity of the examined packet contains at least one packet with this byte count. This technique is also applicable for obfuscated/encrypted protocols, as it does not rely on the packet’s payload.
4.5
Prediction Module
The prediction module’s function that runs on each peer is fairly simple: While packets are being captured, the properties mentioned above are extracted and served to the SVM
Motivation and Incentives
While the user has to install the Maxtream agent as part of an existing P2P service or as a solution pack, one might ask why should the user install it in the first place and what are the incentives for using it. The clear benefit of using Maxtream is that you receive QoS when you need it in response to your assistance for maintaining the QoS of others. It is also possible to look at Maxtream as a package being installed by friends, as in a social network, where the more friends you make, the better chance you can avoid experiencing hiccups while watching video content.
5. Results 5.1
SVM settings
We conducted our tests using SVM-Light library. We found that the Radial Basis Function (RBF) Kernel performed best for our experiments. RBF kernel - K(x, y) = 2 e−γkx−yk can map samples to higher dimensional space, thus unlike the linear kernel it can handle the case where the relationship between class labels and attributes in nonlinear. After experiencing with different γ and C values for various scenarios, we found that γ of 0.5 and C of 2 provided satisfying results. The price of running SVM in a home computer is not significant as the training phase can be run in time frames when the CPU is not busy. As for the prediction phase, we were able to maintain CPU utilization of under 10% while the prediction was running.
5.2
Streaming Experiment
We installed two machines - A and B with a proprietary streaming protocol and transmitted from A to a client machine C. All machines were connected to the Internet using a broadband connection of 1.5M bps download and 0.5M bps upload. While A trasmitted to C we initiated interruptions by running various applications (eMule, BitTorrent, Outlook mail client) at specific time periods using a predefined script at A. Notice that for all of our tests on eMule we used an obfuscated version. These applications were selected as they consume upload bandwidth. The file size we transmitted was movie file of 13M B that lengths 253 seconds. While the movie was playing in C we counted the hiccups that we experienced while watching the whole
Figure 7. Prediction rate of popular protocols Figure 5. Hiccups count per streaming buffer sizes under initiated interruptions
Figure 6. Streaming client’s throughput movie. We repeated this experiment with 2 different settings. In Figure 5 the Regular case represents a strategy where we collect cache in the streaming buffer up to the defined buffer size and then let it play regularly. In the Maxtream case we installed our agent on A and notified C to switch to B when our algorithm predicted an upcoming load in A. We limited the interruption time (by closing the applications after a few seconds) and in the case of Maxtream we instructed C to switch back to A in order to test the next interruption. As can be noticed, for the current settings and the given interruptions, on buffers larger than 100KB Maxtream experienced no hiccups, while the Regular case demanded much larger buffers of 800KB to reach a case of no hiccups. In Figure 6 we show the throughput received by the streaming client at C for the first minutes. Notice that on time t we activated the first interruption - by simply launching an eMule client at A. Notice that in the case of Maxtream, C predicted the upcoming load successfully and switched its source to B instead of A while maintaining a stable streaming throughput.
5.3
Prediction Accuracy
In Figure 7 we examined various protocols that use the upstream and Maxtream’s ability to predict an upcoming load per each protocol. We captured 5 hours of activity on each of these protocols separately. Then we mapped all large sessions (more than 1M B) and counted the cases where Maxtream predicted a large session successfully. Notice that in the fourth case, we ran all protocols on the same
Figure 8. Time between prediction and load machine for 5 hours, to examine the case where the vicinity contains messages of multiple protocols. In Figure 8 we measured the time between the prediction and the beginning of the load in upstream per each of the leading protocols. Notice that we have between 3 and 6 seconds to alert a client for replacing a source - which enables it to completely evade the upcoming load before it begins. In Figure 9 we experimented different vicinity sizes and measured the appropriate prediction success rate. The leading part of the vicinity (3r d of its size) is placed before the beginning of a session - to allow prediction using packets that might lead to a session (like an interaction between a peer and a supernode prior to the file transfer between peers). Notice that small vicinities of between 1 and 2 seconds do not consist enough information to predict an upcoming load with high success rate. In addition, vicinities larger than 4 seconds begin to create more noise than useful information for prediction and accordingly the prediction success rate degrades. Over all of our experiments we experienced minor false positive predictions of up to 2% of the total predictions.
6. Summary In this paper we presented Maxtream - a solution that addresses the problem of instability in streaming throughput due to user behavior. We employ machine learning algorithms that actively predicts load in the uplink of streaming peers and coordinates source peers exchanges between peers that suffer from buffer underrun and peers that enjoy satisfactory buffer size for coping with future problems. Our experiments show that it’s possible to predict uplink
Figure 9. Prediction rate per vicinity size load with high probability on popular protocols with no prior knowledge about the format of these protocols.
References [1] Alexa traffic rankings. http://www.alexa.com. [2] Darwin open source streaming. http://dss.macosforge.org/. [3] Ipoque internet traffic report. http://www.ipoque.com/userfiles/file/internet study 2007 abstract en.pdf. [4] Joost abandons p2p report in techcrunch. http://www.techcrunch.com/2008/12/17/joost-just-gives-upon-p2p/. [5] Joost bw problems report by dailyiptv. http://www.dailyiptv.com/features/joost-bandwidthproblem-082007/. [6] Joost bw problems report by newteevee. http://newteevee.com/2008/03/20/where-to-watch-marchmadness/. [7] Joost playback problems report by venturebeat. http://venturebeat.com/2008/11/28/joost-is-loosed-onthe-iphone-if-only-it-worked/. [8] Joost web site. http://www.joost.com/. [9] Napa-wine project technical report. http://www.napawine.eu/twiki/pub/public/documents/napa-abacus-wp3.pdf,. [10] Pplite glitches report. http://all-streaming-media.com/peerto-peer-tv/p2p-streaming-internet-tv-pplive.htm. [11] Pplive web site. http://www.pplive.com/en/index.html. [12] Sandvide internet traffic report. http://www.sandvine.com/general/documents/2008 global broadband phenomena - executive summary.pdf. [13] Videolan open source streaming. http://www.videolan.org/. [14] Windump tcpdump for windows, http://www.winpcap.org/windump/. [15] R. Beverly and M. Afergan. Machine learning for efficient neighbor selection in unstructured p2p networks. In SYSML’07: Proceedings of the 2nd USENIX workshop on Tackling computer systems problems with machine learning techniques, pages 1–6, Berkeley, CA, USA, 2007. USENIX Association. [16] R. Beverly, K. Sollins, and A. Berger. SVM learning of IP address structure for latency prediction. In SIGCOMM Workshop on Mining Network Data, Sept. 2006. [17] M. Castro, P. Druschel, A.-M. Kermarrec, A. Nandi, A. Rowstron, and A. Singh. Splitstream: high-bandwidth multicast in cooperative environments. In SOSP ’03: Proceedings of the nineteenth ACM symposium on Operating systems principles, pages 298–313, New York, NY, USA, 2003. ACM Press.
[18] L.-J. Chen, C.-F. Chou, and B.-C. Wang. A machine learning-based approach for estimating available bandwidth. In TENCON 2007 - 2007 IEEE Region 10 Conference, 2007. [19] H. Deshpande, M. Bawa, and H. Garcia-Molina. Streaming live media over peers. Technical Report 2002-21, Stanford InfoLab, 2002. [20] Z. Despotovic and K. Aberer. A probabilistic approach to predict peers performance in p2p networks. In In: 8th Intl Workshop on Cooperative Information Agents, pages 62–76. Springer, 2004. [21] T. Do, K. A. Hua, and M. Tantaoui. P2VoD: Providing fault tolerant video-on-demand streaming in peer-to-peer environment. In Proc. of the IEEE Int. Conf. on Communications (ICC 2004), jun 2004. [22] Y. Guo, K. Suh, J. Kurose, and D. Towsley. P2Cast: peer-topeer patching scheme for VoD service. In Proc. of the 12th Int. Conf. on World Wide Web, pages 301–309, 2003. [23] X. Hei, C. Liang, J. Liang, Y. Liu, and K. W. Ross. Insights into pplive: A measurement study of a large-scale p2p iptv system. In In Proc. of IPTV Workshop, International World Wide Web Conference, 2006. [24] S. Horovitz and D. Dolev. Collabory: A collaborative throughput stabilizer & accelerator for p2p protocols. In IEEE WETICE 4th International Workshop on Collaborative Peer-to-Peer Information Systems (COPS), 2008. [25] A. Horvath, M. Telek, D. Rossi, P. Veglia, D. Ciullo, M. A. Garcia, E. Leonardi, and M. Mellia. Dissecting pplive, sopcast, tvants. 2008. [26] T. Karagiannis, K. Papagiannaki, and M. Faloutsos. Blinc: multilevel traffic classification in the dark. In SIGCOMM ’05: Proceedings of the 2005 conference on Applications, technologies, architectures, and protocols for computer communications, New York, NY, USA, 2005. ACM Press. [27] V. N. Padmanabhan, H. J. Wang, and P. A. C. K. Sripanidkulchai. Distributing streaming media content using cooperative networking. pages 177–186, 2002. [28] R. Rejaie and A. Ortega. Pals: Peer-to-peer adaptive layered streaming. [29] D. A. Tran. Zigzag: An efficient peer-to-peer scheme for media streaming. In In Proc. of IEEE Infocom, 2003. [30] V. N. Vapnik. The nature of statistical learning theory. Springer-Verlag New York, Inc., 1995. [31] L. Vu, I. Gupta, J. Liang, and K. Nahrstedt. Mapping the pplive network: Studying the impacts of media streaming on p2p overlays. Technical report, August 2006. [32] K. Xu, Z.-L. Zhang, and S. Bhattacharyya. Profiling internet backbone traffic: behavior models and applications. SIGCOMM Comput. Commun. Rev., 35(4):169–180, October 2005. [33] L. Ying and A. Basu. pcvod: Internet peer-to-peer videoon-demand with storage caching on peers. In DMS, pages 218–223, 2005.