ii) Measurement of average and root mean square value of (Sinusoidal,
triangular ... Root Mean Square (RMS) Value: The RMS value of an alternating
current is ...
Kathmandu University Department of Electrical and Electronics Engineering BASIC ELECTRICAL LAB (ENGG 103)
EXPERIMENT 3:- MEASUREMENT OF AVERAGE AND RMS VALUE OF DIFFERENT SIGNAL WAVEFORMS Objectives: i) Familiarization with function of function generator and oscilloscope. ii) Measurement of average and root mean square value of (Sinusoidal, triangular and square) signal waveform. Materials and Equipments Required: 1. 2. 3. 4. 5.
Digital multi-meter Function Generator Breadboard Probes [3] Resistors ( 1K, 10K)
Theory: In alternating current (AC, also ac) the movement (or flow) of electric charge periodically reverses direction. An electric charge would for instance move forward, then backward, then forward, then backward, over and over again. In direct current (DC), the movement (or flow) of electric charge is only in one direction. Average value: Average value of an alternating current is expressed by that steady DC current which transfer across any circuit the same charge as is transferred by that AC during the same time period. Root Mean Square (RMS) Value: The RMS value of an alternating current is expressed by that steady DC current which when flowing through a given circuit for given time produces same heat as produced by that AC through the sane circuit for the same time period. In the common case of alternating current when I(t) is a sinusoidal current, as is approximately true for mains power, the RMS value is easy to calculate from the continuous case equation above. If we define Ip to be the peak current, then in general form
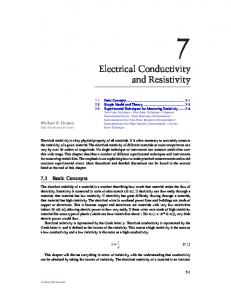
Where t is time and ω is the angular frequency (ω = 2π/T, where T is the period of the wave). For a sinusoidal voltage, . ,
The factor
is called the crest factor, which varies for different waveforms. For a triangle
wave form centered about zero.
For a square wave form centered about zero
Circuit Diagram:
Fig 1. Circuit connection Procedure: 1. Connect the circuit as shown in the circuit diagram of fig. 1. 2. Set the value of frequency in 100 Hz in the function generator. 3. Adjust the ground of channel 1 and 2 of Cathode Ray Oscilloscope and then set it into DC mode. 4. Connect CRO across the load in DC mode and observe the waveform. Adjust the DC offset of function generator. 5. Note down the amplitude and frequency. 6. Set the multimeter into AC mode and measure input voltage and voltage across point AB. This value gives RMS value of sinusoidal AC. 7. For average voltage measurement set multimeter into DC mode and measure voltage. 8. Repeat experiment for different frequency and different peak to peak voltage. 9. Measure the RMS and Average value of DC signal also where instead of function generator you can use DC supply. NOTE: Multimeter is designed to measure the RMS value of sinusoidal signal only so there can be slight error while measuring RMS value of different signals.
Observations: i) Draw the waveform of voltage across resistor 10 KΩ for (Sinusoidal, Triangular and Square wave input of 1 KHz with peak to peak voltage 6V.
T/4
T/2
3T/4
T
5T/4
3T/2
7T/4
2T
Figure 1: Waveform from function generator (Sine wave)
i) ii) iv)
Peak to Peak Value:……………………. Peak Value: ……..…………….iii) Average Value ………………………. RMS Value:…………..., (from calculation) ……………..( from measurement)
T/4
T/2
3T/4
T
5T/4
3T/2
7T/4
2T
Figure 2: Waveform from function generator (Square wave)
i) ii) iv)
Peak to Peak Value:……………………. Peak Value: ……..……………………..iii) Average Value ………………….. RMS Value:…………..., (from calculation) ……………..( from measurement)
T/4
T/2
3T/4
T
5T/4
3T/2
7T/4
2T
Figure 3: Waveform from function generator (Triangular wave)
i) ii) iv)
Peak to Peak Value:……………………. Peak Value: ……..……………………..iii) Average Value ………………….. RMS Value:…………..., (from calculation) ……………..( from measurement)
T/4
T/2
3T/4
T
5T/4
3T/2
7T/4
2T
Figure 4: Waveform from function generator (Pulsating DC waveform)
i) ii) iv)
Peak to Peak Value:……………………. Peak Value: ……..……………………..iii) Average Value ………………….. RMS Value:…………..., (from calculation) ……………..( from measurement)
Table 1: Measurement of average and RMS voltage for AC signal. Type of Waveform Sinusoidal Peak voltage (Input)
Frequency
2V 4V 6V 2V 4V 6V 2V
100 Hz 100 Hz 100 Hz 1000 Hz 1000 Hz 1000 Hz 10 KHz
4V
10 KHz
6V
10 KHz
Avg.
Square
RMS
Avg.
Triangular RMS
Avg.
RMS
¾ Measure the RMS voltage across 10K resistor and 1K resistor Peak voltage (Input)
V1= Peak Voltage across 1K V2= Peak Voltage across 10 K resistor resistor
2V 4V 6V 8V
Table 2: Measurement of average and RMS voltage for DC signal. Type of Waveform Pure DC Peak voltage (Input) 2V 4V 6V
Avg.
RMS
Pulsating DC Pulsating (Sinusodial) (Square) Avg. RMS Avg.
DC RMS
Conclusions and Inference: ………………………………………………………………………………………………… ………………………………………………………………………………………………… ………………………………………………………………………………………………… ………………………………………………………………………………………………… ………………………………………………………………………………………………… ………………………………………………………………………………………………… ………………………………………………………………………………………………… ………………………………………………………………………………………………… ………………………………………………………………………………………………… ………………………………………………………………………………………………… ………………………………………………………………………………………………… ………………………………………………………………………………………………… ………………………………………………………………………………………………… ………………………………………………………………………………………………… ………………………………………………………………………………………………… ………………………………………………………………………………………………… ………………………………………………………………………………………………… ………………………………………………………………………………………………… ………………………………………………………………………………………………… ………………………………………………………………………………………………… ………………………………………………………………………………………………… ………………………………………………………………………………………………… ………………………………………………………………………………………………… ………………………………………………………………………………………………… ………………………………………………………………………………………………… Exercises: 1) Calculate the RMS value (using integration approach) for (any one peak value) of sinusoidal square and triangular wave. 2) For same peak to peak value which signal has highest RMS value? 3) Which signals have same RMS and peak value? 4) Which signal has same RMS and average value? 5) Verify the voltage divider rule for resistive circuit.
Instructor’s Signature
Performance Date
Submission Date