:
Measuring and Enhancing Prediction Capabilities of Vulnerability Discovery Models for Apache and IIS HTTP Servers Omar H. Alhazmi and Yashwant K. Malaiya Colorado State University omar|
[email protected] quantitatively in a systematic manner. A study by Ford et al. [1] has compared several servers, the number of vulnerabilities and the associated severity levels. This study identifies a need to develop tools for estimating the risks posed by vulnerabilities. The two major software components of the Internet are an HTTP (Hyper Text Transfer Protocol) server, also termed a web server, and the browser, which serves as the client. Both of these were first introduced in 1991 by Tim Berners-Lee of CERN and they have now become indispensable parts of both organizational and personal interactions. The early web servers provided information using static HTML pages. The web server now provides dynamic and interactive services between the server and client using database queries, executable script, etc. The web server is able to support functions such as serving streaming media and mail. An HTTP server has thus emerged as a focal point for the Internet. In this paper we examine the vulnerabilities in the two most widely-used HTTP servers, the Apache server and the Microsoft IIS (Internet Information Service), both introduced in 1995. While Apache has a much larger overall market share, roughly 70%, IIS may have a higher share of the corporate websites. The market share for other servers is small and thus they are not examined here. IIS is the only HTTP server that is not open-source. Both Apache and IIS are generally comparable in features; however, IIS runs only under the Windows operating systems, whereas Apache supports all the major operating systems. IIS 2.0 was supplied as part of the NT 4.0 operating systems. The next version, IIS 3.0, was followed by IIS 4.0, the most popular version. After that, IIS 5.0 was embedded in Windows 2000; recently, IIS 6.0 was separated from Windows 2003 and is available as an independent application. The security of systems connected to the Internet depends on several components of the system. These include the operating systems, the HTTP servers and the browsers. Some of the major security compromises arise because of vulnerabilities in the HTTP servers. A vulnerability is defined as “a defect which enables an
Abstract The prediction of the number of vulnerabilities in an HTTP server can allow us to evaluate the security risk associated with its use. Vulnerability discovery models have recently been proposed which can be used to estimate the future number of vulnerabilities expected to be discovered. A detailed analysis of the prediction capabilities of two models termed AML and LVD for the vulnerabilities in the two major HTTP servers is presented. Four complete data sets for Apache and IIS are used, representing an open source and a commercial web server respectively. Both long term predictions involving several years and short term predictions for the following year are considered. Potential methods for enhancing the prediction accuracy are considered. The results show good predictive capabilities of the AML model when constraints are used for estimating the model parameters. The LVD model works well in some special cases when saturation has not yet set in. The results can be used by both developers to plan the test and maintenance effort needed and by users to assess the potential security risks associated with a specific server.
1. Introduction To assure an acceptable degree of security for a web server the developers need to determine how much testing for security vulnerabilities is needed. Moreover, developers need to be able to project the post-release vulnerability discovery rate to plan the maintenance and patch development effort needed. The available data can be fitted to the Vulnerability discovery models (VDMs) to project the trend that the vulnerabilities discovery process is likely to follow. There has been considerable discussion of the security of web servers in recent years. However, investigations have focused on qualitative issues related to detection and prevention of individual vulnerabilities. Quantitative data is sometimes cited, but without any significant critical analysis. Methods need to be developed to allow security related risks to be evaluated
1
:
attacker to bypass security measures” [2]. Vulnerabilities are a special class of defects that can permit circumvention of security measures. The vulnerabilities found are disclosed by the finders using some of the common reporting mechanisms available in the field. The databases for the vulnerabilities are maintained by organizations such as the National Vulnerabilities Database [3], MITRE [4], Bugzilla [5], BugTraq [6], as well as by the developers of the software. The exploitations of some of the server vulnerabilities are well known. The Code Red worm [7], which exploited a vulnerability in IIS (described in Microsoft Security Bulletin MS01-033, June 18, 2001), appeared on July 13, 2001, and soon spread world-wide in unpatched systems. All the computing systems connected to the network are subject to some security risk. While there have been many studies attempting to identify causes of vulnerabilities and potential counter-measures, the development of systematic quantitative methods to characterize security has begun only recently. There has been considerable debate comparing the security attributes of open source and commercial software [8]. However, for a careful interpretation of the data, rigorous quantitative modeling methods are needed. The likelihood of a system being compromised depends on the probability that a newly discovered vulnerability will be exploited. Thus, the risk is better represented by the not yet discovered vulnerabilities and the vulnerabilities discovery rate rather than by the vulnerabilities that have been discovered in the past and remedied by patches. Possible approaches for a quantitative perspective of exploitation trends are discussed in [9], [10]. Probabilistic examinations of intrusions have been presented by several researchers [11]. In [12], Rescorla has studied vulnerabilities in open source servers. The vulnerabilities discovery process in operating systems has just recently been examined by Rescorla [13] and by Alhazmi and Malaiya [14][15][16]. Servers are very attractive targets for malicious attacks because they represent the first line of defense that, if bypassed, can compromise the integrity, confidentiality and availability attributes of the enterprise security. Thus, it is essential to understand the threat posed by both undiscovered vulnerabilities and recently discovered vulnerabilities for which a patch has not been developed or applied. In this paper we address questions such as: How can we predict the vulnerabilities not yet discovered? How accurate are these estimations? We also consider methods for enhancement of the prediction capabilities. At this time, despite the significance of security in the HTTP servers, very little quantitative work has been done to model the vulnerabilities discovery process for the servers. Such work would permit the developers and
the users to better estimate future vulnerabilities discovery rates. Use of reliability growth models is now common in software reliability engineering [17][18]. SRGMs take into account the fact that as bugs are found and removed, fewer bugs remain. Therefore, the bug finding rate gradually drops and the cumulative number of bugs eventually approaches saturation. Such growth models are used to determine when a software system is ready to be released and what future failure rates can be expected. Some vulnerability discovery models were recently proposed by Anderson [8], Rescorla [12], Ozmont and Schechter [19] and Alhazmi and Malaiya [14]. The applicability of these models to several operating systems was examined in [20]. The results show that while some of the models fit the data for most operating systems, others do not fit well or provide a good fit only during a specific phase. The next section previews the vulnerability discovery models used. We then consider the total number of vulnerabilities in the two versions of two HTTP servers and examine how well the models fit the available data. Afterwards, we will examine the goodness of fit of the two models on all data sets. In the following sections we will evaluate the prediction capabilities using those datasets and examine some enhancements that can improve the accuracy of predictions. Lastly, we will discuss the major observations and present the conclusions.
2. The Vulnerability Discovery Models Here we investigate the applicability of two vulnerability discovery models for HTTP servers. The models used are a logistic model and a linear model proposed by Alhazmi and Malaiya [14][17]. These two models have been found to fit datasets for several of the major Windows and Linux operating systems, as determined by goodness of fit and other measures. The logistic model considers the three phases of vulnerabilities discovery, including the effect of the rising and declining market share on the software. The second model can be viewed as a simplification of the logistic model with fewer parameters and easier applicability. The Alhazmi-Malaiya Logistic Model (AML) assumes that the rate of change of the cumulative number of vulnerabilities Ω is governed by two factors, as given in Equation 1 below [14]. The second factor declines as the number of remaining undetected vulnerabilities declines. The first factor increases with time to take into account the rising share of the installed base. The saturation effect is modeled by the first factor. It is possible to derive a more complex model; however, this model provides a good fit to the data, as shown
2
:
The LVD can also be considered an approximation of the AML model, when there is no saturation and the learning phase is negligible. A few other vulnerability discovery models have been proposed, however these two have been found in the past to fit the data best [16], thus only these two models are considered here.
below. Let us assume that the vulnerabilities discovery rate is given by the differential equation:
dΩ = AΩ( B − Ω) , dt
(1)
where Ω is the cumulative number of vulnerabilities, t is the calendar time, and initially t=0. A and B are empirical constants determined from the recorded data. By solving the differential equation, we obtain B , (2) Ω (t ) = BCe − ABt + 1 where C is a constant introduced while solving Equation 1. Equation 2 gives us a three-parameter model given by the logistic function. In Equation 2, as t approaches infinity, Ω approaches B. Thus, the parameter B represents the total number of accumulated vulnerabilities that will eventually be found. As Figures 1 to 4 show, the model has an s-shape and it displays three phases, the initial learning phase, the middle linear phase and the final saturation phase. Available data for some systems [14] [15] suggest that the early learning phase is sometimes negligible. This may be due to the similarity between the new release and its prior version, which results in a shorter learning phase for the testers to become familiar with the new release. Moreover, it has been observed that during the saturation phase, the vulnerabilities discovered in the next version include vulnerabilities shared with the modeled version. This can prolong the linear trend even though an increasing market share is taken by the newer version. The AML model has three parameters causing some instability of the estimated parameter values. This instability can be reduced by applying a constraint requiring the duration between the two transitions points within some limit. This computational approach termed AML constrained (AML-C). The duration has been shown to be 2.63/AB for the AML model [20]. Hence, we can limit 2.63/AB between some minimum and maximum values chosen using the values from previous software systems. This constraint assumes that the transition points are within the time-frame of the expected lifetime of the software, thereby enforcing the S-shape and anticipating the two transition points. The Linear Vulnerability Discovery model (LVD) is another example of time-based vulnerability discovery models. The LVD model assumes that the rate of change is constant. It is simpler than AML because the LVD model has one main parameter, slope S, which represents the vulnerabilities discovery rate, in addition to a constant k. Ω is given by [16].
Ω(t ) = k + St
3. Modeling Vulnerabilities in HTTP Servers In this section, the datasets for the total vulnerabilities of the Apache and Microsoft IIS web servers are fitted to the two models and the goodness of fit is evaluated to determine how well the models reflect the actual vulnerabilities discovery process. The vulnerability dataset were extracted from the National Vulnerabilities Database [3] maintained by NIST and from Mitre Corporation [4], whereas the market share data is from Netcraft [21]. We have used data for Apache 1 and 2 representing open source software and two versions of IIS 4 and 5 representing two versions of closed source software. The total number of vulnerabilities found in the four versions is shown in Table 1. It should also be noted that the number of vulnerabilities, either found or estimated as remaining, should not be the only measurement of a security threat. Factors such as patch development, application delays and vulnerabilities’ exploitation rates also need to be considered. Table 1. Market share, Number of vulnerabilities and release dates of some web servers Apache
IIS
First Release
1995
1995
SJSWS (SunOne) 2002
Market Share
69.7%
20.92%
2.53%
Version
1.x
2.x
4.0
5.0
Up to 6.1
Vulnerabilities
58
45
85
73
3
Zeus 1995 0.78% Up to 4.3 5
3.1 Web server market share Market share is one of the most significant factors impacting the effort expended in exploring potential vulnerabilities. Higher market share offers a greater incentive to explore and exploit vulnerabilities because attackers will obviously find it more profitable or satisfying to spend their time focusing on a software system having a greater market share. Table 1 above presents data obtained from NVD and Netcraft, showing the current web server market share and total number of vulnerabilities found to date. As we can see from the table, for servers with a lower percentage of the market, such as Sun Java System Web
(3)
3
:
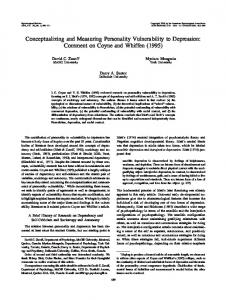
Server (SJSWS) and Zeus, the total number of vulnerabilities found is low. This does not mean that these systems are vulnerabilities-free, but merely that only limited effort has gone into detecting their vulnerabilities. A significant number of vulnerabilities have been found in both Apache and IIS, illustrating the impact of the market share on the motivation for exploring and finding undiscovered vulnerabilities. Apache and Microsoft IIS dominate the web server market, while other web servers such as Sun Java System Web Server and Zeus occupy a very small share of the market, as shown in the Table 1 above . The Apache HTTP server was first released in mid 1995. Since then it has gained wide popularity and is used by over 50 million web server systems. Apache dominates the market, probably because it is an open source system that is free. Apache may also have benefited from not having been exposed to serious security issues such as the Code Red [7] or Nimda worms that were faced by IIS in 2001. In this section, we fit the vulnerabilities data for Apache to the Alhazmi-Malaiya Logistic model (AML) and to a linear model (LVD). Figure 1 gives the vulnerabilities data obtained from NVD [3] for the period between March 1996 and December 2005.
Figures 1 to 4 show the data fitted to the model using the least square fit. For Chi-squared goodness of fit test, we chose an alpha level of 5%; χ2 test results are shown in Table 2 and Table 3. This table shows that all data sets have fitted the AML model with P-value > 0.991. The values of the parameter A range from 0.0008 to 0.002, and for C they range from 0.18 to 0.70. The parameter B corresponds approximately to the number of vulnerabilities. Apache 1 70
Vulnerabilties
AML
LVD
60
Vulnerabilities
50 40 30 20 10 Mar-05
Mar-04
Mar-03
Mar-02
Mar-01
Mar-00
Mar-99
Mar-98
Mar-97
Mar-96
0
Figure 1. Apache 1.x Vulnerabilities Data Apache 2
50 45
3.2 Goodness of fit analysis for Apache and IIS
AML
LVD
40 35 30 25 20 15 10
Vulnerabilities
Figure 1 shows Apache 1.x (which includes subversions 1.0 through 1.3) vulnerabilities fitted to the AML model and the LVD model, clearly showing that the AML follows the date very closely and has fitted with much less error than the LVD model. However, in, Figure 2 the Apache 2.x data set is shown to fit both models equally well. Figure 3 and Figure 4 show the fit for the two models for IIS 4 and 5 respectively. Apache 2 (including subversions through 2.1) appears to be in the linear phase, since the number of vulnerabilities still appears to be growing linearly. Despite having been on the market for several years, Apache 2 and even Apache 1 have not reached a clear saturation phase, possibly because of their larger market share. Moreover, the number of systems using the Apache web server is still increasing; indicating that vulnerabilities discovery for Apache can be expected to continue at a significant pace in near future. On the other hand, the IIS web server appears to have reached the saturation phase. During the past several months, the vulnerabilities discovery rate for IIS has dropped to a very low point. A possible explanation for this can be that the number of IIS web servers installed appears to be stationary, unlike the Apache server which is still gaining in terms of new installations. Another possibility is that the number of remaining undiscovered vulnerabilities may actually have dropped significantly.
Vulnerabilties
M
ar -0 Ju 2 n0 Se 2 p0 D 2 ec M 02 ar -0 Ju 3 nSe 0 3 pD 03 ec M 03 ar -0 Ju 4 n0 Se 4 p0 D 4 ec -0 M 4 ar -0 Ju 5 n0 Se 5 p0 D 5 ec -0 5
5 0
Figure 2. Apache 2.x Vulnerabilities Data Table 2. Goodness of Fit Tests Results for AML Apache 1 Apache 2 IIS 4 IIS 5
A 0.00083 0.002014 0.001106 0.001488
B 64.160 48.05 84.313 72.379
C 0.705 0.192 0.191 0.181
χ2 39.7 14.6 65.44 15.19
χ2critical 138.8 61.65 118.75 91.67
P-value 1 0.999995 0.991 1
The goodness of fit for the LVD model for the later versions Apache 2 and IIS 5 is significant, implying that the vulnerability discovery has not yet reached the saturation phase; whereas the data for the older versions Apache 1 and IIS 4 did not fit the LVD model. By observing the slope parameter we can see that the rate of vulnerabilities discovery given by the LVD model is higher for Apache 2 than Apache 1, and IIS 5 rate is higher than IIS 4.
4
:
values for the parameters. The parameters are used to obtain the estimated number of the total vulnerabilities (Ωi) at the end of the time period examined. The estimates of the numbers of vulnerabilities (Ω1, Ω2, Ω3… Ωn) are compared with the actual number of vulnerabilities (Ω) to evaluate the normalized estimation error (Ωi-Ω)/Ω. We then take the average of the normalized error magnitude values to obtain the measure of average error (AE). Average bias (AB) is similarly obtained when the sign of the error is also considered [22]. The average error (AE) and average bias (AB) are given by: 1 n Ωi − Ω (4) AE =
Table 3. Goodness of Fit Tests Results for the LVD Slope(S) 0.575 0.976 0.999 1.157
Apache 1 Apache 2 IIS 4 IIS 5
χ2 199.48 6.2 239.11 79.58
Constant(k) -7.986 1.386 9.342 6.664
χ2critical 138.8 61.65 118.75 91.67
P-value 0.0000001 1 3.99×10⁻¹¹ 0.227
IIS 4.0
120
Vulnerabilties
LVD
AML-C
Vulnerabilities
100 80 60
n
40 20
AB = Aug-05
Feb-05
Aug-04
Feb-04
Aug-03
Feb-03
Aug-02
Feb-02
Aug-01
Feb-01
Aug-00
Feb-00
Aug-99
Feb-99
Aug-98
Feb-98
0
Jul-05
Jan-05
Jul-04
AML-C
Jan-04
Jul-03
Jan-03
LVD
Jul-02
Jan-02
Jul-01
Jan-01
Jul-00
Jan-00
Vulnerabilities
IIS 5.0 Vulnerabilties
i =1
Ω
Ω −Ω 1 ∑ i n i =1 Ω n
(5)
where Ω is the actual number of vulnerabilities, while Ωi is the number of vulnerabilities predicted at time ti. We examine the accuracy of the predictions made using three approaches AML, AML-C and LVD. AMLC is the AML model with the constraint (21