A PORTAL DATA QUALITY MODEL FOR USERS AND DEVELOPERS (Research-in-progress)
Angélica Caro Department of Computer Science and Information Technologies University of Bio Bio, Chillán, Chile
[email protected]
Coral Calero and Mario Piattini Alarcos Research Group. Information Systems and Technologies Department UCLM-INDRA Research and Development Institute University of Castilla-La Mancha {Coral.Calero, Mario.Piattini}@uclm.es
Abstract. The measurement of the Data Quality is or should be a critical issue for Web portal users and developers. For the former, the evaluation of data quality is necessary as it ensures that the data obtained from a portal are appropriate for the use they need to put them to. For the latter, this represent the possibility of controlling whether their portal supplies data at a level of quality which satisfies its users and are thus able to obtain user preferences. Our research has led us to an awareness of these necessities, and as a result we have created a data quality model for Web portals (PDQM), which is orientated towards evaluating data quality from the perspective of the data consumer. This model can be used by both Web portal users and their developers. Part of this model has already been implemented through a tool (PoDQA), which is available at http://podqa.webportalquality.com. This paper presents the model that we have created, the tool, and its use by Web portal data consumers and developers.
Key words: Data Quality, Data Quality Model, Data Quality Assessment
INTRODUCTION A web portal (WP) is a site that aggregates information from multiple sources on the web and organizes this material in an easy user-friendly manner friendly manner friendly manner [26]. Numerous users worldwide use Web portals to obtain information for their work and to help with decision making. These users, or data consumers, need to ensure that the data obtained are appropriate for their needs. Likewise, the organizations that provide Web portals need to offer data that meet user requirements, thus helping these users to achieve their goals and to obtain their preferences. Therefore, data quality represents a common interest between data consumers and portal providers/developers. Over the past decade the number of organizations that provide Web portals has grown dramatically. These organizations provide portals that complement, substitute or extend existing services to their clients [27].
Data (or Information) Quality (DQ) is often defined as “fitness for use”, i.e., the ability of a collection of data to meet user requirements [2, 25]. This definition and the current view of assessing DQ, involve understanding DQ from the users’ point of view [15]. In recent years, several research projects have been conducted on the topic of Web Data Quality. However, there is still a lack of specific proposals for the DQ in Web portals which consider the data consumer’s point of view and tools that put these proposals into practice [9]. In our previous work we have created a DQ model for Web portals named PDQM (Portal Data Quality Model) which centres on the data consumer’s point of view [3, 4]. Together with this, and in order to put our model into practice, we have orientated our work towards the creation of a tool that implements it. We have thus created the first version of the PoDQA (Portal Data Quality Assessment) tool, available at http://podqa.webportalquality.com. PoDQA can be used by any user who wishes to discover the level of DQ in a Web portal and can also be used by any web portal developer who wishes not only to discover the DQ level of their portal but who also wishes to know how this level can be improved. This paper resumes our previous work and shows how PDQM, by means of PoDQA, measures the DQ in web portals and how it can be used by users and web portals developers. The organization of this paper is as follows. Section 2 describes the PDQM model. Section 3 describes the PoDQA tool. In Section 4 we explain how PDQM can be used by Web portal data consumers and developers. Finally, Section 5 shows our conclusions.
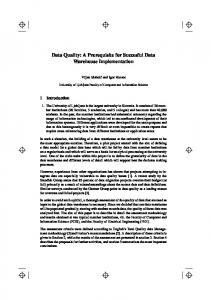
A WEB PORTAL DATA QUALITY MODEL (PDQM) PDQM is a data quality model for Web portals which focuses upon the data consumer perspective and, as is shown in Figure 1, its definition is based on three key aspects: Web DQ attributes, the Data consumer perspective, and the Web portal’s functionalities.
PDQM Web DQ Data Consumer Web Portals Attributes perspective Functionalities
Figure 1. Basis for the construction of PDQM Our first step was to consider that many DQ attributes can be found in literature which could be used to evaluate the DQ in Web portals. Concretely, our idea was to take advantage of previous work applied to the Web and extend it to Web portals 1 . Secondly, we have taken into account the fact that DQ cannot be assessed independently from the users who use data 2 , which is suggested by most of the authors who define the Data Quality concept as “fitness 1
It is important to point out that many of these proposals are based upon DQ proposals for information systems. Among these the best known and most frequently used is the Strong et al. framework [25]. 2 In the late 1990s, the most frequent definition of quality was that of meeting and exceeding customers' expectations [21]. The notion of quality as meeting expectations suggests that quality is defined by conformance to customers’ expectations.
for use” [2, 25]. We have thus centred our model on the data consumer perspective. To represent this perspective we have used a study developed by Redman [24], in which he establishes the DQ expectations of data consumers on the Internet. These expectations are grouped into six categories: Privacy, Content, Quality of Values, Presentation, Improvement and Commitment. Thirdly, we assume that data consumers judge DQ when using the functionalities provided by a Web portal. Thus, if we know the main functionalities of a Web portal these can guide us towards identifying which aspects of DQ are more important for data consumers when they assess the DQ. As basic functionalities of a Web portal we have used those proposed by Collins in [5]. These functions are as follows: Data Points and Integration, Taxonomy, Search Capabilities, Help Features, Content Management, Process and Action, Collaboration and Communication, Personalization, Presentation, Administration, and Security. Considering these three aspects as being essential, the PDQM was produced by defining a process which was divided into two parts (see Figure 2). In the first part we defined the theoretical version of our model, PDQM(t). The main goal of this part was to obtain a set of DQ attributes that can be used to evaluate the DQ in Web portals from the data consumers’ perspective. The second part consisted of the transformation of PDQM(t) into an operational model. The main goal of this part was to define a structure through which to organize DQ attributes by associating measures and criteria with them. In the following subsections we will briefly describe the construction of PDQM. To obtain more details about this, please consult our previous work in [3] and [4].
1.- Identification of Web DQ attributes
2.- Definition of a Classification Matrix
PDQM(t) Wang & Strong DQ Categories
1.- Definition of a criteria to organize the PDQM’s attributes 3.- Classification of DQ atributtes into the Matrix
4.- Validation
2.- Definition of the PDQM’s structure 3.- Preparation of PDQM to DQ assessment
DQ attributes Classified
Graph of the Bayesian Network
Bayesian Network
4.- Validation
PDQM(t)
First part: Theoretical Model
PDQM
Second part: Operational Model
Figure 2. The development process of PDQM.
Creating PDQM(t) The process used to generate the theoretical PDQM(t) model was made up of four phases (see Figure 2, left part). The aim of the first phase was to use previous literature to compile Web DQ attributes that were in our view pertinent to Web portals. For this we made a systematic review of the relevant literature [14] and we selected previous work proposed for different domains in the Web context (among them, Web sites [6, 13, 18], integration of data [1, 19], e-commerce [12], Web information portals [27], cooperative e-services [8], decision making [10], organizational networks [17] and DQ on the Web [9]). As a result of this we obtained a set of 100 DQ attributes that were summarized [3] as 41 DQ attributes. In the second phase, we created a matrix with which to classify the DQ attributes obtained in the previous phase. This matrix associates the two basic aspects considered in our model: the data consumers’
perspective by means of their DQ expectations on the Internet [24] and the basic functionalities offered in a Web portal [5]. Once the matrix was defined, we ticked the expectations applicable to each of the different functionalities of a Web portal. After this, in the third phase, we used the matrix to analyze the appropriateness of each Web DQ attributes identified in the first phase. This analysis consisted of assigning an expectation related to the DQ attributes that could be used by the data consumer to evaluate the quality of data in a portal to each functionality. For this assignment we used as a basis the appropriateness of each attribute (based on its definition), in relation to the objective of each portal functionality and the user’s DQ expectation. As a result of this phase, we obtained a set of 34 DQ attributes through which to evaluate the DQ in Web portals [3]. Figure 3 shows the matrix and an example of the classification of DQ attributes. Accessibility Currency Amount of data Understandability Relevancy Concise Representation
Understandability Concise Representation Consistent Representation
Figure 3. Example of classification of Web DQ attributes into the matrix Finally, in the fourth phase we validated the model obtained. To perform this task, we conducted a study by means of a survey. The purpose of this survey was to collect ratings of the importance for data consumers of each of the DQ attributes in PDQM(t). The survey questionnaire was composed of 34 questions, one for each DQ attribute. Each question was measured by using a 5-point Likert scale in which 1 signifies “Not Important” and 5 “Very Important”. We used a sample of student subjects for our survey which was made up of 70 masters students in the final-year (fifth) of Computer Science (all they with experience as web portal users). The total effective sample was 54, or 77% of the subjects that had initially been enrolled. We decided that DQ attributes that had a mean of 3 or more (considering the choices “moderately important”, “important” and “very important”) would be kept in the PDQM(t). All the others would be rejected. Thus, the final version of the theoretical PDQM is composed of 33 DQ attributes, see Table 1. Table 1. DQ attributes of PDQM. Attractiveness Accessibility Accuracy Amount of Data Applicability Availability Believability Completeness Concise Representation Consistent Representation Currency
Documentation Duplicates Ease of Operation Expiration Flexibility Interactivity Interpretability Novelty Objectivity Organization Relevancy
Customer Support Reliability Reputation Response Time Security Specialization Timeliness Traceability Understandability Validity Value added
More details about how we have attained this set of DQ attributes can be found in [3].
Second part: Operational Model In order to use PDQM in a DQ evaluation process, we needed to convert the theoretical model into an operational model. To attain this goal, we needed to define a structure that would allow us on the one hand to evaluate each attribute by using measures and, on the other hand, to combine attribute evaluations in order to obtain the portal data quality level. To carry out this conversion, we decided to use a probabilistic approach such as that proposed in [16]. This approach involves Bayesian networks (BN) and Fuzzy logic [4]. As is shown in Figure 2 (right part), a four-phase process was defined through which to convert PDQM(t) into an operational model. First, we defined a criterion with which to organize the DQ attributes and this allowed us to create a BN for PDQM by means of network “fragments” 3 [20]. We used the conceptual DQ framework proposed by Strong et al. as criterion [25]. This framework was originally defined for information systems and some aspects inherent to the Web context are not considered, specifically those concerning the role of systems. So, in our work the Accessibility category has been renamed as the Operational category in order to emphasize the importance of the role of systems not only with respect to accessibility and security but also to other aspects such as personalization, collaboration, etc. We then classified the DQ attributes of PDQM into these categories, thus obtaining a BN composed of four network fragments (one for each DQ category), which are the following fragments: DQ_Intrinsic, DQ_Operational, DQ_Contextual and DQ_Representational. In the second phase, we defined the relationships (direct influences) among the attributes in each fragment or DQ category. These relationships were established by using the DQ category and the DQ attribute definitions, together with our perceptions and experience. Our aim was to establish which DQ attribute in a category has direct influence over other attributes in the same category, and eventually over attributes in other categories. As a result of this phase, we obtained the graph of a BN which represents the structure for all the PDQM’s DQ attributes and which is composed of four network fragments, see Figure 4. Ease of operation
Traceability Reputation
Expiration
Objectivity
Amount of Data
Customer Support
Response Time
Flexibility
Reliability
Interactivity
Applicability
Timeliness
Novelty
Documentation Interpretability
Organization
Specialization Completeness
Duplicates
Accuracy
DQ_Intrinsic
Security Currency
Consistent Representation
ValueAdded
Accessibility
Believability Availability
Relevance
Validity
DQ_Operational
DQ_Contextual
Concise Representation
Understandability
Attractiveness
DQ_Representation
PDQ
Figure 4. Graph of the BN representing PDQM.
3
A Bayesian network can be built by starting from semantically meaningful units called network fragments [20]. A fragment is a set of related random variables that could be constructed and reasoned about separately from others fragments. Ideally the fragments must make sense to the expert who must be able to supply some underlying motive or reason for them belonging together.
Once the attributes of the PDQM had been organized into a BN, the third phase consisted of the preparation of the BN to assess the DQ in Web portals. Although our final objective is to create a comprehensive BN model for PDQM, we decided to work separately with each of the four fragments in the model. Thus, the following sub-phases were defined for the preparation of each fragment: a. If necessary, create synthetic nodes with which to simplify the fragment, i.e., to reduce the number of parents for each node. b. Define quantifiable variables for the entry nodes in the fragment. Each of these has an associated set of measures that evaluate the DQ attribute represented by the corresponding entry node. c. Define the node probability tables for each intermediate node in the fragment. This definition will depend upon the Web portal domain. We began by preparing the DQ_Representational fragment (see figure 5) for the DQ assessment in the domain of university web portals. Thus, the first version of the PDQM operational which is available can be applied in order to evaluate the representational DQ in university Web portals. Figure 5 shows the final graph of this fragment where: two synthetic nodes were created (Representational and Volume of Data), six quantifiable variables (indicators) were created for the entry nodes (LCsR, LCcR, LD, LAD, LI and LO) and in which some probability tables (defined by experts) for the intermediate nodes were included. Using the operational model previously defined as a base, the evaluation of the representational DQ in a portal is developed in the following manner. First all of the measurements which have been defined in the portal to be evaluated, along with the indicators which have been defined, will be calculated. Each indicator will take on a numerical value of between 0 and 1 (with a number of possible values that may be infinite), which will in their turn be transformed into discrete variables so as to ease the definition of probabilities. This transformation will be done using fuzzy logic [16] (we have defined a membership function for each indicator which transforms the value of the indicator into a set of probabilities, each of which corresponds to a label/class, for example, Low, Medium, High). Thus, the values of each indicator will be transformed into a set of probabilities that will constitute the evidence for the BN. By means of the probability tables these evidences will be propagated, via a causal link, from the parent nodes to the child nodes in the entire network until the level of representational DQ is obtained. This level will be created for the BN as a set of probabilities associated with the corresponding label (Low, Medium, and High). LAD LD Indicators that return numerical value for the input-nodes:
Probability Table of Volume of data Documen tation Amount of Data
Documentation
LCcR
Bad
Medium
Good
Amount of Data
Bad Medi Good Bad um
Medi Good Bad um
Bad
0.9
0.3
Medium
0.09 0.15 0.3
0.15 0.4
0.25 0.3
0.25 0.09
Good
0.01 0.05 0.2
0.05 0.3
0.6
0.6
0.8
0.5
0.8
0.15 0.5 0.2
Medi Good um 0.15 0.01 0.9
LI
LCsR Concise Representation
Volume of Data
LO
Interpretability
Consistent Representation
Organization
Understandability Attractiveness
Representation Probability Table of Consistent Representation LCsR
Low
Medi High um
Bad
0.8
0.08 0.04
Medium 0.12 0.8 Good
0.14
DQ_Representational
0.08 0.12 0.82
Organiza tion
Bad
Medi Good um
Low
0.7
0.12 0.02
Medium
0.22 0.8
High
0.08 0.08 0.65
0.33
Figure 5. BN of the fragment Representational DQ. Once the preparation of the operational model had been completed, the fourth phase in its construction consisted of the validation of PDQM. We therefore developed several experiments which allowed us to
compare the DQ assessment of a group of web portal data consumers with the DQ assessment of PDQM. Based on these results we adjusted our model until it was stable. More details about how we attained the operational PDQM can be found in [4].
PODQA TOOL PoDQA (Portal Data Quality Assessment) is the tool which is used to implement PDQM. We have built this tool in order to achieve three objectives: (1) to validate and to demonstrate the applicability of PDQM in the DQ evaluation of Web portals, (2) to demonstrate that it is effectively representative of the data consumer perspective and (3) to make the PDQM accessible to Web portal data consumers. Additionally, we have created a functionality to be used by Web portal developers. At this moment, PoDQA implements a sub-part of PDQM, the Representational DQ fragment within the context of university Web portals. PoDQA is available at http://podqa.webportalquality.com. The PoDQA tool was built by using a 3-tiered architecture to separate the presentation, application (business), and storage components, using Visual Basic .NET technology (see Figure 6). By means of the presentation tier the tool provides an interface for the users which allows them to carry out two tasks: users can start an evaluation process and can seek information about the previous evaluations. The application tier is composed of two sub-applications. The first calculates the measures defined in the given portal, stores the results in the database, generates the inputs for the second sub-application and notifies the user when the evaluation process is finished. The second sub-application loads the appropriate BN (corresponding to the Web portal domain), obtains the DQ score and sends the final results to the first sub-application to be stored. Finally, the data tier corresponds to the database in which the results of different evaluations and the tool’s management data, are stored. Website application Users
Console application VB
ASP.NET Measurements
INTERFACE
DataBase Bayesian Network
Presentation
Application
Storage
Figure 6. The PoDQA architecture
The main functions of PoDQA are: (1) to calculate the DQ level in a given Web portal; in order to do this the tool downloads the pages of the Web portal, applies the defined measures and calculates its level of DQ with the corresponding BN, (2) to give the user information about the DQ level in a given Web portal, and (3) to generate DQ rankings in a given Web portal domain. The portal evaluation is made by considering the domain to which it belongs. Thus, for each evaluation the user will have to specify the portal’s URL and its domain. The tool uses the domain given to select the appropriate BN. The differences between one domain and another are given by the definition of the probability tables. In order to obtain the score of the Representational DQ in a given Web portal PoDQA takes the following steps: first, it calculates the measures associated with the quantifiable variables in the model: LCsR, LCcR, LD, LAD, LI, LO; second, the values obtained for each indicator are transformed into a set of probabilities for the corresponding entry node in the BN; third, the probabilities are entered in the BN to obtain the level of the Representational DQ; and finally, the user is sent an e-mail informing him/her that
the results of the evaluation are available on the PoDQA website. graphically.
Figure 7 shows this process
User
Automatic
Values between 0 and 1
Probabilities for Probabilistic entry nodes classifier
Bayesian Network
Web Portal
User Valuations
Fuzzy Logic
URL
Calculus of Measures
e-mail
Probabilistic Calculus
DQ scores
Figure 7. The DQ evaluation process developed by PoDQA
The results are stored in the database. Each time a Web portal is evaluated the new values are also stored. This allows the user to ask for historical data about the evaluations and to check whether the DQ in a Web portal has being improved. Together with this, PoDQA also offers users a ranking of Web portals. The evaluation process does not take place in real time because it is necessary to download a great deal of pages from the Web portal, in order to be able to calculate the defined measures. The tool calculates the measures by using the public information in Web portals (html code). The evaluation results will be part of the public information on the Web site of the tool and any user can thus have access to them. Additionally, the tool offers a functionality which is mainly orientated towards Web portal developers and which, based on the results of PoDQA, provides corrective maintenance activities to improve the DQ.
PDQM FOR DATA CONSUMERS As was mentioned earlier, PoDQA is a tool that any user may use it to request the DQ evaluation of a Web portal. Use of this tool will provide Web portal data consumers with, amongst others, the following benefits: • • • •
•
Discovering the data quality level in a Web portal in which they are interested. This DQ level will be determined through the use of criteria which will be adjusted to their perspective. Upon discovering the data quality level of a portal the data consumer is able to decide whether or not to use the information provided. If s/he decides to use this information, then s/he is concious of the level to which it is adjusted to his/her necessities. If faced with the dilemma of which of two equivalent portals to use, the DQ level of both can be used as a discriminatory factor. If s/he habitually uses the same portal, then s/he can discover how the data quality level has evolved since the last time that the portal was used. This can be done by accessing all of the evaluations (requested by any user) that the portal has made and which are ordered chronologically. Finally, it is possible to discover a ranking of the portals according their DQ level for each portal domain that implements the tool.
When a user decides to start an evaluation process s/he must provide the URL of a Web portal, the Web portal domain, which DQ category s/he wishes to evaluate (at the moment this is only possible for the university portal domain and representational DQ), and their e-mail address, see Figure 8.
Figure 8. PoDQA, the request of an evaluation
Once these data have been verified, the process is initiated. If the DQ category to be evaluated includes subjective measures, then a set of questions will be formulated for the user (in the Representational DQ category certain questions will be asked in order to obtain the evaluations for the DQ attribute of Interpretability, the quantifiable variable LI in Figure 5). Once the calculations are performed the user is contacted (via e-mail) and is invited to visit the PoDQA tool Website again in order to recover the results. When the user returns to discover the results of an evaluation, s/he must provide the data through which to identify the portal (URL, date and e-mail) and PoDQA will give him/her the results of the evaluation. Figure 9 shows an example of the result of a DQ evaluation.
Figure 9. PoDQA, the results of an evaluation
As we can see in this example, PoDQA returns the results of the evaluation in a natural language which is easy for any user to understand. Our intention is that the tool is easy enough for anybody to use, and that the information which is returned will assist users in becoming aware of the level of data quality that a portal can obtain and the extent to which these data might be useful to them. This is achieved by applying a set of rules to the results delivered by the BN (a set of probabilities associated with the labels/categories defined (High, Médium, Low)) from which the corresponding message is generated in natural language. This message is the same in all cases, and the only variation is in the URL corresponding to the portal evaluated, the level of DQ calculated for the portal and the indication of the domain for which it was evaluated. Table 2 shows the generic message and Table 3 shows the levels of the representational DQ that a portal may have and the rule which generates the level of DQ in natural language. The level of the representational data quality in portal www.xxx.xxx is xxxxxxxxxx, assuming that it is a domain portal xxxxxx. Table 2. Generic message with the results of an evaluation. Results of the BN Text for the user’s message If the DQ level is High with a probability of more than 80%. Very High If the DQ level is High with a probability of less than 80%. High If the DQ level is Medium and the percentage of the High level is Medium tending to High greater than that of the Low level by at least five points. If the DQ level is Medium and the percentage of the Low level is Medium tending to Low greater than that of the High level by at least five points. If the DQ level is Medium and the percentage of the Low level does Medium not differ from that of the High level by less than 5 points. If the DQ level is Low, with a probability of less than 70%. Low If the DQ level is Low with a probability of more than 70%. Very Low Table 3. Possible Representational DQ levels and the conditions that generate them.
Finally, if the user so desires, the same option can also be used to obtain the previous evaluations of the Web portal which are sorted chronologically. The user can use this to analyze the evolution of DQ in the portal and discover whether it has improved and to what extent.
PDQM FOR WEB PORTAL DEVELOPERS Our original intention was to construct a tool which would make PDQM available to Web portal users or data consumers. Then the idea of using the model (along with the tool) to assist developers to improve the level of DQ in their portals arose. In order to do this, an additional functionality was implemented in PoDQA which not only allows the user to obtain the level of DQ in the portal being evaluated, but also permits him/her, if s/he so desires, to obtain a series of recommendations which will assist him/her to improve the level of data quality in his/her portal. Use of this tool will provide the developers of Web portals with, amonst others, the following benefits: • • • •
Discovering the data quality level in their portals from a user’s perspective. Upon discovering the data quality level of a portal, they will be able to obtain a series of recommendations which will assist them to improve the DQ level in their portal. The possibility of controlling how the quality level in their portal evolves with time. Discovering where their portal is situated in a DQ ranking with regard to other portals in the same domain which will eventually represent their competition.
•
Knowing that one of the factors that may influence the success of their portal amongst users or data consumers is the level of DQ, will assist them in their aim to discover the aspects which can be improved.
This functionality has been implemented in the following manner. Our first step was to analyze the values delivered by the BN in order to generate the representational level of the portal. The following levels were thus generated: Very High, High, Medium-High, Medium, Medium-Low, Low and Very Low (this is in keeping with the message generatated for the data consumer), and the developer will be informed of them via a message. Then, a recommendation for improvement will be given to any of the measurements with which the indicators (LCsR, LCcR, LD, LAD, LI, LO in the case of DQ_Representational, see figure 5) are calculated which are lower than 0.5. The tool will use all the recommendations which have been generated to produce a list of recommended improvements which it suggests putting into practice if the portal is to be improved. This list is produced in a variable manner according to the results which have been specified by the evaluation. We shall now show some examples of the recommendations that the tool might generate. Table 3 shows: the DQ attribute that was measured, the indicador that measured it, some of the measurements that were created to calculate the indicator and the recommendations associated with the measurement when a low value is present. DQ Attribute Consistent Representation
Indicator LCsR
Measures PSSD (Pages with the same style)
Recommendations The pages of the portal should be consistent in style. Choose a style and apply it to all the pages in the portal. Alternatively, try not to use more than two or three styles. Concise LCcR DPP (Distribution The text on the pages should be organized into paragraphs. Representation of paragraphs per The distribution of the paragraphs on the portal’s pages page) should be uniform, and you should ensure that no pages contain an excessive (or minimum) quantity of paragraphs. Amount of LAD DLP (Distribution The distribution of the links on the pages of the portal Data of links per page) should be uniform. Try to ensure that no pages contain an excessive amount of links. Documentation LD LTTD (Links with Include an explanatory text which is associated with the explanatory text) links, particularly in the case of those links in which the included text does not give a sufficient explanation. Interpretability LI Understandability The relevant terms and words used in this portal should be of terms and adapted to the users towards whom the portal is directed. words Study your intended users and adopt terms that will be easy for them to understand. Organization LO PO (Organization The information presented on the pages of the portal per page) should be organized by combining various visual characteristics such as size of letters, images, colours, data grouping etc. Table 3. An example of the recommendations that PoDQA is able to generate
As you will note, the recommendations are generated in a natural language and are consistent with the measurements that have been applied. These measurements have, in their turn, been defined on the basis of the definition of the representational DQ category and by using the work of Ivory et al. [11], the Web design recommendations of Nielsen [22] and the assessment methods proposed in [7] and [23] as a reference. Moreover, if the developer puts these recommendations into practice, s/he can then re-evaluate his/her portal to determine to what extent the representational DQ in it has improved. In order to demonstrate a concrete example of this functionality, we shall now show the results of a real
evaluation. First the developer requests an evaluation by introducing the data of the portal which s/he wishes to evaluate (in the same manner as that which was given in the case of the data consumer). In this case it will evaluate the www.uclm.es portal. PoDQA will use these antecedents to download the portal and to calculate the indicators in order to then introduce them into the BN. As a result of this, we have obtained the following values for the representational DQ level: High = 24%, Medium = 60% and Low = 17%. These values are analyzed internally and the message containing the results of the evaluation and the improvement recommendations is generated by applying the previously indicated rules. When the developer returns to the PoDQA website to review the results of the evaluation, PoDQA not only shows the data which is also given to the data consumer (see Figure 9), but also offers the users a link which permits them to access the improvement recommendations. (See Figure 10, which shows the list of recommendations generated by PoDQA following the evaluation of the www.uclm.es portal.
Figure 10. PoDQA, a list of improvement recommendations
CONCLUSIONS DQ is currently of interest both to users and owners/designers of Web portals. In the case of the former, their interest is normally centered upon discovering what level of DQ a determined portal offers, in order to decide whether the data obtained is appropriate to the use to which they wish to put them. The latter’s interest is centered upon discovering the DQ level in their portal and how this might influence its success among users. In this paper we have briefly explained a DQ model for Web portals which centres upon the data consumer’s point of view and PoDQA, the tool that implements it. We have shown how PoDQA enables our model to be used by data consumers and web portals developers. At this moment, PoDQA implements the DQ evaluation for the Representational DQ category in the university Web portal domain. The main functionalities of PoDQA are: to calculate the level of representational DQ for a given Web portal, to provide information about the DQ evaluations made by the tool and to generate recommendations through which to improve the DQ in a Web portal. As has previously been mentioned, PoDQA is available at http://podqa.webportalquality.com. We believe that our work represents an interesting contribution to the area of DQ because, as Gertz et al.
(2004) point out “well-founded and practical approaches to assess or even guarantee a required degree of the quality of data are still missing”. We also believe that the probabilistic focus used in the construction of our model has been a success as it has permitted the generation of a model whose final version is distinguished by the fact that it is: Generic (applicable to any type of WP), Suitable (orientated towards the data consumer’s point of view), Flexible (applicable in various situations) and Complete (it represents all of the relationships between the attributes). As future work, and although PoDQA has already been empirically evaluated, we wish to control its effectiveness with regard to the functionality which is orientated towards developers. In order to do this, our intention is to measure certain known portals, apply corrective measures to them and then re-evaluate them in order to study the evolution of the DQ. Moreover, another future work is to extend the tool to the whole PDQM. That is, we will implement the measures in the rest of the DQ categories in the model. The PoDQA will consequently be able to offer users the possibility of evaluating the data quality in a Web portal in either only one of the four DQ categories, or in all of them at the same time. Another task for the future is the adaptation of the BN to other Web portal domains. Thus, PoDQA will allow the users to select between several Web portal domains and will assess the DQ of each one, based on their specific characteristics represented by means of their probability tables.
Acknowledgments. This research is part of the following projects: ESFINGE (TIC2006-15175-C05-05) granted by the Dirección General de Investigación del Ministerio de Ciencia y Tecnología (Spain), CALIPSO (TIN20005-24055-E) supported by the Ministerio de Educación y Ciencia (Spain), DIMENSIONS (PBC-05-012-1) supported by FEDER and by the “Consejería de Educación y Ciencia, Junta de Comunidades de Castilla-La Mancha” (Spain) and COMPETISOFT (506AC0287) financed by CYTED.
REFERENCES [1]
M. Bouzeghoub and V. Peralta. A Framework for Analysis of data Freshness. in International Workshop on Information Quality in Information Systems, (IQIS2004). 2004. Paris, France: ACM. p. 59-67.
[2]
C. Cappiello, C. Francalanci, and B. Pernici. Data quality assessment from the user´s perspective. in International Workshop on Information Quality in Information Systems, (IQIS2004). 2004. Paris, Francia: ACM. p. 68-73.
[3]
A. Caro, C. Calero, I. Caballero, and M. Piattini. Defining a Data Quality Model for Web Portals. in WISE2006, The 7th International Conference on Web Information Systems Engineering. 2006. Wuhan, China: Springer LNCS 4255. p. 363-374.
[4]
A. Caro, C. Calero, H. Sahraoui, and M. Piattini, A Bayesian Network to Represent a Data Quality Model. International Journal on Information Quality, 2007. Accepted for publication in the inaugural issue 2007.
[5]
H. Collins, Corporate Portal Definition and Features. 2001: AMACOM.
[6]
M. Eppler, R. Algesheimer, and M. Dimpfel. Quality Criteria of Content-Driven Websites and Their Influence on Customer Satisfaction and Loyalty: An Empirical Test of an Information Quality Framework. in Proceeding of the Eighth International Conference on Information Quality. 2003. p. 108-120.
[7]
M. Eppler and P. Muenzenmayer. Measuring Information Quality in the Web Context: A Survey of State-of-the-Art Instruments and an Aplication Methodology. in Proceeding of the Seventh International Conference on Information Quality. 2002. p. 187-196.
[8]
M. Fugini, M. Mecella, P. Plebani, B. Pernici, and M. Scannapieco (2002). Data Quality in Cooperative Web Information Systems.Personal Communication. citeseer.ist.psu.edu/fugini02data.html.
[9]
M. Gertz, T. Ozsu, G. Saake, and K.-U. Sattler, Report on the Dagstuhl Seminar "Data Quality on the Web". SIGMOD Record, 2004. vol. 33, Nº 1: p. 127-132.
[10]
G. Graefe. Incredible Information on the Internet: Biased Information Provision and a Lack of Credibility as a Cause of Insufficient Information Quality. in Proceeding of the Eighth International Conference on Information Quality. 2003. p. 133-146.
[11]
M. Ivory, S. Rashmi, and H. Marti. Empirically Validated Web Page Design Metrics. in SIG-CHI on Human factors in computing systems (SIGCHI'01). 2001. Seattle, WA, USA. p. 53-60.
[12]
P. Katerattanakul and K. Siau, Information quality in internet commerce desing, in Information and Database Quality, M. Piattini, C. Calero, and M. Genero, Editors. 2001, Kluwer Academic Publishers.
[13]
P. Katerattanakul and K. Siau. Measuring Information Quality of Web Sites: Development of an Instrument. in Proceeding of the 20th International Conference on Information System. 1999. p. 279-285.
[14]
B. Kitchenham (2004). Procedures for Performing Systematic Reviews.RN: 0400011T.1. http://www.idi.ntnu.no/emner/empse/papers/kitchenham_2004.pdf.
[15]
S.A. Knight and J.M. Burn, Developing a Framework for Assessing Information Quality on the World Wide Web. Informing Science Journal, 2005. 8: p. 159-172.
[16]
G. Malak, H. Sahraoui, L. Badri, and M. Badri. Modeling Web-Based Applications Quality: A Probabilistic Approach. in 7th International Conference on Web Information Systems Engineering. 2006. Wuhan, China: Springer LNCS. p. 398-404.
[17]
H. Melkas. Analyzing Information Quality in Virtual service Networks with Qualitative Interview Data. in Proceeding of the Ninth International Conference on Information Quality. 2004. p. 74-88.
[18]
V. Moustakis, C. Litos, A. Dalivigas, and L. Tsironis. Website Quality Assesment Criteria. in Proceeding of the Ninth International Conference on Information Quality. 2004. p. 59-73.
[19]
F. Naumann and C. Rolker. Assesment Methods for Information Quality Criteria. in Proceeding of the Fifth International Conference on Information Quality. 2000. p. 148162.
[20]
M. Neil, N.E. Fenton, and L. Nielsen, Building large-scale Bayesian Networks. The Knowledge Engineering Review, 2000. 15(3): p. 257-284.
[21]
R. Nelson, P. Todd, and B. Wixom, Antecedents of Information and System Quality: An Empirical Examination Within the Context of Data Warehouse. Journal of Management Information Systems; Spring 2005, 2005. 21(4): p. 199-235.
[22]
J. Nielsen, Designing Web Usability: The Practice of Simplicity. 2000, Indianapolis: New Riders Publishing.
[23]
L. Pipino, Y. Lee, and R. Wang, Data Quality Assessment. Communications of the ACM, 2002. Vol. 45, Nº 4: p. 211-218.
[24]
T. Redman, Data Quality: The field guide. 2000, Boston: Digital Press.
[25]
D. Strong, Y. Lee, and R. Wang, Data Quality in Context. Communications of the ACM, 1997. Vol. 40, Nº 5: p. 103 -110.
[26]
L. Xiao and S. Dasgupta, User Satisfaction with Web Portals: An empirical Study, in In Web Systems Design and Online Consumer Behavior, Y. Gao, Editor. 2005, Idea Group Publishing, Hershey, PA. p. 193-205.
[27]
Z. Yang, S. Cai, Z. Zhou, and N. Zhou, Development and validation of an instrument to measure user perceived service quality of information presenting Web portals. Information and Management. Elsevier Science, 2004. 42: p. 575-589.