Measuring time with different neural chronometers during a synchronization-continuation task Hugo Merchant1,2, Wilbert Zarco1, Oswaldo Pérez, Luis Prado, and Ramón Bartolo Department of Cognitive Neurocience, Instituto de Neurobiología, Universidad Nacional Autonoma de México, Campus Juriquilla, Queretaro 76230, Mexico Edited by Ranulfo Romo, Universidad Nacional Autonoma de México, Mexico City, Mexico, and approved October 25, 2011 (received for review August 8, 2011)
Temporal information processing is critical for many complex behaviors including speech and music cognition, yet its neural substrate remains elusive. We examined the neurophysiological properties of medial premotor cortex (MPC) of two Rhesus monkeys during the execution of a synchronization-continuation tapping task that includes the basic sensorimotor components of a variety of rhythmic behaviors. We show that time-keeping in the MPC is governed by separate cell populations. One group encoded the time remaining for an action, showing activity whose duration changed as a function of interval duration, reaching a peak at similar magnitudes and times with respect to the movement. The other cell group showed a response that increased in duration or magnitude as a function of the elapsed time from the last movement. Hence, the sensorimotor loops engaged during the task may depend on the cyclic interplay between different neuronal chronometers that quantify the time passed and the remaining time for an action. medial premotor area area
| timing neurophysiology | supplementary motor
I
nterval timing in the milliseconds is a prerequisite for many complex behaviors, such as the perception and production of speech (1), the execution and appreciation of music and dance (2, 3), and the performance of a large variety of sports (4). Time in music comes in a variety of patterns, which include isochronous sequences where temporal intervals are of a single constant duration or, more commonly, sequences containing intervals of many durations. In addition, the ability to capture and interpret the beats in a rhythmic pattern allows people to move and dance in time to music (3). Music and dance, then, are behaviors that depend on intricate loops of perception and action, where temporal processing can be involved during the synchronization of movements with sensory information or during the internal generation of movement sequences (2). In a simplified version of these activities, numerous studies have examined how subjects synchronize taps with pacing isochronous auditory stimuli and then continue tapping at the instructed rate without the advantage of the sensory metronome (5). Thus, the cyclic nature of the synchronizationcontinuation task (SCT) implies that subjects must keep track of the time elapsed since the previous sensorimotor events as well as the time remaining until the next events. Functional imaging studies have shown that the basal ganglia, the medial premotor cortex (MPC, pre- and supplementary motor areas), the prefrontal and posterior parietal cortex, and the cerebellum are the main nodes of a timing network that is engaged during different time production and perception tasks, including the SCT (6, 7). These studies suggest the existence of a partially overlapping distributed system for the temporal information processing in a variety of sensorimotor contexts that reach a complexity peak during musical cognition and speech, but that also include the production and estimation of single intervals (2, 8). Neurophysiological studies have shown that cells in MPC are involved not only in controlling self-initiated behaviors, the sequential organization of multiple movements (9), and decision making (10), but also in the production of single intervals in the range of seconds (11). Neuronal activity in MPC is involved in the process of retrieving time instructions from visual cues
19784–19789 | PNAS | December 6, 2011 | vol. 108 | no. 49
and shows an increase or decrease in activity associated with the interval duration (11). However, critical and unresolved questions are how MPC is engaged in rhythmic timing behaviors that are driven by sensory or internal events and what neural signals are used to encode the passage of time during a tapping task that has been a backbone in the timing literature. Consequently, in the present study, we examined the response properties of MPC cells during the execution of the SCT in behaving monkeys and found that different types of ramping activity encoded the time elapsed since the previous movement or the time remaining until the next tap in a cyclical fashion. Results Selective Activity to the Temporal Context. Two Rhesus monkeys
were trained in a version of SCT that included three produced intervals in the synchronization and the continuation phase (Fig. 1A, see Methods). Auditory interval markers were used during the synchronization condition. Once the animals performed over 75% of correct trials (Fig. S1), we recorded the single cell activity in MPC during task execution (Fig. 1B; see Methods). The activity of 1,083 MPC cells showed stable responses during SCT. Of these, 703 neurons showed a significant increase in discharge rate during task performance with respect to the key-hold control period and were analyzed further. Interestingly, a large group of these neurons showed a selective increase in discharge rate during the synchronization or the continuation phase (n = 386, Fig. 2; ANOVA for task phase, P < 0.05). Considering the involvement of MPC in the organization of sequential motor behavior (9), an important question is whether the selective activity during one of the SCT phases was related to the ordinal instead of the temporal aspects of the task. Hence, we also recorded these cells during a sequential reaction time task (SRTT, Fig. 1C) that included both similar stimuli and a sequence of tap responses, but where the interstimulus intervals within each trial were random (600-1,400 ms), precluding anticipation and explicit temporal processing (12). Less than 30% of these cells (96 of 386, Fig. S2) maintained their selectivity during the initial or final periods of SRTT. These results suggest that most SCT selective responses were associated with the temporal information processing during the sensory-guided (synchronization) or the internally driven (continuation) cyclic movement production (Fig. 2), and only a fraction of these responses was related to the well known ordinal sequential movement activity in MPC (9). Single Neuron Activity Before Movement Onset. A large population of neurons showed ramping activity before or after the button press in SCT. Due to the cyclic nature of SCT, it was of the upmost importance to identify with reliability the onset and
Author contributions: H.M. designed research; H.M., W.Z., O.P., L.P., and R.B. performed research; H.M., W.Z., O.P., L.P., and R.B. analyzed data; and H.M., W.Z., and R.B. wrote the paper. The authors declare no conflict of interest. This article is a PNAS Direct Submission. 1
H.M. and W.Z. contributed equally to this work.
2
To whom correspondence should be addressed. E-mail:
[email protected].
This article contains supporting information online at www.pnas.org/lookup/suppl/doi:10. 1073/pnas.1112933108/-/DCSupplemental.
www.pnas.org/cgi/doi/10.1073/pnas.1112933108
A
B
Synchronization-Continuation Task
A
Monkey C
B
PS
Stimulus ArS
Lever
rw CS
Response Time start
reward
synchronization continuation
Target Intervals (ms) PS
ArS
C
Sequential Reaction Time Task
CS
Stimulus
rw
Monkey L Time
start
motor responses
reward
Randomized intervals in the range: 600 to 1400 milliseconds
Recording sites pre-SMA SMA
10 mm
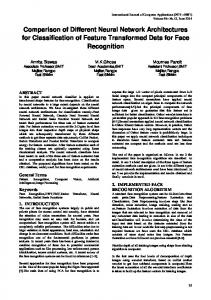
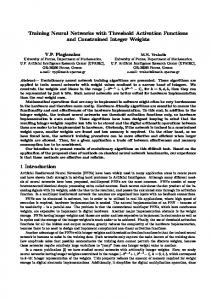
Fig. 1. Behavioral tasks and neuronal recording sites. (A) Schematic of epochs in the synchronization-continuation task (SCT), periodic stimuli (gray line), and push button responses (black line). Each trial began when the monkey held a lever. (B) MRI surface reconstruction of macaque brain and recording sites in the two monkeys. PS, principal sulcus; ArS, arcuate sulcus; CS, central sulcus; surface bounded by a circle, recording area and medial premotor cortex. (C) Schematic of epochs in the sequential reaction time task (SRTT). SMA, supplementary motor area.
duration of the ramping activity (Fig. 2). Thus, an iterative algorithm was developed to find the best linear regression model that explained the increase or decrease of instantaneous activity with respect to a sensory or motor event using the spike density function (SDF; Fig. S3). With this method, we defined for each produced interval the following ramp parameters: duration, slope, starting and peak magnitude, and the time τ from the peak to the button press. The results of this analysis showed five groups of neurons, three groups whose ramping activity increased overtime reaching a maximum before the button press, and two groups with responses after the button press. Here we describe the former three cell types. One group of cells showed ramps with a similar duration across target intervals (ANOVA, P > 0.05; 236 neurons) and were classified as motor ramps (Fig. 3A). A second population of ramping cells showed a significant increase in ramp duration as a function of target interval (ANOVA, P < 0.05; 163 neurons). A large group of these ramps also showed a significant decrease in slope as a function of target interval (ANOVA, P < 0.05; 129 of 163 neurons) and were called relative-timing cells, because in addition to their time modulated climbing activity they all had the tendency to reach their peak magnitude at a similar time before the button press (Fig. 3B). Therefore, these cells could signal how much time is left for triggering the button press in the task sequence. An important property of the motor and relative-timing ramps was their sharp decrease in activity after reaching the magnitude peak, suggesting that both cell types were only related to the upcoming movement. In contrast, the third type of ramping activity showed a more complex response. This small group of cells also showed an increase in ramp duration as a function of target interval (ANOVA, P < 0.05); however, instead of changing their slope, the cells showed a decrease in ramp starting magnitude as a function of the target interval (ANOVA, P < 0.05; 34 neurons; Fig. 3C). As with the relative-timing cells, these responses reached their peak magnitude at similar moments before the button press. Nevertheless, in this case, the beginning of the Merchant et al.
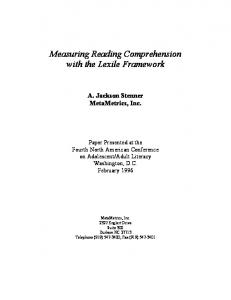
Fig. 2. Ramping activity profiles of two representative cells aligned (thick black vertical line) to the first tap of the continuation period in SCT and to the third tap in SRTT. Every tick mark corresponds to a single spike time stamp in a correct trial; spike density function (SDF) averages are below each raster. The dots represent the button press. (A) Synchronization-selective neuron. (B) Neuron with differential activity in the continuation phase. Note that the cells do not show ordinal sequence-selective responses during the SRTT in the bottom.
climbing activity was preceded by a monotonic decrease in activity. Thus, the minimum level of activity of the descending responses was systematically lower for longer durations, and this phenomenon was more evident when the activity was aligned to the previous button press (Fig. 3 C Left). We called these cells swinging ramps because their responses were characterized by a down-up profile of activation whose fluctuation depth depended on the duration of the target interval. Population Activity Before Movement Onset. The neural mechanism for the time remaining for a tap during SCT should compute the time of the actual produced intervals during the task execution, instead of the target intervals used to cue the animals. Therefore, we calculated the actual duration of the produced intervals during task performance and regrouped the single trial ramping activity of the 3 cell types according to these durations (from 400 to 950 ms in steps of 50 ms, n = 12). We observed that the distribution of produced intervals had a bimodal structure with modes around 450 and 850 ms for the synchronization and continuation phases of SCT. The distribution of produced intervals during SRTT was skewed toward long durations due to the random intervals range of 600–1,400 ms used to avoid prediction (Fig. S4). The neurophysiological data during SCT showed that the duration of the ramping activity increased as a function of produced interval in relative-timing and swinging cells [Kruskal–Wallis test (KW), P < 0.05; Fig. S5 and Table S1 for details] and that the ramp slope showed a significant decrease across produced intervals in relative-timing cells (KW, P < 0.05). Furthermore, swinging cells showed a significant decrease in the PNAS | December 6, 2011 | vol. 108 | no. 49 | 19785
NEUROSCIENCE
Lever Response
A 50 40
ms
B
450 550 650 850 1000
30
30
20
20
10
10 0
0 -800
-600
-400
-200
0
200
-800
Time to button press (ms)
-600
-400
-200
0
200
Time to button press (ms)
C 80
80
60
60
40
40
20
20
0 -200
0 0
200
400
600
800
-800
-600
-400
-200
0
200
D 40
40
30
30
20
20
10
10
0
0
-200
0
200
400
600
800
-800
-600
-400
-200
0
200
-800
-600
-400
-200
0
200
Discharge rate (Hz)
E 50 40 30 20 10 0 -200
0
200
400
600
800
Time from button press (ms)
50 40 30 20 10 0
Time to button press (ms)
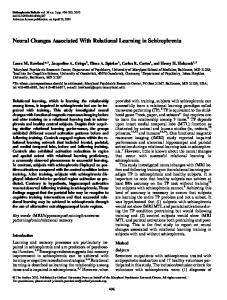
Fig. 3. Average SDF of single cells responding before or after the button press across target intervals in the SCT. (A) Neuronal activity of a cell classified as motor because its climbing activity was similar for all target intervals. (B) Activity of a relative-timing cell that showed ramps with a significant increase in duration and significant decrease in slope as a function of target interval. (C) Neuronal activity of a swinging cell that showed a down-up profile of activation whose fluctuation depth depended on the duration of the target interval. (D) Neuronal activity of an absolute-timing cell that shows a increase in its up-down profile of activation as a function of target interval. (E) Activity of a time-accumulator cell that showed an increase in discharge rate across target intervals. Cells are aligned to the previous (Left) or next (Right) button press, with exception of A and B, were the cells are only aligned to the next button press. The color code for target intervals is described in A Inset. The black dots indicate the average time of the previous or next button press. The transparent SDF correspond to the 200-ms period before or after the average produced interval.
ramp starting magnitude as a function of produced interval (KW, P < 0.05). The behavior of these variables was different during the SRTT, with practically no modulation across produced intervals for all cell types (Fig. S5; KW, P > 0.05). In fact, a significant difference in ramp duration and slope was found between SCT and SRTT for the relative-timing cells (Wilcoxon test, P < 0.05, for both variables), whereas for swinging cells a significant difference between the two tasks was observed in ramp duration and starting magnitude (Wilcoxon test P < 0.05, for both variables). Hence, the response differences between tasks in the relative-timing and swinging cell populations stress the need for external or internal periodicity to extract temporal contingencies and drive timed responses. In contrast, motor ramps showed a similar duration and slope across produced intervals during SCT and SRTT (Fig. 3A), which is a signature for a phasic motor command issued in both behavioral contexts. We computed the mutual information (MI) between the ramp parameters and the produced intervals (see SI Text). The MI is a measure of the statistical dependency between the behavioral 19786 | www.pnas.org/cgi/doi/10.1073/pnas.1112933108
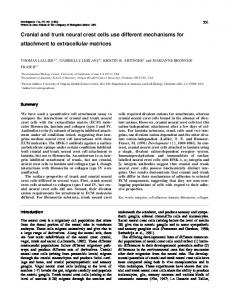
variable (i.e., produced interval), and a neurophysiological parameter (i.e., ramp duration). This measure also allows for the identification of the cell activity parameter that best explains a behavioral variable using the same unit of measurement (bits) across the parameters tested (13). The results, shown in Table 1, showed that the MI across the six ramp parameters was smaller for motor cells. In contrast, for relative-timing cells, the MI of the duration of the climbing activity was the largest, followed by the MI of ramp slope. In swinging cells, the ramp starting discharge rate showed a large MI value that was similar to the MI for ramp duration. The MI for the other parameters was small across cell types. Therefore, these results indicate that the change in slope for relative-timing cells and the change in starting ramp magnitude for swinging cells are their distinctive features. Furthermore, these results confirm that ramp duration is a fundamental property for encoding remaining time. It is important to mention that the changes in ramp duration in these two types of cells were not related to the muscular pattern of activation during task performance. The climbing activity of the muscles of the tapping hand/arm was phasic, sharp, and had a peak close to the button press (Fig. S6 and Table S1). Neural Correlates for Elapsed Time Calculation. Using the algorithm for ramp detection we found another population of neurons that showed an increase followed by a decrease in instantaneous discharge rate when the activity was aligned to the previous button press. The up-down profile of activation can be characterized by the duration of the positive and negative consecutive ramps, the magnitude of the ramps’ peak, and the time τ from the button press to the beginning of the positive ramp (Fig. S3). Most of these cells showed a significant increase in the overall duration of the positive and negative consecutive ramps as a function of target interval and were called absolute-timing ramps (ANOVA P < 0.05; 304 neurons; Fig. 3D). Within this cell population, we found a subgroup of cells that also showed a significant increase in the magnitude of the ramps’ peak as a function of target interval, and consequently, were called timeaccumulator ramps (ANOVA P < 0.05; 124 neurons; Fig. 3E). Therefore, these cells could be representing the passage of time since the previous movement, using two different encoding strategies: One functioning as an accumulator of elapsed time where the peak magnitude is directly associated with the time passed, and another where the duration of the activation period is encoding the length of the time passed since the previous movement. Interestingly, when the activity of these two types of responses was aligned to the upcoming movement, it was evident that the end of the downward phase was similar across target intervals (Fig. 3 D and E Right), suggesting a functional association with the elapsed time encoding cells, as described below. The duration of the ramps showed a large significant increase across produced intervals in absolute-timing and time-accumulator ramps (KWs, P < 0.05; Fig. S7, see Table S2), whereas the peak magnitude showed a larger increase in time-accumulator than in absolute-timing cells across produced intervals (KWs, P < 0.05). Conversely, the slope of the initial positive ramp showed a decrease as a function of produced interval that was larger in absolute-timing than time-accumulator ramps (KWs, P < 0.05). Furthermore, the MI analysis showed that in both the absolute-timing and time-accumulator ramps the duration of the initial positive ramp was the variable with more bits of information regarding the produced interval, followed by the peak magnitude for the time-accumulator ramps and the slope of positive ramps in the absolute-timing cells (see Table 1). Multiple Neural Chronometers. The notion of separate groups of cells encoding elapsed or remaining time was supported by the clear bimodal nature of the τ values of the peak in activity; absolute-timing and time-accumulator ramps showed a magnitude peak that was closer to the previous button press (Fig. 4A), whereas the τ values for the relative-timing and swinging ramps were closer to the next button press (Fig. 4B). The rhythmic Merchant et al.
Table 1. Mutual Information in bits for the listed variables across the five types ramping cells Ramp variable
Motor
Duration positive Duration negative Tau value Slope positive Peak magnitude Start magnitude
0.253 0.137 0.149 0.083 0.092 0.078
Relative-timing
(7.1) (3.8) (4.1) (2.3) (2.6) (2.2)
0.901 0.182 0.161 0.440 0.095 0.097
(25.1) (5.1) (4.5) (12.3) (2.6) (2.7)
Swinging 0.924 0.417 0.148 0.268 0.333 0.955
Absolute-timing
(25.8) (11.6) (4.1) (7.5) (9.3) (26.6)
0.81 0.245 0.189 0.423 0.141
Time-accumulator
(22.6) (6.8) (5.3) (11.8) (3.9)
0.888 0.399 0.215 0.269 0.69
(24.8) (11.1) (6) (7.5) (19.3)
structure of SCT may impose the need for both the prediction of when to trigger the next tap and the quantification of the time passed from the previous movement. The noisy character of single temporal ramps, however, implies that the downstream reading neural node cannot rely on single cells to quantify the passage of time or produce accurately timed movements. Therefore, we propose a population code for encoding elapsed or time remaining during SCT, where the reading network adds the magnitudes of a population of individual ramps over time, PN rðt; IÞ , resulting in a ramp population function Rðt; IÞ ¼ n¼1 N where r(t, I) corresponds to each individual ramp over time (t),
0.4 0.2 0
0
200
400
-600
C
D
20
10
0
30
Discharge rate (Hz)
Discharge rate (Hz)
30
0
200
400
600
-400
ms
600 500 400 400
500
600
700
800
900 1000
Produced Interval (ms)
A
10
0
200
400
600
800 1000 1200
30
Peak Magnitude (Hz)
Decoded Interval (ms)
700
400
Time from button press (ms)
F
800
950
600
20
Time from button press (ms)
900
0
800
0
800 1000 1200
E 1000
-200
Time to button press (ms)
Time from button press (ms)
25
20
600 400
10 10
-1200 -1000 -800 -600 -400 -200
0
0
-1200 -1000 -800 -600 -400 -200
Time to button press (ms)
15 10
Absolute Accumulator
5 0
B 20
950 800
0
20
400
500
600
700
800
900 1000
Produced Interval (ms)
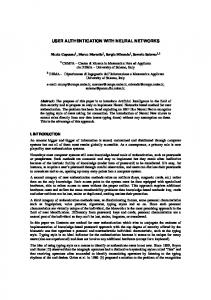
Fig. 4. Histograms of the τ values of the peak of activity with respect to the previous (A) or the next (B) button press for the five cell types described in the text. Gaussian functions were fitted to the distributions and displayed as lines. Abs, absolute-timing; Acc, time-accumulator; Swi, swinging; Rel, relative-timing; Mot, motor cells. Ramp population functions [R(t, I)] for absolute-timing (C) and time-accumulator (D) cells aligned to the previous button press. The color code corresponds to the duration of produced intervals as depicted in D Inset. (E) Decoded time as a function of produced interval using 90% of the maximum magnitude of R(t, I) to determine the elapsed time since the button press for absolute-timing (filled circles, black line) and time-accumulator (open circles, gray line) cells. (F ) Peak magnitude of the R(t, I) as a function of produced interval for absolute-timing and timeaccumulator cells. Lines correspond to linear regression fits.
Merchant et al.
ms
C
D
30
20
10
0
-1200
-800
-400
Time to button press (ms)
0
Time to button press (ms)
Time to button press R-t
0.6
B
Discharge rate (Hz)
Abs Acc Swi Rel Mot
0.8
Discharge rate (Hz)
1
Normalized frequency
A
from 1 to N total number of ramps of a cell type, and for a particular produced interval (I). Fig. 4C shows the ramp population functions for the absolute-timing ramps, where it is evident that the up-down cycle of the R(t, I) increased systematically as a function of the elapsed time since the previous tap. In addition, the R(t, I) for the time-accumulator ramps, depicted in Fig. 4D, shows a progressive increase in peak magnitude as a function of the elapsed time since the previous tap. We computed the elapsed time since the previous button-press at different percentages of the peak magnitude of R(t, I), and found that at 90% there was a tight relation between the decoded elapsed time from the ramp population function and the duration of the produced intervals, particularly for absolute-timing cells (Fig. 4E). Furthermore, the peak magnitude of the R(t, I) for the time-accumulator showed a clear linear increase as a function of the produced interval (Fig. 4F). Fig. 5A illustrates the R(t, I) for the relative-timing ramps; it is clear that these functions showed a sigmoidal behavior and that their duration increased and their slope decreased as a function of produced interval. Therefore, R(t, I) for the time-remaining ramps is a good candidate for the neural computation of time remaining, triggering the tapping movement when it reaches a particular magnitude threshold. These population functions, as well as motor ramps (Fig. 5B) and EMGs, showed a slight increase in τ values as a function of produced interval, suggesting a small increase in movement speed for shorter intervals.
0
600 500 400 300
Absolute vs relative Accumulator vs relative
200 200
300
400
500
600
Time to button press A-t / T-a
Fig. 5. Ramp population functions for relative-timing (A) and motor (B) cells aligned to the next button press. (C) R(t, I) for absolute-timing cells aligned also to the next button press. The color code corresponds to the duration of produced intervals as depicted in A Inset. (D) Time to button press of R(t, I) at 14 Hz for absolute-timing (A-t; filled circles, black line) cells or at 12 Hz for timeaccumulator (T-a; open circles, gray line) cells plotted against the time to button press associated with the R(t, I) at 7 Hz for relative-timing (R-t) cells.
PNAS | December 6, 2011 | vol. 108 | no. 49 | 19787
NEUROSCIENCE
The number in parenthesis correspond to the percent of MI from the maximum, namely, log2(12) = 3.585 bits. Bold numbers correspond to the larger effects.
The multiple neural chronometers should interact at some point in their ramping activity to define the rhythmic structure of SCT. To test this idea, we aligned the R(t, I) of absolute-timing and time-accumulator cells to the upcoming button press (Fig. 5C) to compare the functions across cell types for the same behavioral event. Then, we computed the time to button press at different magnitudes of R(t, I) for absolute-timing, time-accumulator, and relative-timing cells with the purpose of finding the discharge rate of the population activity at which these cell types showed a similar temporal profile across produced intervals. Fig. 5D shows that the time to button press for the R(t, I) at 14 Hz of absolute-timing cells showed a tight linear relation with the time to button press for the R(t, I) at 7 Hz of relative-timing cells across produced interval durations, suggesting that these cell populations were interlocked at a particular moment in their temporal dynamics. This implies that for all produced intervals there is a magnitude in the R(t, I) where of absolute- and relative-timing cells show a very similar temporal relation with regard to the upcoming button press. In contrast, there was no significant correlation between the times to button press of timeaccumulator and relative-timing cells at any magnitude of their R(t, I) (Fig. 5D). Therefore, these results suggest that the absolute-timing ramps show some level of interaction with the relative-timing cells during each cycle of time production during SCT. However, it seems that the computation of elapsed time from a tapping movement by time-accumulator cells may not be part of the cyclic organization of timing behavior in SCT. Discussion This study investigated the functional properties of MPC neurons during the execution of SCT. Four main findings emerged. First, a large population of cells showed selective responses during the synchronization or continuation phases of SCT, suggesting the existence of partially overlapping neuronal populations engaged in temporal processing during sensory-cued or internally driven tapping behaviors. Second, two different groups of cells may encode the time-remaining for a tapping movement, because they showed ramping activity whose duration increased as a function of produced interval and they had the tendency to reach their peak magnitude at a specific time before the button press. Thus, both cell types could trigger the motor command once they reach a threshold. Interestingly, the relative-timing cells acted as the typical time-to-contact mechanism with a systematic decrease in the ramping slope across interval durations, whereas the swinging cells showed a down-up profile of activation whose fluctuation depth depended on the duration of the target interval. The third main finding was that other two cell populations may represent elapsed time since the previous movement. Both cell types showed a linear increase followed by a linear decrease in activity when aligned to the previous button press. The duration of the up-down cycle of activity in absolutetiming cells was associated with subjective time, whereas, in timeaccumulator cells, there was an additional increase in peak magnitude as a function of elapsed time. Finally, the activity of all types of ramping cells was quite variable and, consequently, a population of neurons might be needed for the accurate computation of different aspects of time. Hence, distinct populations of cells in MPC can encode elapsed and remaining times during a multiple interval production task that has a cyclic component and requires the temporal control of behavior cued by auditory stimuli followed by a phase of tapping that is internally timed. The functional repertoire of MPC cells in the behaving monkey includes the sequential organization of multiple movements, which made us question whether the selective activity during one of SCT phases was related to the ordinal instead of the temporal aspects of the task. However, when we tested the same cells in SRTT, a task that precluded the explicit timing of tappping behavior, we found that less than one-third of the cells maintained their selectivity during the initial or final periods of this control task. Therefore, two fundamental aspects of complex behavior, 19788 | www.pnas.org/cgi/doi/10.1073/pnas.1112933108
ordinal sequence and temporal structure, are represented in the activity of MPC cells. Music inherently consists of auditory processing and motor execution, with a rich temporal and sequential structure. In this respect, SCT is a classical timing task that engages the main-core timing system (2) and has the basic components of music. Hence, the present results suggest that the quantification of elapsed and remaining time during the cyclic sensorimotor loops of SCT might be a basic mechanism for other complex rhythmic behaviors, including music. Nevertheless, some precautions should be followed when extrapolating the neural underpinnings of temporal processing from macaques to humans during SCT, because monkeys cannot synchronize their tapping to the sensory metronome, and their timing variability during the continuation phase is greater than humans’ (12). Cell activity changes associated with temporal information processing have been reported in basal ganglia (14), thalamus (15), area LIP (16, 17), and prefrontal cortex (18, 19), as well as in motor cortex (20) and MPC (11). These areas form different circuits that are linked to sensorimotor processing. Most of these studies have described climbing activity during different timing contexts and time scales. Therefore, the increase or decrease in instantaneous activity as a function of time is a distributed property that includes subcortical areas and the frontal lobe and that may be involved in different aspects of temporal processing. Our results showed that the relative-timing cells showed a monotonic increase in climbing activity that reaches a magnitude threshold to trigger a motor command with a fast decay in activity. This profile of activation is similar to the reported ramps in the locust, pigeons, behaving monkeys, and humans (4) during the computation of time-tocontact in interception and collision avoidance behaviors (21). In contrast, the cyclic decrease–increase of activity observed in swinging cells, where the depth in the decrease phase is related to the duration of the interval produced is, as far as we know, a unique mechanism for the computation of remaining time for an action. The cyclic response of swinging cells may be linking the previous button press with the next one during the execution of rhythmic tapping in SCT. Therefore, the computation of the time remaining for an action by two complementary neural signals may be critical for the execution of SCT. The calculation of elapsed time from the previous tapping movement might be the counterpart of the relative-timing and swinging cells during the intrinsic sensorimotor loops of SCT. We observed cycles of increase and decrease of activity after tapping movements in absolute-timing and time-accumulator cells that were associated with interval duration when aligned to the previous button press. This finding implies that both the raise and decay in cell activity were encoding elapsed time. In the case of time-accumulator cells, however, the magnitude of the ramping activity might be the critical response variable for encoding the passage of time. Hence, these cells could be the neural correlate of the accumulator element of the scalar timing model used to explain the scalar property of interval timing in a variety of psychophysical measurements (22). Overall, separate cell populations that either quantify the time passed since a movement or that predict the timing for the next movement are locked at some point in their ramping activity, producing a balanced cyclic mechanism for the execution of movement sequences with a tight temporal structure. This is evident between absolute- and relative-timing cells. Hence, the rhythmic nature of SCT may depend not only on the quantification of different temporal aspects of the task but also on the close interaction between these two cell populations. The present findings suggest that the ability to synchronize with auditory information (which is necessary for playing in a musical ensemble) and the ability to maintain an internal tempo (which is indispensable for any solo performance) might depend on coordinated pattern of activation of cell populations that compute elapsed and remaining time for movement execution. Merchant et al.
General. Two male monkeys (5-7 kg body weight) were trained to tap on a push button in both SCT and SRTT (Fig. 1 A and C). All of the animal experimental procedures were approved by the Universidad Nacional Autonoma de México Institutional Animal Care and Use Committee and conformed to the principles outlined in the Guide for Care and Use of Laboratory Animals (National Institutes of Health, publication number 85-23, revised 1985). Synchronization-Continuation Task. The SCT used in this study has been described (12). Briefly, the monkeys were required to push a button each time stimuli with a constant interstimulus interval were presented, which resulted in a stimulus-movement cycle (Fig. 1A). After four consecutive synchronized movements, the stimuli were eliminated, and the monkeys continued tapping with the same interval for three additional intervals. Monkeys received a reward if each of the intervals produced had an error < 35% of the target interval. In addition, the monkey could receive a double reward if the intertap interval was