'system under test' is a step that is usually missed in a performance testing cycle.
.... based test agents (like JMeter and Rational Performance Tester) may not be.
MEASURING WORKLOAD PERFORMANCE – IS THE INFRASTRUCTURE A PROBLEM? Ashutosh Shinde Performance Architect
[email protected]
Validating if the workload generated by the load generating tools is applied correctly and consistently on the ‘system under test’ is a step that is usually missed in a performance testing cycle. Issues in the infrastructure elements between the test agent and the application can cause the workload to be incorrectly applied and can thus jeopardize the entire performance testing exercise. The paper looks at some of the infrastructure elements that are commonly found in a typical web based multi-tiered architecture and identifies some hotspots that can cause the application to be short-changed of the workload that it expects. Key Words: Workload, Performance testing 1. Introduction It is important to ensure that a correct and consistent workload is applied during performance testing, to reach a sound conclusion on the systems performance capabilities. Various papers have already discussed techniques to analyze the right workload on the system. Tools can be setup to apply the correct load on the system, but anomalies in the test environment can result in incorrect load being applied, which in turn jeopardizes the entire performance testing exercise. Software Developers have a tendency to start analyzing their application code when issues are reported during performance tests. However, it is important to validate the load on the system before optimization is taken up. Likewise, it is important to compare the performance testing environment with the production environment since results from test environment are used to understand the performance on the production environment. Differences in the 2 environments can lead to problems. Although a perfect match in the environments is usually difficult nevertheless, it is important to take cognizance of the changes and identify them as variables that can lead to different performance behavior in production and in the test environment. The paper explores typical web based deployment architecture and identifies some key hotspots in the setup that can potentially cause inconsistencies in the workload. 2. Need to validate the Infrastructure– a firsthand experience Consider this example of a J2EE Portal based application that was built using JDK 1.5 and was hosted on the high performance Sun Blade T6320 Server (UltraSPARC T2 Processors). The application servers were frontended by Web servers that hosted Apache as the reverse proxy. Performance test results were not satisfactory and hence a detailed analysis was recommended to amplify the performance. On first glance, the size of the infrastructure was large enough to compel any architect to overlook the infrastructure as a bottleneck area. However, we decided to first check the infrastructure with some basic tests before optimizing code or the environment. This turned out to be the right thing to do.
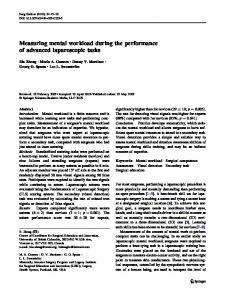
Figure 1- Deployment architecture
Tests were executed to check the two main layers – the web and the application before touching the database. Test 1Default out-of-box Portal theme was tested on the portal server. The theme consists of a few JSP’s and a few JavaScript files. 100 and 300 concurrent users were executed on the Portal server in 2 different tests since the actual system expected around 300 concurrent users. The idea behind the tests was to check the responsiveness of a basic page provided by the portal product vendor on the server and understand if the environment was scalable. The portal theme was used by almost all the application pages and it was obvious that the performance of any of the application pages couldn’t be better than the portal theme tested in isolation. Response time observed – Concurrent users Response time 100 6500 ms 300 10000 ms Test 2 Since the portal server response time and scalability was low, we shifted to the web server to check its performance. Simple html page (~300 kb) was deployed on the web server and loaded with 100 and 300 Concurrent users in 2 different tests. Most of the application static pages were around this size and hence the test was conducted to understand the performance and scalability of the web server. Response time observed – Concurrent users Response time 100 450 ms 300 1100 ms Conclusion from the tests – 1. Response time was unacceptably high on both the web and portal server. 2. Scalability was low. Response time was not consistent and degraded considerably. The requirement was to have response time in the range of 3-5 seconds for application pages. Basic tests pointed to flaws in the environment and hence the focus shifted from the application to the infrastructure optimization. It was observed that the same tests gave much better results when the machine executing the Test agent was moved from its Sub-network A to Sub-network B, in which the rest of the components (Load balancer, Web, App server) resided. The infrastructure team used this observation to analyze and fix the problem in the network components. Results after infrastructure changes – Server
Concurrent
Response
Response
users Web Server Application
100
time (New) 200 ms
time (Old) 450 ms
300 100 300
500 ms 3500 ms 7000 ms
1100 ms 6500 11000 ms
Code was optimized later to meet the SLA’s but removal of the bottlenecks in the environment ensured that the performance improvements/ degradations observed after code changes were a true reflection of the code performance. 3. So, what should one look for? Requests initiated from the performance test agents flow through different infrastructure tiers that form a part of a typical multi-tiered architecture. It is important to validate each of these layers to ensure that there are no anomalies. Rest of the sections explore each layer broadly and identify components that can be bottlenecks. Some techniques to validate the load on the web and application server are also suggested. 3.1 Network setup between performance Test agents and the Load balancer The network setup between the test agents and the load balancer must be identical to the network setup in the production environment. Differences in the network design can cause variations in the arrival rates between the production and performance test environment. The number of network hops between the test agent and the load balancer can affect the time a request takes to negotiate the network to reach the destination. Delays can be introduced at each hop thus affecting the response time.
Figure 2- Multiple hops between Test agent and Load Balancer can impact performance due to the delay added at each hop
Slower data transfer rates can be observed when the devices are located in different sub-networks due to multiple factors like switches, hubs, gateways, routers, port negotiations, security requirements etc during communication across networks. Hence, it is necessary to establish consistency in the sub-network setup on both testing and production environment. Utilities like tracert (on Windows), traceroute (on UNIX) and tracepath (on Linux) can be used to determine the route taken by packets across the IP network to identify the number of hops.
Figure 3- Sample ‘tracert’ output shows the number of hops from my machine to www.google.com domain.
Look for 1. Number of hops between the test agent and the load balancer. The number of hops must be same as that expected in the production environment to prevent differences in the performance results. 2. Response time recorded at each hop. Unusually high response time may indicate an issue at the specific device which will impact the overall response time. Latencies are introduced at each layer like the Proxy server, DNS, Firewalls etc when users connect from their devices to the application. The network bandwidth availability is also different depending on the connection used by the end user – broadband, cellular, dial-up etc. Performance testing exercise is generally conducted by connecting the test agents to the LAN and then executing the test cases. This approach is necessary to isolate the application from other factors like the network to optimize the application under ideal conditions. However, these isolated tests must be complemented by tests that simulate real life connectivity between the end users and the application. Look for 1. Options in the test agent to simulate the network speed. Option of connecting the test agent to the application without by-passing any of the components like Proxy server, DNS etc to identify performance issues with connectivity. 3.2. Test Agents Test agents are typically run on separate machines to ensure that they do not consume the resources of the actual system under tests. However sizing of the machines that host these test agents is not given much importance during the test planning/strategy phase. This leads to situations where the test agents are not able to generate enough load because of resource saturation. It is important to monitor the performance of key metrics on the machines hosting the test agents, as important as it is to monitor metrics on the system under test. Many of the performance testing tools allow de-centralization of the load generation engine by distributing load generating agents on different machines. This feature must be leveraged to ensure that a single machine is not over-loaded while generating the load. Some parameters that can affect the performance of the test agents are listed below. 3.2.1 Network Card and Connections – A common misconception is that connecting test agent machines on a network with higher bandwidth would ensure higher data transfer from the machines. In many older desktops and non-server class machines PCI slots cannot leverage the higher bandwidth network card (example, a Gigabit network card) that is now available. Hence, the capabilities of the network card and the machine must be validated to ensure that an appropriate data transfer rate can be achieved. However, hardware is not the only constraint that limits the capabilities of the agents to leverage the network bandwidth. The operating system must also be tuned to ensure that the available bandwidth can be utilized. The test agents may need to open multiple connections (TCP/IP, UDP etc) to simulate the necessary load. Operating system must be configured to allow the test agent to open connections as per the requirements. For instance, regedit in Windows machines [WINPERF] allows users to set the maximum number of TCPI/IP connections that can be opened from the machine. Some operating servers also allow altering the buffer space for each socket to improve bandwidth utilization. Higher throughput can be achieved by altering the buffer size although at the cost of consuming more kernel memory. Look for
1. Data transfer rate from the test agent using network monitoring tools like Wireshark to ensure that the transfer rate is sufficient for the tests. 2. Network card speed and operating system settings to ensure that appropriate transfer rates are achieved 3.2.2 Log level settings – Test agents log information during the test cycle for debugging purposes. During the performance tests the log levels should be turned to the lowest logging level possible to limit the number of messages that are logged. This helps in reducing the time consumed in logging as well as in reducing the IO operations during the test cycle. 3.2.3. Memory availability (for Java based test agents) The default heap size for Java based test agents (like JMeter and Rational Performance Tester) may not be sufficient. It is necessary to increase the heap size based on the size of the data that is expected to be processed and shared between the test machine and the system under test. 32 bit machines limit the maximum memory that can be allocated to processes and hence if the heap size required is more than 1.5 to 2 GB (actual limit may vary across different systems) it is necessary to split the test agents across multiple machines. The other alternative is to run the test agent on a 64 bit machines. Running on a lower heap than necessary can result in longer garbage collection cycles, increase CPU utilization during the process and thus impact the throughput. Look for 1. Memory utilization patterns on the test agent machine by enabling ‘verbosegc’ or through Admin console. Increase heap size and tune JVM if very frequent or long garbage collection cycles are observed. 3.3 Load balancing Load balancers are used to distribute the load between multiple computing devices in order to optimally utilize the infrastructure and improve performance. During performance testing it is important to check if the requests have been distributed across the cluster as expected. Incorrect distribution can directly affect the arrival rates on some of servers and impact their performance. Some of the areas that must be analyzed are listed below – 3.3.1 Effect of server failures on load distribution Many of the advanced load balancers have the capability to detect server failure and direct traffic to the other available servers. If one or more servers in the cluster fail to respond during the entire or partial duration of the test execution, the load balancer will continue to spread requests across the other available servers. However, since less numbers of server instances are available for processing, the response time as well as the scalability of the application may suffer. Look for Load balancer log files and the web server logs to detect any server failures after every test. 3.3.2 Adaptive load balancers Some of the load balancers are capable of adapting to the changes in the resource utilization and the workload. Servers with high resource utilization (beyond the defined threshold levels) are less loaded compared to other servers by the Adaptive load balancers. Compute intensive activities like report generation, batch execution etc can increase the resource utilization levels on servers and thus trigger changes in the load balancing patterns if the utilization breaches the thresholds. Look for Any resource intensive activities like reporting, batch job etc that is not a part of the expected workload. These activities must be stopped during the course of the testing. In many cases, servers are shared with other applications. These applications must be stopped as well during testing. 3.3.3 Security setup – Many Load balancers offer authentication and authorization features for the connection protocols like SSL. For instance, the certificates exchanged between the client and server is validated using the Online Certificate Status Protocol (OCSP). The additional level of processing introduced at this layer can impact the arrival rates on the application server. Hence it is important that such features if induced through default setup of the product be identified and disabled, if they are not required as per the test. 3.4 Web Caching
Server cache controls can be used to cache frequently accessed content (like java scripts, images, media etc) to improve performance. Application data, for example, master data can also be cached in application server layer to reduce the database access. The performance varies directly based on the proximity of the cache to the useragent (web browser/ mobile devices etc). For example, content will be delivered much faster from Browser cache compared to that from web server cache since the content is delivered from the local disk. Web caches reduce the network traffic and hence the load on the servers. Hence it is important that the performance testing setup must replicate the caching strategy on the production servers and user agent behavior, since it can have a direct impact on the arrival rates. For instance, test agents must be able to replicate browsers that are cache enabled to provide accurate performance results. Likewise the workload mix [SENG03] must ensure an appropriate representation of anonymous and logged in users if user specific content is not cached. Look for Cache hit and miss ratio provided by most web and applications servers can be used to understand the behavior of the cache and to compare it with the expected behavior in production. 4. Validating load on the different servers Performance analysis must first focus on identifying if sufficient load is generated on the system, as a first step. Some mechanisms to identify the load serviced by the different servers in the system are listed below Web server– Web server logs maintain a history of the pages that have been requested by the end user (termed as primary requests). Other files like images/java scripts/ style sheets etc which are requested by the browser to complete the primary request (termed as secondary requests) are also logged. Most web servers log information in the W3C standard format and hence important information like Client IP address, request date and time, HTTP Code, file requested, user agent etc is available in the log files. The information in the log files can be statistically analyzed to understand the arrival rate and the inter-arrival distribution for the duration of performance test [PATE06]. Application server level – Many Application servers associate a worker thread with each incoming request, to process it. Incoming requests are put into a queue, if there aren’t enough threads to process the incoming requests. Software contention represents the time that a transaction needs to wait for an available thread. Level of contention observed on the servers is to get a thread for processing is a good indicator of the load on the server and the servers’ ability to handle the load. Multiple threads in a non-busy state indicate that the number of threads available is more than the number of request arriving at the server. Thread dumps provided by Java based application servers provide good insight into the number of threads that are busy processing the requests and those that are waiting for requests. Assuming that the number of threads is set as per the expected arrival rate on the server, thread analysis can help in understanding if the arrival rate on the server is sufficient as per the requirement.
Figure 4- Sample thread dump of a portal server
In the above illustration, multiple ‘Default’ threads are in an idle state (Object wait) since enough requests are not available for processing. If the number of threads has been defined based on the expected arrival rate then the observation implies that the arrival rate is lesser than the expected arrival rate. 5. Conclusion Analysis of any performance result must begin with a comparison of the actual load applied and expected on the system. Any inconsistency in the workload must be investigated till the bottleneck device/s is identified. Validating
the workload across different infrastructure points is thus a critical activity that must be executed before delving into code optimization. Till then using the performance test result to analyze and optimize the code is a futile exercise since the performance is not truly representative of the systems actual capability. 5. References [WINPERF] http://support.microsoft.com/kb/314053 [SENG03] Workload modeling: a few common myths, Rajeshwari G and Shubhashis Sengupta, February 2003 [PATE06] Approach to Build Performance Model for a Web-Based System from its Application Server Logs, Mitesh Patel, CMG 2006 [WIRE] http://www.wireshark.org/ [TCPDUMP] http://www.tcpdump.org/