University of Iowa
Iowa Research Online Driving Assessment Conference
2007 Driving Assessment Conference
Jul 12th, 12:00 AM
Driver Performance and Workload Using a Night Vision System John M. Sullivan University of Michigan, Ann Arbor
Jonas Bärgman University of Michigan, Ann Arbor
Go Adachi University of Michigan, Ann Arbor
Brandon Schoettle University of Michigan, Ann Arbor
Follow this and additional works at: http://ir.uiowa.edu/drivingassessment Sullivan, John M.; Bärgman, Jonas; Adachi, Go; and Schoettle, Brandon. Driver Performance and Workload Using a Night Vision System. In: Proceedings of the Fourth International Driving Symposium on Human Factors in Driver Assessment, Training and Vehicle Design, July 9-12, 2007, Stevenson, Washington. Iowa City, IA: Public Policy Center, University of Iowa, 2007: 519-526. https://doi.org/10.17077/drivingassessment.1286
This Event is brought to you for free and open access by the Public Policy Center at Iowa Research Online. It has been accepted for inclusion in Driving Assessment Conference by an authorized administrator of Iowa Research Online. For more information, please contact
[email protected].
PROCEEDINGS of the Fourth International Driving Symposium on Human Factors in Driver Assessment, Training and Vehicle Design
DRIVER PERFORMANCE AND WORKLOAD USING A NIGHT VISION SYSTEM John M. Sullivan, Jonas Bärgman, Go Adachi, Brandon Schoettle The University of Michigan Transportation Research Institute Ann Arbor, MI USA E-mail:
[email protected] Summary: Night vision systems (NVS) have the potential to improve the visibility of critical objects at night beyond the levels achievable with low-beam headlamps. This could be especially valuable for older drivers, who have difficulty seeing at night and who are sensitive to glare. However, this benefit may also be accompanied by ancillary costs, such as the additional workload involved with monitoring and interpreting the forward view depicted by the NVS. In this study, we asked young and old subjects to drive at night on a test track while we measured distance and accuracy of target detection, subjective workload, and longitudinal control of the vehicle. In some conditions, direct view of the road was supplemented by a far-infrared NVS with two display configurations: a head-up display mounted above the dashboard, and a head-down display mounted near the vehicle midline. Night vision systems increased target detection distance for both young and old drivers, with noticeably more benefit for younger drivers. Although workload measures did not differ between the unassisted visual detection task and the NVS-assisted tasks, they were greater when driving with a detection task than without. INTRODUCTION There is little dispute that driver vision in darkness is seriously impaired. After controlling for the risk factors other than darkness that are often present at night—such as fatigue, alcohol use, and exposure—the risk of a fatal pedestrian crash is about 4 times higher in darkness (Ferguson, Preusser, Lund, Zador, & Ulmer, 1995; Sullivan & Flannagan, 2002) and the risk of a fatal rearend collision is about twice as high (Sullivan & Flannagan, 2003). In the case of pedestrians, this elevated risk can be explained by drivers’ poor visual detection abilities at the low levels of luminance and luminance contrast, common for a typical pedestrian’s clothing and background environment at night. A pedestrian is often seen only at a very short distance away. When coupled with a high-speed approach, the available time to detect and avoid a pedestrian is often too short. It is less clear how low light levels affect rear-end collisions, especially considering that marker lamps and reflectors are used to enhance a vehicle’s conspicuity in darkness. The effects of darkness can be mitigated somewhat by the use of roadway illumination and/or increased headlamp illumination. However, roadway illumination is both costly and often impractical. Moreover, increased headlamp illumination raises concern about additional glare to other road users. Night vision systems offer a solution that extends a driver’s ability to see objects down the road without increasing glare to other road users. This is accomplished by rendering portions of the invisible infrared spectrum of the forward scene into a visible image on an in-vehicle display. Two forms of night vision enhancement technologies have begun to appear
519
PROCEEDINGS of the Fourth International Driving Symposium on Human Factors in Driver Assessment, Training and Vehicle Design
on vehicles: (1) near infrared (NIR), or active, and (2) far infrared (FIR), or passive, night vision systems. The active NIR systems display reflected radiation emitted by near infrared sources on the vehicle, typically producing images that resemble monochromatic versions of the forward scene illuminated by high-beam headlamps. The passive FIR systems display infrared spectra radiated by warm objects in the forward scene. Displayed objects in passive FIR systems do not appear illuminated as they do in active systems; instead they appear to glow. Typically, warm objects are visually rendered as light images; cold images are visually rendered as dark. In this report, we investigated drivers’ use of a passive, FIR-type night vision system. Both active and passive systems use a display screen to render the forward scene. This requires drivers to switch their gaze periodically between the direct view (out the windshield) and the image presented on the night vision display screen in order to detect a potentially invisible object. It is unclear what kinds of strategies drivers adopt for these systems, whether such strategies increase workload or affect driving performance, and whether they produce a net safety benefit for drivers. For example, one strategy that drivers might adopt could be to consult the display when roadway conditions are sufficiently dark that forward seeing distance is reduced and when pedestrians are likely appear on the roadway. However, drivers may not actually know when their forward seeing distance is impaired (Leibowitz & Owens, 1977) and, based on reports of pre-collision pedestrian awareness (Allen, 1970), drivers often fail to anticipate pedestrian presence near the roadway. If drivers underestimate how often an NVS could be of benefit, it is unlikely to be consulted frequently, limiting its potential safety benefit. (It is conceivable that by using these systems, drivers may learn about their nighttime visual limitations; however, this indirect benefit is somewhat removed from the anticipated direct benefit of the system.) Alternatively, drivers might adopt a strategy in which they consult the display periodically, and unconditionally, to ensure detection of unanticipated objects in the roadway. A strategy like this would involve many more scans of the display than the former, but is more likely to take full advantage of the safety potential of the system. Each scan of a night vision display involves some cost to the driver. For example, there is added effort to redirect the eyes to the display, first to identify objects and then to locate them on the forward roadway. If the driver is relatively unburdened, this workload might easily be absorbed with little consequence to driving performance. However, if the driver is burdened with other tasks, the cost of consulting the night vision display could affect driving performance. In this study, effects on workload are examined indirectly using measures of speed, and more directly using the NASA-Task Load Index (TLX)—a subjective workload rating system (Hart & Staveland, 1988). A driver’s choice of speed has been linked to the level of workload experienced. Drivers reduce speed under conditions of increased workload (Lansdown, Brook-Carter, & Kersloot, 2004). Alternatively, speed choice might also reflect perceived level of risk, such that low risk level encourages higher speed (Stanton & Pinto, 2000). With an NVS, a device that may both increase workload and decrease perceived risk, the net effect on speed choice is uncertain. It is also important to determine whether older drivers obtain any benefit from an NVS. Because visual contrast sensitivity shows the greatest decline in this segment of the driver population, making nighttime driving difficult, older drivers might be expected to benefit most from vision
520
PROCEEDINGS of the Fourth International Driving Symposium on Human Factors in Driver Assessment, Training and Vehicle Design
enhancement systems. Ironically, some prior research suggests that older drivers might not consistently use an NVS (Gish, Shoulson, & Perel, 2002). In the present study, older drivers were compared to younger drivers to determine if either detection performance or measures of workload would reflect any age-related differences in the effectiveness of the night vision systems. Finally, we compared two display implementations that differed in mounting position and accommodative distance to determine if the different presentations affected detection performance or workload. METHOD Overview. The primary research question addressed in this study is whether drivers experienced added workload while using an NVS. Workload was assessed with two measures: indirectly using average speed and directly using subjective workload assessed with the NASA Task-Load Index (TLX) questionnaire. Detection performance, including detection distances and errors, was also evaluated. Secondary questions involved age-related performance differences, effects of target size on detection, and the location of the IR displays. Participants drove on an unlit closed test track (a 4.4-km oval) at night, making two circuits in each of four driving conditions. In two of these conditions, drivers used an NVS equipped with either a head up display (HUD condition) or a head-down display (HDD condition). With the help of these systems, they were asked to perform a target-detection task. The task required them to report when they first saw one of three targets randomly positioned along the roadside: a deer decoy, a small-animal decoy, and a pedestrian. The same task was also performed without the help of an NVS (Visual-Detection condition). A fourth, No-Detection condition, was also included in the study to obtain baseline measures of workload for driving on the darkened test track, unburdened by the detection task. Subjects. Twelve paid subjects participated in the experiment. There were six younger subjects (ranging in age from 20 to 29 years old, with a mean of 24.9), and six older subjects (ranging in age from 63 to 73 years old, with a mean of 68.3). In each age group there were three females and three males. All subjects were licensed drivers with normal or corrected to normal vision. Apparatus. Participants drove a vehicle fitted with a forward-looking FIR night-vision camera mounted on the front of the vehicle. The camera’s field of view was 25 degrees horizontal, centered on the forward roadway, and 8 degrees vertical, offset one degree downward. This provided a clear forward view of a pedestrian 1.8 m tall at a distance of approximately 20 m. The monochromatic camera output was displayed on either HUD located on top of the dashboard on the driver’s side, viewable over the steering wheel (horizontally centered and approximately 12 degrees down), or a HDD mounted at the driver’s lower right (53 degrees right and 25 degrees down). The HUD and HDD were both LCD-type displays with similar angular extent; however the HUD required less accommodative adjustment between the forward scene and the display. Further details of the display and method are described in Sullivan, Bärgman, Adachi, and Schoettle (2004). Targets. Three kinds of detection targets were used in the study: a large deer-shaped decoy, a small low-lying decoy designed to resemble a small animal, and standing pedestrians. The
521
PROCEEDINGS of the Fourth International Driving Symposium on Human Factors in Driver Assessment, Training and Vehicle Design
decoys were heated to be easily imaged on the NVS. Targets were visually and thermally concealed and exposed using black plywood blinds or cardboard shrouds. Pedestrian targets were experimenters. On pedestrian trials, they stood stationary, dressed in dark clothing, at the side of the road facing the approaching vehicle. For all targets, average reflectance was 10% under lowbeam headlamp lighting conditions. Target placement was restricted to the left and right sides of the roadway (never directly in the roadway) along straight sections of the track. The number of targets and their positions were changed after each trial to limit a driver’s ability to anticipate their location. For each detection condition, drivers made two circuits around the track, encountering between six and eight targets. In an experimental session, drivers had the opportunity to detect a total of 22 targets. Procedure. Drivers were given a brief orientation describing the appearance of warm objects in FIR night-vision displays, along with some photographic examples of the display and the detection objects. The experimental session began with a practice loop around the test track to familiarize drivers with the overall driving environment. Drivers were advised to maintain speed between 56 and 64 km/h (35-40 mph) and to use only low-beam headlamps. Upon completion of practice, experimenters configured the vehicle for one of the four drive conditions (HUD, HDD, Visual Detection, or No Detection) and positioned targets around the track. After brief instruction about the upcoming experimental condition, drivers made two circuits around the test track. During each circuit, they were asked to verbally report the moment they saw a target, whereupon the experimenter recorded a digital mark in the data record so that the vehicle’s position at the time of detection could be determined. The experimenter also noted the object’s identity, if reported, by the driver. Immediately following completion of each driving condition, the NASA-TLX subjective workload questionnaire was administered. The order of the drive conditions on target positioning was counterbalanced across subjects. To summarize, the experimental design examined the effect of four driving conditions: HUD, HDD, Visual Detection, and No Detection); three target types (deer, small animal, and pedestrian); and age (old and young) on five dependent measures: (1) Detection percent— defined as the percentage of targets detected at or before passing the target ; (2) Detection distance—defined as the straight-line distance between the vehicle and the target object when detection was reported; (3) Average vehicle speed—computed as the average speed on the straight sections of the track; and (4) Subjective workload index—collected for each drive condition. Note that detection measures were only available for detection trials, but speed and subjective workload measures were available for all trial types. RESULTS Detection Performance Detection accuracy. A logistic regression was conducted on the pooled data to assess the probability of detection as a function of each independent variable. A significant effect of age was found. Using the resulting model coefficients shown in Table 1, an older male driver’s odds (the ratio of detections to non-detections) of detecting a pedestrian while driving with the HDD B display are about 7 ( e Intercept ). For a young male in the same condition, the odds are about 55
522
PROCEEDINGS of the Fourth International Driving Symposium on Human Factors in Driver Assessment, Training and Vehicle Design
(B
+B
)
( e Intercept Young ). (In terms of detection probability, this is equivalent to the difference between a 0.88 probability of detection and a 0.98 probability.) An effect of target type was also found, suggesting that the small-animal decoys were more difficult to detect than the pedestrian or deer targets. No effect of the presence of an NVS on target detection was observed. Table 1. Results of logistic regression of the odds of detecting a target under each condition Conditions Age Young Old Gender Female Male Drive Condition HDD Visual HUD Target Types Pedestrian Small Animal Deer Intercept
B
S.E.
Wald
df
Sig.
eB
2.08
0.52
16.13
1
0.00*
7.98
0.33
0.41
0.62
1
0.43
1.38
0.52
2
0.77
0.18 0.51
1 1
0.67 0.48
10.84
2
0.00*
0.21 0.36
0.49 0.51
1.23 1.43
-1.68 -.45
0.67 0.70
6.34 .40
1 1
0.01* 0.53
0.19 0.64
1.94
0.69
7.79
1
0.01
6.935
* Indicates a statistically significant effect.
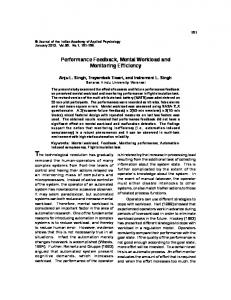
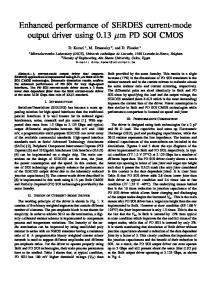
Detection Distance. Analysis of variance on detection distances revealed significant main effects of age (F(1,8.2) = 5.4, p < .05), target type (F(2,186.9) = 14.6, p < .01) and drive condition (F(2,186.8) = 6.7, p < .01). Younger drivers detected objects at longer distances (89.3 m) than older drivers (48.0 m), all drivers detected the large targets (pedestrian and deer) at longer distances (67.5 and 88.2 m) than the small targets (41.8 m), and all drivers had longer detection distances using the night-vision systems than without them (shown in Figure 1). A pairwise comparison between the HUD and HDD conditions, however, did not indicate a significant advantage of one display type over the other (p > .50). An interaction was also found between driver age and drive condition (F(2,186.8) = 3.4, p < 0.05) such that the older drivers’ detection distance did not benefit as much as that of younger drivers when using the night vision systems (see Figure 2). Subjective Workload and Driving Performance
NASA Task Load Index (TLX). A repeated measures analysis of the task load index that examined the factors of gender, age, and drive condition (including the free driving condition) found a main effect of drive condition (F(1.3, 10.2) = 11.8, p < .01) on reported workload. No other factors appeared to influence subjective workload. In examining the pairwise effects of the drive conditions, it was clear that the workload measure reflected the added workload associated with the task of detecting and reporting the target objects (the workload index for the detection tasks were about twice as large as for the no-detection task), but did not distinguish between searching using unassisted vision, HUD, or HDD.
523
Detection Distance (meters)
PROCEEDINGS of the Fourth International Driving Symposium on Human Factors in Driver Assessment, Training and Vehicle Design
100 75
81.9 69.1 46.5
50 25 0 HUD
HDD
Unassisted
Condition
Detection Distance (meters)
Figure 1. Average detection distance of the targets across conditions using the HUD and HDD night vision systems and unassisted visual detection
125 Old Young
100 75 50 25 0 HUD
HDD
Visual
Condition
Figure 2. An interaction effect was observed between driver age and detection distance.
Average Speed. A repeated measures analysis of average speed on straight sections of road echoed the results of the NASA task load index, finding a main effect of condition on driving speed (F(3,24 )= 7.1, p < .01). Average speed in the free driving condition was 1 to 2 mph faster than in the visual, HUD, and HDD conditions. Pairwise comparisons of the average speed of the visual, HUD, and HDD conditions found no differences among the conditions. DISCUSSION AND CONCLUSION Overall, the night vision system investigated in this study improved detection distances for all observers without producing a measurable increase in workload in the target-detection task. In particular, we note that the night vision systems increased detection distances for both young and old drivers, as indicated by the main effect of drive condition (Visual, HUD, or HDD) on detection distance (see Figure 2). This result differs from the findings of (Gish et al., 2002), in which the primary observed benefits seemed to be restricted to younger drivers, under conditions of glare, and for pedestrian targets. In contrast, the interaction found here between drive
524
PROCEEDINGS of the Fourth International Driving Symposium on Human Factors in Driver Assessment, Training and Vehicle Design
condition and driver age suggests that older drivers experience some benefit, albeit less then younger drivers. Overall, the current detection results are also consistent with prior research indicating an agerelated decline in contrast sensitivity and acuity in darkness (Ball et al., 1998; Sturr, Kline, & Taub, 1990). This diminished visual capability among older drivers is likely responsible for the missed target detections and the shorter detection distances observed here. The results also suggest that, while the night vision systems might improve detection distance, they do not substantially improve the likelihood of target detection. Among younger drivers, target detection was 96% (relatively high) whereas among older drivers, detection was only 78%. Finally, the results of the subjective workload measure (NASA-TLX) indicate that, although drivers judged the task of looking for and reporting objects at the side of the roadway increased workload, they did not distinguish a workload difference based on the presence or absence of an NVS. This interpretation is also supported by the average speed measures—while higher speeds, indicative of lighter workload, were observed for the free driving condition, little difference was found among the visual, HUD, or HDD driving conditions. ACKNOWLEDGMENTS This research was supported by the University of Michigan Industry Affiliation Program for Human Factors in Transportation Safety. Information about the Affiliation Program is available at http://www.umich.edu/~industry. REFERENCES Allen, M.J. (1970). Vision and highway safety. Philadelphia: Chilton. Ferguson, S.A., Preusser, D.F., Lund, A.K., Zador, P.L., & Ulmer, R.G. (1995). Daylight saving time and motor vehicle crashes: the reduction in pedestrian and vehicle occupant fatalities. American Journal of Public Health, 85(1), 92-95. Gish, K.W., Shoulson, M., & Perel, M. (2002). Driver behavior and performance using an infrared night vision enhancement system. Paper presented at the 81st Annual Meeting of the Transportation Research Board, Washington, DC. Hart, S.G., & Staveland, L.E. (1988). Development of NASA-TLX (Task Load Index): results of empirical and theoretical research. In P. A. Hancock & N. Meshlcati (Eds.), Advances in psychology: human mental workload. North Holland: Elsevier Science, 139-183. Lansdown, T., Brook-Carter, N., & Kersloot, T. (2004). Distraction from multiple in-vehicle secondary tasks: vehicle performance and mental workload implications. Ergonomics, 47(1), 91-104. Leibowitz, H.W., & Owens, D.A. (1977). Nighttime driving accidents and selective visual degradation. Science, 197(4302), 422-423. Stanton, N.A., & Pinto, M. (2000). Behavioural compensation by drivers of a simulator when using a vision enhancement system. Ergonomics, 43(9), 1359-1370.
525
PROCEEDINGS of the Fourth International Driving Symposium on Human Factors in Driver Assessment, Training and Vehicle Design
Sullivan, J.M., Bärgman, J., Adachi, G., & Schoettle, B. (2004). Driver performance and workload using a night vision system (Technical Report No. UMTRI-2004-8). Ann Arbor, MI: The University of Michigan Transportation Research Institute. Sullivan, J.M., & Flannagan, M.J. (2002). The role of ambient light level in fatal crashes: inferences from daylight saving time transitions. Accident Analysis & Prevention, 34(4), 487498. Sullivan, J.M., & Flannagan, M.J. (2003). Risk of fatal rear-end collisions: is there more to it than attention? Paper presented at the Second International Driving Symposium on Human Factors in Driver Assessment, Training and Vehicle Design, Park City, Utah.
526