Mar 11, 1999 - particles colliding immersed in a gas, the phenomena have been current research. ... rebound, as opposed to stick, when dropped on a surface with ... attached to a particle that starts from rest at some initial angle, tic impact ...
Mechanics of Immersed Particle Collisions Roberto Zenit Postdoctoral Scholar.
Melany L. Hunt Associate Professor. Division of Engineering and Applied Sciences, California Institute of Technology, Pasadena CA 91125
1
The present work investigates the mechanics of particle collisions submerged in a liquid using a simple pendulum experiment. Particle trajectories for different particles in water are measured using a high-speed digital camera and the magnitude of the collision is recorded using a high-frequency-response pressure transducer at the colliding surface. The particle deceleration occurs at distances less than half a particle diameter from the wall. The measured collision impulse increases with impact velocity and particle mass. Comparisons are drawn between the measured pressures and the predictions of basic impact mechanics assuming a perfectly elastic collision. A control-volume model is proposed that accounts for the fluid inertia and viscosity. When a particle approaches a planar surface or another particle, the fluid is squeezed prior to contact, reducing the initial kinetic energy and decelerating the particle. The pressure profile is integrated over the surface of the particle to obtain a force that is a function of the initial particle Reynolds number, Reo , and the ratio of the densities of the particle and fluid phases, rp / rf . The model predicts a critical Stokes number at which the particle reaches the wall with zero velocity. Comparisons between the proposed model and the experimental measurements show qualitative agreement.
Introduction
Interest in particulate two-phase flows arises from industrial applications and many natural processes such as fluidized beds, pneumatic transport, filtration processes, erosion, dune formation, and land slides. In many cases, the collisions of particles against themselves and against walls may affect the properties of the mixture. Efforts have been made to describe the fundamental mechanics of particle collisions. Dry collisions have been studied since the beginning of the century (Johnson, 1985) and the rebound and energy losses can be modeled for most simple cases with few exceptions. The mechanics of liquid immersed collisions remain a subject of current research. When a particle approaches a rigid planar surface, or another particle, the fluid film must be expelled for contact, resulting in a pressure increase. In this process some kinetic energy is dissipated or transferred to the fluid. Depending on the magnitude of the dissipation the contact may or may not result in a rebound of the particle. 1.1 The Impact Paradox. As a particle approaches a wall, the gap between the surfaces and the Reynolds number based on the gap decrease. Using the creeping flow approximation, Happel and Brenner (1965) calculated the pressure profile around the particle approaching a wall. The net force exerted by the fluid on the particle grows infinitely as the gap tends to zero. Therefore, direct contact never occurs. Davis et al. (1985) modified the creeping flow model by allowing elastic deformation of the approaching surfaces due to a hydrodynamic pressure built up. Some of the kinetic energy is stored as elastic deformation. Hence, rebound is possible, but physical contact between the two surfaces does not occur. If the flow around the particle approaching a wall is inviscid and irrotational, the hydrodynamic force on the sphere can be calculated in the form of added masses and the flow can be resolved in a non-explicit form in terms of an infinite series of doublets (Milne-Thomson, 1950). Landweber and Shahshashan (1992) obtained a simplification that allows the accurate calculation of the hydrodynamic forces when the two surfaces are Contributed by the Fluids Engineering Division for publication in the JOURNAL FLUIDS ENGINEERING . Manuscript received by the Fluids Engineering Division January 21, 1998; revised manuscript received October 6, 1998. Associate Technical Editor: J. K. Eaton. OF
Journal of Fluids Engineering
/ 9914$$mr09
very close to each other. As in the creeping flow case, the hydrodynamic force grows unbounded when the distance between the two surfaces tends to zero. This effect is due to the discontinuity of the velocities between the moving particle and the stationary plane. The question remains. What happens when the distance between the two surfaces tends to zero? If the velocity of approach is small, the viscous effects would dominate, and most of the kinetic energy would be dissipated in viscous friction. But in the case when the velocity of approach is large, it has been experimentally observed that particles come into ‘‘apparent contact’’ and rebound freely (McLaughlin, 1968). In the case of particles colliding immersed in a gas, the phenomena have been explored assuming that the continuum mechanics assumptions are no longer valid when the gap distance is comparable with the mean free path of the gas molecules (Sundararajakumar and Koch, 1996; Hocking, 1973). In the case of a liquid, the mean free path is nearly zero and the continuum assumptions are expected to hold up to distances of tens of molecular diameters. Smart and Leighton (1989) argued that contact could take place through the surface roughnesses, viewed as sharp edges in the microscopic scale. Some studies have suggested that under the compression levels generated during a collision, the liquid in the gap solidifies for a brief time period (Gee et al., 1990), and therefore the collision pressure is transmitted between surfaces without physical contact. Studies with detailed experimental measurements have been rare. Using a thin layer of fluid, Lundberg and Shen (1992) performed measurements of the collisional coefficient of restitution for steel and nylon particles and obtained correlations for the coefficient of restitution as a function of the kinematic viscosity. Their results showed decreasing values of the coefficient of restitution for increasing viscosities, and also concluded that the impact velocity had a negligible effect on the measured coefficient of restitution. Barnocky and Davis (1988) conducted experiments to find the conditions under which a particle would rebound, as opposed to stick, when dropped on a surface with a thin layer of fluid. McLaughlin (1968) dropped steel particles under gravity through a viscous fluid onto a solid surface. Position-time curves were obtained using high-speed photography. For higher impact velocities the viscous effects became smaller. A critical Reynolds number was found at which the particle did not rebound after contact.
Copyright q 1999 by ASME
03-11-99 12:54:22
asmea
ASME: J Fluids
MARCH 1999, Vol. 121 / 179
released from an initial angle and photographed for part of one oscillation cycle. The measurements were then compared with the prediction of an immersed pendulum. The model used the unsteady drag model proposed by Mei (1994), valid for a sphere at finite Reynolds numbers. The equation of motion of an immersed pendulum in a stagnant fluid is Ì 2s 4 4 pa 3 2 Å pa 3 ( rp 0 rf )g sin (s/L) 3 Ìt 3 0
2 Ì 2s Ìs rf pa 3 2 / 6pmaf(t) 3 Ìt Ìt 0 6pma 2
*
t
H(t 0 t )
0`
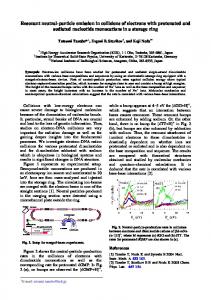
Fig. 1 Experimental setup and typical pressure pulse resulting from a collision of a 6 mm glass particle in water. Maximum pressure Å 17.1 1 10 04 Pa. The dashed line represents the time-pressure trace produced by a perfectly elastic collision.
The present article provides documentation for particle-wall collisions when the effect of the density and the viscosity of the fluid are not negligible. Using a pendulum, spheres of various diameters and densities submerged in water impact a wall. The trajectory of a particle before and after impact and the strength of the impact are measured. Additionally, a model is proposed to account for the effects of the fluid as the particle approaches a wall prior to collision. The results provide information on individual particle-wall (or particle-particle) collisions needed in theoretical models and computer simulations of particulate liquid-solid flows.
2
Experimental Setup
In Fig. 1, a single pendulum is shown using a fine string attached to a particle that starts from rest at some initial angle, ui . On the wall, at u Å 0, a high-frequency response pressure transducer was flush mounted. A suction system positioned the particle and released it from rest without rotation. Once released, the particle accelerated towards the pressure transducer. The motion of the particle was recorded using high speed digital camera, able to record images up to 500 frames per second. When the collision was sensed by the pressure transducer, the trigger system activated the digital camera, storing images before and after the impact. The images were digitally processed to calculate the centroid of the particle for different times. The velocity was calculated from the displacement of the particle centroid between consecutive images. A typical pressure signal is presented in Fig. 1 consisting of a positive spike, followed by a decaying oscillation, which results from the dynamics of the membrane. The liquid used for all the experiments was deionized water. The manufacturer’s calibration of the high-frequency response pressure transducer was corroborated by comparing the results of dry impacts with Hertzian theory predictions (Zenit, 1997). The uncertainty in the measurement of displacements and velocities was estimated to be {3.5 percent, arising from the imprecision of the pixel resolution of the imaging system. The pressure and impulse measurements have an uncertainty of {2 percent, resulting from the performance of the pressure transducer. 2.1 Immersed Pendulum Equation. To verify the experimental technique, measurements were taken for a swinging immersed pendulum with no colliding wall. A particle was
03-11-99 12:54:22
S D Ìs Ìt
dt
(1)
where s is the arc-length position, L is the length of the pendulum string, rp and rf are the densities of the solid particle and the fluid, respectively, Ìs/ Ìt is the velocity of the particle, f(t) is a drag force function, H(t) is the history force kernel and a is the radius of the particle. This equation was solved numerically. Figure 2 shows a comparison of the predicted phase plot against the experimental results obtained for a glass particle of 6 mm diameter with a pendulum length of 97 mm. Several experimental runs were taken under the same nominal conditions. The experimental measurements are within five percent of the theory. Errors arise, in part, from the determination of the centroid of a particle with a discrete number of pixels. No attempt was made to account for the drag force exerted on the string. 2.2 Measurement of the Collision Impulse. The strength of collision was quantified by its collision impulse. The collision impulse is defined as IÅ
*
t
P(t)dt
(2)
0
where P(t) is the pressure signal produced during an individual impact, and t is the duration of the main pressure pulse. The pressure reverberations were ignored. Assuming a perfect elastic impact, the pressure impulse resulting from a collision based on simple mechanics predictions, IMP , is IMP Å 2ui mp /Atr
(3)
where ui is the impact velocity, mp is the particle mass and Atr
Fig. 2 Phase plot of an immersed pendulum. Model predicted by Mei (1994) (solid lines). Experiments: ui Å 137 (1); ui Å 77 (s). (Uncertainty in velocity {3.5%, in distance {3.5%)
180 / Vol. 121, MARCH 1999
/ 9914$$mr09
Ì Ìt
Transactions of the ASME
asmea
ASME: J Fluids
Table 1
Properties of particles used in experiments
Material
dp, mm
rp/rw
ut, mm/s
Ret
Glass 1 Glass h Glass s Steel L Nylon n
3.00 4.00 6.00 4.50 6.35
2.54 2.54 2.54 7.78 1.14
318 368 474 896 136
954 1338 2583 3665 785
is the active area of the pressure transducer. The properties of the particles used in the experiments are presented in Table 1. The experimental measurements of the impulse showed scatter, which appear to result from the nature of the experiment and not from the imprecision of the measuring techniques. Other researchers have found similar behavior when studying contact or collision of particles (Campbell, 1997), attributed to the modification of the surface properties resulting from contact itself. To assess the variance of the measurements, histograms were constructed. For a typical set of data, the standard deviation was of 6 percent. The maximum value measured was 11% higher than the mean, and the minimum was 23 percent lower than the mean.
3
Results
3.1 Approach and Rebound. Figure 3 shows a typical position-time and velocity-time plot of the pendulum motion during the approach and rebound of a particle. The case shown corresponds to the motion of a 6 mm glass particle with a pendulum length of 107 mm, and an initial release angle of 12 deg. The pendulum equation (dashed lines) predicted an impact velocity of 117 mm/s. The experimental measurements agree with the pendulum equation prediction for distances at about half a diameter away from the wall. Close to the wall a significant deceleration is observed. Note that after the particle has rebounded from the wall, its velocity continues to increase. In a dry collision the maximum velocity of rebound occurs at the moment when the particle loses contact with the wall. In the case of an immersed collision, the fluid appears to accelerate the particle after it has lost contact with the wall. As the particle moves further from the wall, its velocity decreases. A similar behavior was found for all cases. The distance at which the wall begins to affect the motion of the particle was observed to increase for smaller velocities of approach and for smaller and lighter particles. The measurement of the coefficient of
Fig. 3 Position-time and velocity-time plots for a 6 mm glass particle, immersed in water. Comparison between pendulum equation predictions (dashed lines) and experiments (s). ui Å 127. Predicted impact velocity 117 mm/s. (Uncertainty in velocity {3.5%, in distance {3.5%)
Fig. 4 Measured collision impulse as a function of impact velocity (E, experiment). The lines represent the predictions from collision mechanics (MP, mechanics prediction). (Uncertainty in predicted impact velocity {4%, in collision impulse {2%)
restitution of immersed collisions can be found in Zenit and Hunt (1998). 3.2 Collision Impulse. Figure 1 compares the pressure pulse generated by the typical collision of a 6 mm glass particle against the prediction from Hertzian theory. The theory of Hertz is appropriate for dry collisions and requires the velocity of the impacting particle. To compare the time-pressure variation an impact velocity is chosen that predicts the same maximum pressure. Tabulated elastic properties of the glass particle are used (Eglass Å 70 GPa, nglass Å 0.22). For this case the impact velocity predicted by the pendulum equation is 72 mm/s, and the value used in the Hertzian comparison is 58 mm/s. The Hertzian calculation represents the maximum pressure for an ideal collision in which the fluid has no effect and the surfaces are smooth and perfectly elastic; therefore, it serves as a base to assess the total effect of the fluid during the collision. While the ideal prediction is symmetric with respect to the point of maximum pressure, the experimental pressure pulse is wider and slightly asymmetric. This asymmetry may be the result from the pressure build up due to the presence of the fluid. Before the solid surfaces contact a considerable hydrodynamic pressure is exerted on the surface of the transducer. Note that, since the internal structure of the pressure transducer is unknown, a correction for the Hertzian theory to account for nonidealities of the colliding surface is not possible. 3.3 Impact Velocities and Collision Impulses. Figure 4 shows the measured collision impulse as a function of the predicted impact velocity for three different glass particle diameters, 4.5 mm steel particles and 6.35 mm nylon particles in water. The velocity of impact, ui , is assumed to be that predicted by the pendulum equation (Eq. (2)). This velocity is a function of the initial position of the particle and serves as measure of the initial potential energy of the particle. Hence, it does not account for the effect of the wall. The predictions from Eq. (3) are also shown in the plots. The experimental measurements follow the prediction from Eq. (3) and indicate an increase in collision impulse with particle mass and velocity of impact. As expected, the measured collision impulse is smaller than that predicted by the theory for the same impact velocity. The difference between the ideal prediction and the measurements is the total effect of the interstitial fluid. Following Eq. (3), the collision impulse results are nondimensionalized using ˆI Å I/IMP , where I is the measured colli-
Journal of Fluids Engineering
/ 9914$$mr09
03-11-99 12:54:22
MARCH 1999, Vol. 121 / 181
asmea
ASME: J Fluids
Fig. 7 Schematic of the problem and coordinate system. Control volume: momentum and mass fluxes. Fig. 5 Normalized collision impulses as a function of the Stokes number. For symbol identification see Table 1. (Uncertainty in normalized collision impulse {8.5%, in Stokes number {4.5%)
sion impulse and IMP is the impulse based on the predicted impact velocity. The normalized results are shown in Fig. 5 in terms of the Stokes number. The Stokes number is defined as St Å (Re/9)( rp / rf ), where Re is the Reynolds number, defined as Re Å (ui dp rf )/ mf . The data forms a single band of values. For small Stokes numbers the normalized impulse is small. Clearly, the deviation from the mechanics prediction increases for decreasing values of the Stokes number indicating increasing importance of the viscous effects. The normalized impulse measurements can be interpreted as the experimental impact velocity (as implied from the measured impulse) divided by the theoretical impact velocity. Clearly, the deviation from ˆI Å 1 is a measure of the retardation caused by the fluid between the sphere and the wall. Therefore, Iˆ can be used to calculate a reduced impact velocity ui ( red ) Å ui IO and to calculate a reduced Stokes number, Stred Å St(ui ( red ) /ui ). Figure 6 shows the reduced Stokes number (based on the reduced value of the impact velocity) as a function of the Stokes
number. If the fluid had a negligible effect on the collision of the sphere then Stred would be equal to St.
4
Modeling
To predict the effect of the fluid as a spherical particle approaches a flat solid wall, an approximate model based on a control volume is proposed. Consider a spherical particle, as shown in Fig. 7, moving towards a flat wall, which center is positioned at b(t) at some instant t in time, immersed in a viscous and incompressible fluid; h(r) is the distance from the surface of the sphere to the wall. The velocity and acceleration of the sphere moving towards a solid boundary are therefore bg and bE respectively. The motion of the particle in the z-direction will impose a radial velocity ur to the fluid in the gap. For contact, the fluid in between the particle and the wall has to be displaced. Therefore, some kinetic energy of the particle will be transferred to the fluid, and some will be dissipated in viscous friction. The control volume, as shown in the right of Fig. 7, is a cylindrical shell of infinitesimal thickness dr (shaded area). Assuming that the flow in the gap is axisymmetric ( Ì / Ìu Å 0) and purely radial (uu Å (ur , 0, 0)), and that the pressure field is uniform with respect to the z direction, the mass and momentum balances for the control volume can be obtained. The assumption that the fluid motion is unidirectional is rigorously valid only in the region near r Å 0; since most of the pressure build up is expected to occur in that region, the assumption is valid as a first approximation. The mass conservation analysis leads to urh Å 0
r hg 2
(4)
where ur is the mean radial velocity of the fluid in the gap, h(r) is particle profile and hg is the velocity at which the particle is moving. The equation obtained from the momentum balance is r
Ì Ì 1 Ì 2r (urh) / (u 2r hr) Å 0 (Phr) 0 tw rf Ìr rf Ìt Ìr
(5)
where P(r) is the pressure in the fluid in the gap and tw is the wall shear stress. Combining Eqs. (4) and (5) and integrating over r an explicit expression for the pressure P(r) in the gap is obtained P(r) Å Fig. 6 Reduced Stokes number as a function of Stokes number. For symbol identification see Table 1. (Uncertainty in reduced Stokes number {13%, in Stokes number {4.5%)
rf r 2hE rf 0 6 h 4
03-11-99 12:54:22
rhg h
2
0
2 hr
* r * t dr * r
w
(6)
0
To account for the viscous shear stress a simple model is
182 / Vol. 121, MARCH 1999
/ 9914$$mr09
S D
Transactions of the ASME
asmea
ASME: J Fluids
used, which assumes the effects of viscosity remain in a thin layer of fluid near the surfaces tw Å m
du dz
Z
Ém
w
ur d
(7)
where d represents the thickness of the viscous fluid layer. Note that this formulation differs from that suggested by lubrication theory. The total force exerted by the fluid on the particle is obtained by integrating Eq. (6) over the projected area of the particle, assuming that the pressure outside the gap is a constant Po (zero for convenience), F(t) Å
*
* P(r)rdr a
P(r)dA Å 2p
0
A
Å 2p
rf hE 6
* rh* a
3
* rh* dr * 1 r9 mhg 02p dr 9 G dr * F * * d h h
dr * 0 2p
0
a
rf hg 2 4
3
2
0
r=
a
2
(8)
0
0
To calculate the force, an expression for the for the the particle profile, h(r), is needed. For a spherical particle the exact profile is q
2
h(r) Å h0 / a 0 a 0 r
2
(9)
To make the integrals simpler, an approximation for the profile is used r2 r2 h(r) Å h0 / / . . . Å (b 0 a) / / . . . a a
mf t c a O FO (tO ) Å A(bO )hOE 0 B(bO )hOg 2 0 C(bO ) hg rf a 2 d
(11)
where FO (tO ) is normalized by rf (a/tc ) 2a 2 and A(bO ), B(bO ) and C(bO ) are functions of bO defined as p 6
B(bO ) Å
p 4
S S
1 0 (bO 0 1) log bO 0 1 0 1 / log bO
S S D
C(bO ) Å p log
bO bO 0 1
0 tan
S DD S DD S DD
01
hOE (mP / A(bO )) Å B(bO )hOg 2 / C(bO )KhOg
bO bO 0 1
where K Å ( mtc / rf a )(a/ d ). Equation (13) is a second order non-linear ODE, which can be solved numerically. The characteristic time tc can be now specified as tc Å a/hg 0 . The set of initial conditions is hOg (t Å 0) Å 1 hO (t Å 0) Å 2. In this case the particle has a velocity hg 0 at a distance 2a (a diameter) away from the wall. The coefficient K in Eq. (13) becomes KÅ
1
4.1 Particle Equation of Motion. Once an expression for the force on the particle has been obtained, it can be incorporated in the equation of motion of the particle and solved to obtain the deceleration of the particle prior to collision, (12)
ˆ is the normalized mass of the particle defined as m ˆ Å where m rp / rf . Grouping terms
(15)
C0 Re0
(16)
q
where C0 is a proportionality constant (C0 Å 0.03 was chosen for these calculations). The figure shows that for decreasing Reynolds number the deceleration of the particle is higher. The prediction of a finite impact velocity results from the assumed scaling law to account for viscous effects. In the proposed model the viscous force scales with the particle radius, a, and not with the particle-wall gap, h, as suggested by the lubrication theory. A critical Stokes number can be found for each density ratio at which the particle reaches the wall with zero velocity. Below that critical value, the particle stops completely before reaching
Journal of Fluids Engineering
03-11-99 12:54:22
d 1 }q a Re0
KÅ
where bO Å b/a.
/ 9914$$mr09
(14)
therefore
2
bO 0 1
0 FO Å mP hOE
2mf a 2 a Å rf 2ab0 d Re0 d
where Re0 is the initial Reynolds number. Figure 8 shows results obtained from this model in terms of the nondimensional approach velocity (bg /bg 0 ) and the dimensionless distance from the wall, hO 0 . The first three lines show the effect of the density ratio for an inviscid collision. The particle impact velocity, e.g., the velocity at hO 0 Å 0, is larger for a larger density ratio. Also shown are results at a fixed density ratio ( rp / rf Å 2.5) and for Reynolds numbers from 10 to 1000. The value of the parameter K was calculated assuming that
bO bO 0 1 q
(13)
2
(10)
which makes the expressions tractable, yet preserves the geometric characteristics of the curved surface. For convenience the expressions are non-dimensionalized, rˆ Å r/a, hO Å h/a, tO Å t/tc , with tc a characteristic time, to be specified. Using these and integrating using the simplified profile (Eq. 10), the expression obtained for the nondimensional force is
A(bO ) Å
Fig. 8 Phase plot of nondimensional velocity as a function of nondimensional distance for different density ratios and Reynolds numbers
MARCH 1999, Vol. 121 / 183
asmea
ASME: J Fluids
Fig. 9 Normalized collisional impulse as a function of impact Stokes number. Comparison between the 6 mm glass particle experimental measurements and the predictions from the model for different values of the proportionality constant Co . (Uncertainty in normalized collision impulse {8.5%, in Stokes number {4.5%)
the wall. The calculated value of the critical Stokes number can be curve fitted and is approximated by Stcr Å
e 0 p rf . C 20 rp
(17)
The existence of this critical value of the Stokes number is in agreement with experiments performed by McLaughlin (1968). As the density ratio decreases, the critical Stokes number decreases. Hence, as the particles become lighter the viscous forces become more dominant and therefore the stoppage Stokes number increases.
5
Comparisons With Experiments
To validate the predictions from the model, a comparison with the experimental measurements is presented. Using the velocity of the particle at a distance of one particle diameter from the wall as an initial condition, the model can be used to predict the velocity of the particle prior to collision. Once the corrected value of the impact velocity is known, a new estimate of the collision pressure can be calculated using Eq. (3). Figure 9 shows a typical comparison of the normalized measured collision impulse as a function of the Stokes number, based on the predicted impact velocity. The different dashed lines show the predicted impulse when the impact velocity is corrected using the model, for different values of the proportionality constant C0 .
6
Conclusions
Immersed collisions of particles were studied experimentally using a simple pendulum, with a high-frequency response pressure transducer to record the collision impulse and a high-speed digital camera to observe the trajectory. For the current experiments, the effects of the wall were not significant for distances greater than a diameter away from the wall. The dynamics of the rebound were found to be more complex than in the dry case, and indicated that the particle accelerated after rebound
due to the fluid motion. The measured collision impulse was found to increase with the particle mass and impact velocity, following the trends suggested by simple mechanics. When the impulse measurements were normalized by the particle mass and the predicted impact velocity, the data collapsed into a single band of values. By comparing with the prediction from simple mechanics, it was observed that the effect of the interstitial fluid increased for decreasing particle Stokes number. An approximate control-volume model was proposed to account for the effects of the liquid as the particle approaches a wall. The model predicts the hydrodynamics force produced by the drainage of the fluid in the gap between the particle and the wall. The model assumes that the flow is the gap is nearly unidirectional and that the viscous effects scale with the particle radius. The deceleration prior to contact can be obtained as a function of the particle Reynolds number and the density ratio. The model predicts a critical Stokes number when the particle reaches the wall with zero velocity. The collision impulse was predicted using the corrected impact velocities. The predicted impulses appeared to agree well with the experimental measurements.
Acknowledgments The National Council for Science and Technology of Mexico (CONACYT) is acknowledged for partially supporting R. Zenit during his graduate sojourn at the California Institute of Technology. The help of M. Noble is acknowledged during the construction of the experimental setup.
References Barnocky, G., and Davis, R. H., 1988, ‘‘Elastohydrodynamic Collision and Rebound of Spheres: Experimental Verification,’’ Physics of Fluids, Vol. 31, No. 6, pp. 1324–1329. Campbell, C. S., 1997, ‘‘Computer Simulations of Powder Flows,’’ Powder Technology Handbook, K. Gotoh, H. Masuda and K. Higashitani, eds., Marcel Dekker, New York. Davis, R. H., Serayssol, J. M., and Hinch, E. J., 1986, ‘‘The Elastohydrodynamic Collision of Two Spheres,’’ Journal of Fluid Mechanics, Vol. 163, pp. 479–497. Gee, M. L., Mcguiggan, P. M., Israelachvili, J. N., and Homola, A. M., 1990, ‘‘Liquid to Solid-Like Transitions of Molecularly Thin-Films Under Shear,’’ Journal of Chemistry Physics, Vol. 93, pp. 1895–1906. Happel, J., and Brenner, H., 1965, Low Reynolds Number Hydrodynamics, Prentice-Hall, New York. Hocking, L. M., 1973, ‘‘The Effect of Slip on a Motion of a Sphere Close to a Wall and of Two Adjacent Spheres,’’ Journal of Engineering Mathematics, Vol. 7, pp. 207–221. Johnson, J. K., 1987, Contact Mechanics, Cambridge University Press, Cambridge, U.K. Landweber, L., and Shahshahan, A., 1992, ‘‘Added Masses and Forces on Two Bodies Approaching Central Impact in an Inviscid Fluid,’’ Journal of Ship Research, Vol. 36, 99–122. Lundberg, J., and Shen, H. H., 1992, ‘‘Collisional Restitution Dependence on Viscosity,’’ Journal of Engineering Mechanics, Vol. 118, 979–989. McLaughlin, M. H., 1968, ‘‘An Experimental Study of Particle-Wall Collision Relating of Flow of Solid Particles in a Fluid,’’ Engineer Degree Thesis, California Institute of Technology, Pasadena CA. Mei, R., 1994, ‘‘Flow Due to an Oscillating Sphere and an Expression for the Unsteady Drag on the Sphere at Finite Reynolds Number,’’ Journal of Fluid Mechanics, Vol. 270. Milne-Thompson, L. M., 1950, Theoretical Hydrodynamics, Macmillan, New York. Smart, J. R., and Leighton, D. T., 1989, ‘‘Measurements of the Hydrodynamic Surface Roughness of Non-Colloidal Spheres,’’ Physics of Fluids A, Vol. 1 (52). Sundararajakumar, R. R., and Koch, D. L., 1996, ‘‘Non-Continuum Lubrication Flows Between Particles Colliding in a Gas,’’ Journal of Fluid Mechanics, Vol. 313, 283–308. Zenit, R., 1997, ‘‘Collisional Mechanics in Liquid-Solid Flows,’’ Ph.D. thesis, California Institute of Technology, Pasadena CA. Zenit, R., and M. L. Hunt, 1998, ‘‘Restitution Coefficient Measurements for Immersed Collision of Particles,’’ in preparation.
184 / Vol. 121, MARCH 1999
/ 9914$$mr09
03-11-99 12:54:22
Transactions of the ASME
asmea
ASME: J Fluids