P2.26
MESOSCALE WAVES AND TURBULENCE IN THE PROXIMITY OF SYNOPTIC-SCALE FLOW FEATURES 1
1
2
Anthony R. Hansen* , Gregory D. Nastrom , Toshitaka Tsuda and Frank D. Eaton 1 St. Cloud State University, St. Cloud, Minnesota 2 Kyoto University, Kyoto, Japan 3 Air Force Research Laboratory, Kirtland AFB, New Mexico 1. INTRODUCTION The first measurements by instrumented aircraft of mesoscale turbulence near jet streams were reported by Briggs and Roach (1963). Subsequent studies by Shapiro (1976, 1978, 1980) and Kennedy and Shapiro (1975, 1980) indicated the now well-known propensity for turbulence to appear in regions of large vertical wind shear, and therefore low Richardson number, both above and below the region of maximum wind speed in upper tropospheric jets. However, the occurrence of turbulence in these regions could be characterized as intermittent in both space and time with considerable variation from case to case (Shapiro, 1976). In addition, other studies have suggested the vicinity of synoptic scale jets is also a potential source region for mesoscale gravity waves (e.g., Fritts and Nastrom, 1992). Wind profiler radar data have been used to investigate the climatological relationship between the occurrence of gravity waves and the background mean conditions (e.g., Murayama et al., 1993; Hansen et al., 2001). Wind profiler radars provide an excellent in situ observing platform from which to investigate the association of mesoscale waves and turbulence with synoptic scale features of the flow. Recently, Pepler et al. (1998) presented two case studies of turbulence estimated from anisotropy in the index of refraction and from corrected spectral widths associated with the passage of synoptic scale troughs and their associated jets over the MST radar at Aberystwyth, Wales. Their results are qualitatively consistent with the aircraft measurements of Shapiro and coworkers, but are difficult to quantify and are from a limited data sample. Pavelin and Whiteway (2002) used the same radar to study a case of gravity wave interactions above a tropospheric jet near the tropopause.
* Corresponding author address: Anthony R. Hansen, Dept. of Earth and Atmospheric Sciences, St. Cloud State University, St. Cloud, MN 56301-4498; e-mail:
[email protected].
3
In the present study, we use long term measurements from the MST radar at White Sands Missile Range, New Mexico (WSMR) and the Middle and Upper Atmosphere radar at Shigaraki, Japan (MU) to seek quantitative relationships between radar derived measures of mesoscale turbulence and gravity waves and synoptic-scale characteristics of the flow derived from reanalysis data. In particular, we seek statistical relationships between synoptic scale wind shear and vorticity and radar derived estimates of turbulence and gravity wave activity. In principle, regions of turbulence should coincide with regions where the flow has a low Richardson number (Shapiro, 1978). However, detecting these regions of low Ri is frequently quite difficult even with relatively high-resolution remote sensing equipment (e.g., Pepler et al., 1998) and certainly nearly impossible with conventional synoptic scale observations. Therefore, our approach was to examine characteristics of the synoptic scale flow as statistical predictors of mesoscale activity. 2. DATA Radar data used in the study include hourly means of return power calibrated as the refractivity 2 turbulence structure constant Cn and standard deviations of the vertical velocity (σw) from the WSMR radar from January 1991 through April 1996; and hourly mean uncalibrated return power and σw from the MU radar from the same six year time interval. We will focus on data from the time of year when mobile synoptic scale systems are more prevalent, namely October through April of each of the six years at each station. Characterization of the synoptic scale flow for the same periods was derived from the NCAR/NCEP Reanalysis dataset. Data for heights, temperatures, and winds on a 2.5 x 2.5 latitudelongitude grid at 6 hourly intervals for the mandatory levels from 700 mb through 100 mb were used. Finally, tropopause heights in the proximity of the radars were obtained from radiosonde ascents from the nearest stations, namely El Paso, TX for the WSMR radar and from Wajima and Shiono-misaki for the MU radar.
Wajima is north of MU while Shiono-misaki is to the south, so an interpolated value of the tropopause height for MU was obtained from these radiosonde stations. These radiosonde derived tropopause heights were also interpolated in time to give an estimate of the tropopause height for each hourly mean of the radar data. If soundings were missing, the radar data from the intervening time intervals were rejected. To compare the radar data to synoptic analyses, radar profiles within 3 hours of the 6 hourly reanalysis fields were compared to that synoptic analysis. The WSMR radar is a three beam VHF radar with a vertical beam and beams in the north-south and east-west planes at an angle of 15 from the vertical. The MU radar has five beams, one in the vertical and two each in the north-south and eastwest planes at an angle of 10 from the vertical. Three dimensional wind data, return power and spectral width data were available from both radars. These data were subjected to a rigorous quality controls to remove profiles with objectively identifiable errors (e.g., Hansen et al., 2001). The radar data were processed from the original roughly 3 minute interval data to construct hourly means of the return power and σw . A total of 8036 hourly mean profiles were used from the WSMR radar which operated in a more or less continuous mode during the 1991-1996 period with gaps of varying lengths. A total of 2831 hourly mean profiles were used from MU, which operated in a campaign mode, with data collected for roughly 4 days each calendar month during the period of study. Although the MU return power data is uncalibrated, the values were quite consistent from one observing period to the next except in a few exceptional cases, which were easily compensated for.
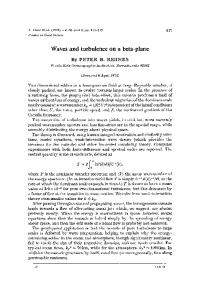
variables derived from the reanalysis data were computed for the exact geographic location of the radars. Finally, in an effort to reduce the noise level in the data, regressions were computed after binning the data within finite intervals of the synoptic variables used as predictors. In the next section, an example obtained from the individual hourly mean radar profiles is also presented. 4. RESULTS A sampling of the results obtained in the study are presented in this section, focusing on the relationship of the turbulence, indicated by the back scattered power, and the synoptic scale relative vorticity from both MU and WSMR. In general, the slope of the vorticity vs. return power regression was steeper in the upper troposphere compared to the lower stratosphere (Fig. 1). The uncalibrated return power from MU from all 6 winters of the present dataset at an altitude of 1.95 km below the tropopause as correlated with the relative vorticity at 200 mb is presented in Fig. 2. This is the altitude of the strongest relationship between the 200 mb relative vorticity and the return power anomaly, ∆log(Power). The result in Fig. 2 is generally representative of the other regressions obtained. These results indicate a very strong association between cyclonic vorticity and more intense turbulence, with weaker turbulence in anticyclonic conditions. At MU, this most likely indicates statistically more intense turbulence on the cyclonic side of the east Asian jet. Classical aircraft studies of turbulence in the proximity of
3. PROCEDURES Correlations between synoptic parameters and radar derived quantities were obtained by treating the radar data in tropopause relative co-ordinates. Tropopause relative co-ordinates were used to insure that any results obtained were not an artifact of fluctuations in the tropopause height. Radar data were in 150 m range gates in the vertical for both radars, and these altitudes were adjusted to be tropopause relative according to the tropopause heights derived from the radiosondes. In addition, return power and σw were calculated relative to the mean profile computed from the entire dataset for both radars. Thus, a 2 return power anomaly (∆log(Cn ) for WSMR and ∆log(Power) for MU) is presented. Synoptic
Fig. 1. Slope of the linear regression of the 200 mb relative vorticity over MU with ∆log(Power) as a function of tropopause relative altitude.
Fig. 2. Change in back scattered power from the mean (∆log(Power)) at 1.95 km below the tropopause at MU compared to the relative vorticity, ζ, at 200 mb. A regression line is shown with the correlation of the data to the regression, r, of 0.96. The error bars correspond to the standard error of the means averaged over each of 18 intervals on the ζ axis. jets are consistent with this picture (e.g., Shapiro, 1976). To get a sense of the variability of the individual hourly mean results, Fig. 3 illustrates a regression obtained from over 2800 hourly profiles of MU radar data with the 200mb relative vorticity. Again, a very clear relationship of higher turbulence (as indicated by higher back scattered power) in association with cyclonic relative vorticity and weaker turbulence in anticyclonic conditions is indicated. For comparison, a comparable result taken from WSMR is presented in Fig. 4. Similar to the MU data, the relationship between the return 2 power anomaly, ∆log(Cn ), and the upper tropospheric relative vorticity is stronger in the upper troposphere than in the lower stratosphere (not shown). Fig. 4 illustrates the comparison of 2 ∆log(Cn ) at an altitude of 1.2 km below the tropopause with the relative vorticity at 300 mb at WSMR. The relationship is strongest at this altitude with the synoptic scale relative vorticity at 300 mb. The slope of the corresponding regression curve using 200 mb vorticity is weaker at WSMR, but the relationship with the 300 mb or even 500 mb relative vorticity is stronger at WSMR relative to the 200 mb value than it is at MU. (Note that the vertical axes in Figs. 2 and 4 are not directly comparable since the WSMR backscatter 2 power is calibrated as Cn and the MU backscatter power is not.)
Fig. 3. As in Fig.2 except a point is plotted for each (∆log(Power), ζ) pair along with the corresponding regression line. The correlation of the hourly mean data to this regression is r = 0.50. Over 2800 points are plotted.
Fig. 4. As in Fig.2 except the change in calibrated back scattered power from the mean 2 (∆log(Cn )) at 1.2 km below the tropopause at WSMR compared to the relative vorticity, ζ, at 300 mb. A regression line is shown with the correlation of the data to the regression, r, of 0.96. In other results, a stronger correlation between the wind speed at the altitude of the tropospheric jet exists over MU than over WSMR (not shown). This may be understood in terms of the much faster wind speeds present generally at MU compared to WSMR, which give rise to larger vertical wind shears. Corresponding results obtained by comparing synoptic scale variables to the proxy for gravity waves, σw, are much less impressive. Although an association between mesoscale gravity waves and
the shear zones and resultant turbulence in the proximity of jets might be expected (e.g., Van Zandt et al., 1979; Fritts and Nastrom, 1992), the intermittency of their occurrence may be masked in the simple linear statistical relationships sought in the present study. More careful analysis of these results is currently in progress. The strongest result obtained was a strong correlation between the wind speed at 700 mb, near the altitude of the mountain tops in the sharp topographic ridges that exist west and east of the WSMR radar site. This is consistent with the existence of topographically generated gravity waves. Waves generated due to synoptic scale flow conditions were not readily apparent in the WSMR data. Computation of comparable results for MU are still in progress. 5. CONCLUSIONS Regression analyses of the occurrence of mesoscale turbulence in association with variability of the synoptic scale wind flow in the upper troposphere indicates a strong relationship between turbulence intensity as indicated by back scattered power and the upper tropospheric, synoptic scale relative vorticity at both MU and WSMR. Additional results at MU indicate a further correspondence between higher turbulence intensity and faster wind speeds. Overall, the results are consistent with and quantify the enhancement of mesoscale turbulence on the cyclonic side of upper tropospheric jet steams relative to the anticyclonic sides. Additional computations are presently in progress.
as observed by aircraft. Mon. Wea. Rev., 103, 650-654. Kennedy, P. J., and M. A. Shapiro, 1980: Further encounters with clear air turbulence in research aircraft. J. Atmos. Sci., 37, 986-993. Murayama, Y., T. Tsuda, and S. Fukao, 1994: Seasonal variation of gravity wave activity in the lower atmosphere observed with the MU radar. J. Geophys. Res., 99, 23057-23069. Pavelin, E. and J. A. Whiteway, 2002: Gravity wave interactions around a jet stream. Geophys. Res. Lett., 29, 20-24. Pepler, S. J., G. Vaughan and D. A. Hopper, 1998: Detection of turbulence around jet streams using VHF radar. Quart. J. Roy. Meteor. Soc., 124, 447-462. Shapiro, M. A., 1976: The role of turbulent heat flux in the generation of potential vorticity in the vicinity of upper level jet stream systems. Mon. Wea. Rev., 106, 1101-1111. Shapiro, M.A., 1978: Further evidence of mesoscale and turbulent structure of upper jet stream-frontal zone systems. Mon. Wea. Rev., 106, 1101-1111. Shapiro, M.A., 1980: Turbulent mixing within tropopause folds as a mechanism for the exchange of chemical constituents between the stratosphere and troposphere. J. Atmos. Sci., 37, 994-1004.
REFERENCES Briggs, J. and W. T. Roach, 1963: Aircraft observations near jet streams. Quart. J. Roy. Meteor. Soc., 89, 225-247. Fritts, D. C., and G. D. Nastrom, 1992, Sources of mesoscale variability of gravity waves: 2. Frontal, convective and jet stream excitation. J. Atmos. Sci., 49, 111-127. Hansen, A. R., G. D. Nastrom, and F. D. Eaton, 2001: Seasonal variation of gravity wave activity at 5-20 km observed with VHF radar at White Sands Missile Range, New Mexico. J. Geophys. Res., 106, 17171-17183. Kennedy, P. J., and M. A. Shapiro, 1975: The energy budget in a clear air turbulence zone
VanZandt, T. E., J. L. Green, and W. L. Clark, 1979: Buoyancy waves in the atmosphere: Doppler radar observations and a theoretical model. Geophys. Res. Lett., 6, 429-432.