CLIN. CHEM. 39/11, 2298-2304
(1993)
Method for Determining Reference Changes from Patients’ Serial Data: Example of Cardiac Enzymes Veil Kairisto,’#{176}3’5 Aija and Kerttu Idala3
Virtanen,3
Esa Uusipaikka,2
Liisa-Maria Voipio-Pulkki,4
Changes between serial laboratory test results can be significant, even if none of the indMdual results exceeds the reference interval. We developed a statistical method for the calculation of reference change limitsfrom routine patients’ data for situations in which the majority of the patients can be considered suitable reference subjects. The method was applied to cardiac enzyme data [creatine kinase (CK; EC 2.7.3.2), creatine kinase isoenzyme MB (CK-2), lactate dehydrogenase (LD; EC 1.1.1.28), and lactate dehydrogenase isoenzyme 1 (LD-1)] from 2029 consecutive patients. We used hospital discharge diagnoses to exclude patients with the diagnosis of myocardial infarction or myocarditis, but we also studied the characteristics of the method on unselected patients’ data. The reference change limits derived from the diagnosis-selected patient group were as follows (U/L, activity measurements in serum at 37 #{176}C according to Scandinavian recommendations): CK from -39 to 27, CK-2 from -8 to
7, LD from -86 to 85, and LD-1 from -19 to 15. Similar limits were obtained by conventional statistical methods from a group of 29 hospitalized patients with no myocardial symptoms. Our results suggest that it is possible to produce clinicallyapplicable reference change limitsfrom routine data. Indexing
Terms: creatine kinase . lactate dehydrogenase distribution frequencies . analytical variation
biological variation
Reference change values can be defined as the differences between two serial test results in reference individuals (1). Serial measurement of biochemical markers (CK; EC 2.7.3.2) isoenzyme MB means of detecting myocardial damage (2_4).8 The effects of analytical and biological variation on test results should be known for interpretation of serial laboratory data. The concept of reference change is useful for this purpose because all preanalytical and analytical sources of variation can be included in it. For example, for serial cardiac enzyme data, patients with changes greater than the reference change limit would remain suspect for myocardial infarction (MI), in addition to those with high absolute activities of such as creatine
kinase
(CK-2) is a sensitive
Departments of’ Clinical Chemistry and2 Statistics, University of Turku, and3 Central Laboratory and4 Department of Medicine, University Central Hospital of Turku, FIN-20520 Turku, Finland. for correspondence. Fax ut + 358-21-613920; E-mail
[email protected]. 6Nonstandard abbreviations: CK, creatune kinase; CK-2, creatine kunase isoenzyme MB; LD, lactate dehydrogenase; LD-1, lactate dehydrogenase iaoenzyme 1; and MI, myocardial infarction. Received November 4, 1992; accepted June 23, 1993. 2298
CUNICAL CHEMISTRY, Vol. 39, No. 11, 1993
Veikko
N#{228}nt#{246},”3 0th Peltola,3
cardiac enzymes. The assumption that the mean change in a non-MI patient would be zero may not be justified if the preanalytical factors are known not to remain stable for the patients under study. Harris and Brown first applied statistical methods for studying the relevance of within-subject variances to the interpretation of differences between successive measurements (5, 6). The term “reference change” was introduced by Harris and Yasaka (7). Later the theory of reference change values was suggested as being equivalent to the theory of reference values (8). However, the terminology concerning reference values for changes is not yet as uniform as the internationally accepted terminology of reference values. “Delta check values,” “critical differences,” “significant changes,” or “reference changes” are terms with similar meanings. We prefer the terminology analogous to that of reference values. Reference change values correspond to reference values, and the significant change for a defined proportion of reference subjects is called reference change limit (corresponding to reference limit). Health-related reference change limits should be calculated from populations that do not have the disease in question but that otherwise resemble the patients as much as possible. Reference change limits should be given in absolute units instead of percentages of steadystate concentrations for all clinical situations in which previous laboratory data of individual steady-state concentrations are not available. Such a practice is possible if the health-related within-subject variances do not depend on the concentrations of analytes. Reference change limits given in the same units as the laboratory result itself would, of course, be easier to use in clinical practice. The suggested methods for calculating the reference change limits from the observed variances often rely on the assumption that the reference individuals are in a steady state and no systematic changes are expected (1, 9). However, in many clinical situations this assumption is not justified. Boyd and Harris (10) have shown that several routinely used laboratory analytes have significant within-subject day-to-day correlations among hospital inpatients. They also showed that these serial correlations as well as within-subject variances had some variability between different nursing units. Their findings suggest that no one set of reference change values can be applied validly across all populations of patients (10). The interpretation of serial laboratory results from emergency admission patients deserves special attention. The preanalytical factors for the first sample,
which is usually taken in the emergency room, cannot be standardized because the patient may have eaten or have been physically active beforehand. However, the second sample is usually taken after some hours of bed rest and fasting. These differences in preanalytical factors are known to affect the activities of lactate dehydrogenase (LD; EC 1.1.1.28) (11) and CK (12). In healthy subjects, the activity of LD or CK in the second sample should be less than in the first sample. To deal with some of these concerns, we developed a statistical method for the calculation of reference change limits from patients’ data. Many of the patients for whom cardiac enzymes were requested did not develop MI. Only about a quarter of all patients admitted with an initial suspicion of MI will eventually get that diagnosis (13-16). We applied the method to data from selected patients for whom discharge diagnosis of Ml or myocarditis had been excluded, even though the patients’ databases may not be reliable enough for the selection of reference subjects according to diagnoses (17-19). Our aim was to develop a statistical method that would tolerate some inadequacies or errors in source data, because such inadequacies are frequently encountered with patients’ databases. The prerequisite for our statistical method was only that a clear majority of subjects represent non-MI patients. The characteristics of our method were also studied on unselected patients’ data, because even in such cases non-MI patients form the majority. To check the validity of the approach, we determined myocardial enzymes from serial blood samples that were collected from a group of 29 patients who had no cardiac symptoms but were hospitalized for other reasons under similar circumstances. Clinical utility of the derived reference change limits in comparison with reference limits was evaluated in the retrospective database that included clinical discharge diagnoses. MaterIals and Methods Subjects The control group, with no cardiac symptoms, consisted of 29 nonemergency patients who had been hospitalized for endocrinological investigations or adjustment of insulin therapy. The patients were 15 men, ages 36-77 years (mean 58 years), and 14 women, ages 18-73 years (mean 51 years). The cardiac enzymes ECK, CK-2, LD, and LD isoenzyme 1 (LD-1)] were measured three times from serial samples collected at the same time as routine blood samples. Informed consent was obtained from the patients in accordance with the Helsinki Declaration of 1975, as revised in 1983. The first sample was taken in the afternoon upon admission with no preanalytical standardization; the next two samples were taken on two following mornings after an overnight fast. Serial cardiac enzyme data were available from a total of 2029 consecutive patients who had been hospitalized at the University Hospital of Turku during 1990 and 1991 with an initial suspicion of Ml. The patients
were 1192 men, ages 18-92 years (mean 63 years), and 837 women, ages 26-98 years (mean 71 years). The first
enzyme specimen for the measurements of CK, LD, and, when considered necessary, CK-2 and LD-1 was collected at admission to hospital and the second specimen -8-18 h later, either at 1800 or at 0700. This protocol was followed when the enzyme results were expected to have no immediate effect on treatment of the patient. When requested by the attending physician, the CK and CK-2 specimens were collected at shorter time intervals. Despite this, the mean time intervals between the first and the second specimen were quite long, for example, for CK-2, 14.4 ± 7.0 (mean ± SD) h, showing that the main clinical use of enzyme tests was retrospective exclusion or evaluation of myocardial damage. Review of the discharge diagnoses database showed that 616 (30%) of the patients eventually received a diagnosis of MI. After exclusion of these patients and 31 patients with myocarditis, 1382 patients remained in the diagnosis-selected group. Of the remaining patients, 776 were men, ages 22-92 years (mean 63 years), and 606 were women, ages 29-98 years (mean 70 years). Analytical
Methods
CK assay. Total CK activity was determined in a Hitachi 704 or 717 analyzer (Boebringer Mannheim, Inc., Mannheim, Germany) by using the Scandinavianrecommended assay (20) with reagents supplied by Merck (Diagnostica Merck,, Inc., Darmstadt, Germany). The between-run CV was 3.4% at 144 U/L. CK-2 assay. CK isoenzyme B activity was determined by immunoinhibition of the CK subunit M activity and subsequent measurement of CK activity in a Hitachi 704 or 717 analyzer with reagents supplied by Merck. The results were doubled to estimate the CK-2 activity. The between-run CV was 23.4% at 9.0 U/L. Electrophoretic separation of CK isoenzymes was performed if macromolecular CK forms were clinically suspected and always if CK-2 activity was >20% of total CK activity. Electrophoresis was done in a Corning 720 electrophoretic device with gel supplied by Corning (Specialgele; Ciba Corning Diagnostics Ltd., Haistead, Essex, UK). LD assay. We determined total LD activity in a Hitachi 704 or 717 analyzer, using the Scandinavian-recommended assay (21) and reagents made in the laboratory. The between-run CV was 2.2% at 460 UIL. LD-1 assay. LD-1 activity was determined by immu-
noprecipitation of other LI) isoenzymes and subsequent measurement of the remaining LD activity in a Hitachi 704 or 717 analyzer with the precipitating antibody supplied by Roche (Isomune-LD#{174};Roche Diagnostic Systems, Nutley, NJ) and other LD reagents made in the laboratory. The between-run CV was 5.2% at 103 UIL. The protocol to ensure comparable enzyme activity measurements on both Hitachi analyzers involved identical calibrators and reagents, identical measurement conditions, and identical internal quality-control samples at two or three levels. The reference intervals in use in our laboratory are based on results from 126 healthy men and 144 healthy women, ages 27-67. The upper CUNICAL CHEMISTRY, Vol. 39, No. 11, 1993
2299
97.5% reference limits for myocardial enzymes are as follows: CK women, 165 U/L; CK men, 285 U/L; CK-2, 20 U/L; U), 450 UIL; and LD-1, 115 UIL.
were used for the data analysis. A Lotus 1-2-3 macro subroutine that performed the calculations described in the Appendix was written by and is available from the first author.
Statisilcal Methods In the control group, the effects of gender on analyte activities were studied by testing the equality of means by Student’s t-test. Homogeneity of within-subject variances in subgroups were tested by calculating the index of heterogeneity as recommended by Fraser and Harris (22). The index of heterogeneity is the ratio of the observed CV of a set of individual variances to the theoretical CV, which is [2/(n - 1)], where n is the mean number of specimens collected per subject (22). The reference change values for different enzymes were formed by subtracting the first result from the second result. The 2 SD limits of the distributions of changes of consecutive results were taken as the reference change limits as described elsewhere (9). Calculation of the reference change limits from the actual patients’ data was similar, except that the distributions of the changes were “mixed,” containing -2040% of data from patients with MI in the unselected group and probably some misclassified results, even in the diagnosis-selected group. However, because observed change in serial cardiac enzyme data is a most sensitive indicator of MI, the central part around the mode of the distribution of changes was expected to consist mostly of non-MI patients. For the non-MI patients, the variation in serial results was due to changes in preanalytical factors and random biological and analytical variation. Consequently, the distribution of the changes of the major non-MI subpopulation of patients was expected to approach a gaussian distribution. The following statistical procedures were necessary for the resolution of the mixed distribution of changes: (a) estimation of the optimal window widths; (b) precise estimation of the mode of the mixed distribution; and (c) use of frequencies of the mode class and adjacent classes for the estimation of the underlying gaussian distribution of changes of the major subpopulation of unaffected patients. Detailed description of the statistical procedures can be found in the Appendix. The means and variances of the mathematically derived distributions of changes were compared with the corresponding values in the control group by Student’s t-tests and F-tests. To facilitate comparison with previously published data, we also calculated estimates for within-subject biological variation. Analytical variation was estimated from quality-control results by using samples with activities near the upper reference limits, as described in Analytical Methods. Variances were calculated at the activity concentrations of the quality-control samples. The between-run analytical variance was subtracted from the total within-subject variance as described elsewhere (23) to get an estimate for within-subject biological variance. The Statistical Analysis System#{174} (SAS Institute, Inc., Cary, NC) and Lotus 1-2-3#{174} (Lotus Development Corp., Cambridge, MA) software packages on microcomputer 2300
CUNICAL CHEMISTRY, Vol. 39, No. 11, 1993
Results
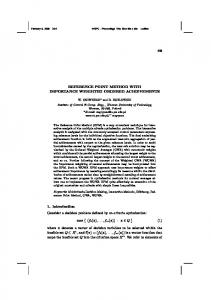
The t-test of means in the control group of 29 patients did not show any significant effects of gender on CK-2, U), or LD-1. For CK the association of male gender with higher levels of CK activity seemed possible but not statistically significant (P = 0.08). Consequently, gender subgrouping was not considered necessary. To study variation of within-subject variances, we calculated the indices of heterogeneity for each analyte. Because the within-subject variances were determined from three measurements, the highest value for the index of heterogeneity that would still be in concordance with the hypothesis of no heterogeneity of within-subject variances at 5% probability level would be 1.82 (22). The indices calculated for the control group were CK 1.44, CK-2 1.38, LD 1.12, and LD-1 0.91. These results suggest that the within-subject variances of patients with no myocardial damage would be homogeneous and that the reference change limits could be calculated simply from the distribution of changes. Table 1 shows results of the first measurement, the changes between two consecutive measurements, and the derived reference change limits. The distribution of changes between two consecutive measurements for CK-2 is shown in Figure 1C. In the diagnosis-selected and unselected patient groups, the within-subject variances were clearly heterogeneous, with indices of heterogeneity >3 for all analytes. The distributions of changes between two consecutive measurements were 5imilnr. In the diagnosis-selected patient group the distributions had short tails and the overall fit to gaiissic.n distributions was quite good. In the unselected patient group the distributions had a central gaussian part and long, low-frequency nongaussian tails. Distributions of changes are shown in Figure lB and A for CK-2 of diagnosis-selected and unselected patients, respectively. The means and variances of the distributions of changes produced by our statistical method were compared with the corresponding values of the distributions of changes of the control group by t-tests and F-tests. For the diagnosis-selected patients no significant differences were found. For the unselected patients the only significant difference was a low P value (0.03) in the F-test for variances in the LD-1 distributions of changes. After applying Bonferroni correction for multiple comparisons, even this difference in variances was not significant. The absolute values of negative and positive reference change limits were not equal because the mean change was usually not zero. Within-subject CVs are shown in Table 2, together with a review of previously published data. Clinical sensitivity of the proposed reference change limits derived from selected patients’ data was evaluated in the retrospective database with reference to cmical discharge diagnoses. Of the total of 576 patients
Table 1. Data From Two Consecutive Cardiac Enzyme Measurements In Serum Distribution of changes, U/I
n
Mean fIrst result, U/L
Mean
SO
CK CK-2
29
89.0
-9.8
23
11.0
LD
29 29
344.0 74.7
0.1 -7.5
16.3 4.0 49.5
Reference change limits, U/I
Controls
ID-i
-42-22
-8-8 -107-91
7.8
-3.8
-19-12
Original distribution of changes, M.en
Selected patients (no patients with discharge diagnosis 1382 220.8 52.0
CK CK-2
479 1302
ID L.D-i
472 Unselected patients CK 2029 CK-2 842
SD of MI or myocardltls)
U/L
Mode
Mathematically derived SD, U/I
852.8
-6.0
17.1
20.5 489.7 98.2
-0.1 -8.2
35.1 239.4
-0.7
3.6
-0.5
42.7
8.3
67.0
-2.0
8.6
-19-15
306.1
207.4
947.4
-5.1
16.6
-38-27
36.2
17.0
75.2
-1.2 -16.4
4.3 52.3
-10-7 -121-88
11.0
-22-22
559.1 123.6 762.3 ID-i 746 133.5 100.3 270.5 -0.1 Given reference change limitsare the ±2 SD limitsof either the original distribution of changes changes (patientsdata). LD
1921
(control
subjects)
or
-39-27 -8-7 -86-85
the mathematically derived distribution of
with a diagnosis of MI, 559 (97.0%) had at least one change outside the proposed reference change limits.
For comparison, 564 (97.9%) of the patients with a diagnosis of MI had at least one cardiac enzyme result above upper reference limits. DiscussIon
ilL
80
B
80 40 20 10
I
-40
IL -20
0
20
40
20
40
80
C
5 4
3
-8
2 1 40
lu
#{149}20 0
8
ii
00
Fig. 1. CK-2dlsttlbutlone of differences ( U/I) betweentwo subsequent results of enzyme determinations (A) of unselected patients; (B) of diagnosis-selected patients (exclusIon of patients with discharge diagnosis of MIor myocarditls); and (C) of the control patients (no myocardlalsymptoms) Original data are shown as bare and mathematically produced distributions as lines. Calculated reference change limits are shown as ve,lIcal lines
As noted by Fraser and Harris, the simple use of the distribution of changes for the calculation of reference change limits is justified when the within-subject variances are not heterogeneous (22). By using their proposed index of heterogeneity, we could show that the within-subject variances of the control subjects in our study were homogeneous. In the unselected patient data, in which part of the patients had MI, the withinsubject variances were heterogeneous. The within-subject variances were clearly heterogeneous even in the diagnosis-selected group. This may be due to the release of small amounts of enzymes from slightly damaged myocardial tissue in a proportion of the diagnosis-selected non-MI patients, especially in those with unstable angina. The presence of microinfarcts in some angina patients has been verified by new sensitive methods for CK-2 mass concentration and troponin-T (24, 25). Another explanation for the heterogeneity could be the previously noted difficulties in using discharge diagnoses for the selection of reference subjects (17-19). In our statistical method the main assumption was that the within-subject variances would be homogeneous in the major subpopulation of patients with no myocardial Ian1age. In such a subpopu]ation the distribution of changes would be symmetric and approach a gaussian distribution, thereby facilitating the use of the mathematical method to extract this distribution from the total distribution of changes. CUNICAL CHEMISTRY, Vol. 39, No. ii, 1993
2301
Table 2. WIthin-Subject
CV5 of CK, CK-2, LD, and LD-1 Activities In Serum CV,%
n
Other studies Ricosetai (26)
Costongs et al. (23) Costongs
of al. (23)
Moses and Henderson (27) Moses and Henderson (27) HoIzel (28)
Nicholson at al. (12) Fraser and WIlliams (29) Williams of al. (30) Stalland at al. (31)
Diagnoels
Timespen
10 62 274 24 24
10
CK
12.9
Healthy Healthy
6 weeks 10 months
Healthy
8.8
2.3
Healthy
7.9
2.2
4 weeks
Chronic liver disease
31.7
Healthy
8.3
13.5
5.0
22.8
31.2
10.3
7.1
Healthy
19.0
Chronic renal failure
433
Healthy
60.3
14
Healthy
25.7
29
2days
Endocrinological
1105
ID-i
day 6 months 1
days 1-3 months 6 days
9
LD
5 days
1-2 months
37
CK-2
2
11.3
5.5
This study
Controls gaussian subdlstributlon of changes of Diagnosis-selected patients (Ml Mathematically
Illness
10.7
37.8
10.5
5.5
extracted
1382
1-2
days
Symptoms suggesting
Ml
11.4
32.4
9.0
6.5
2029
1-2
days
Symptoms suggesting
Ml
11.0
41.7
11.2
9.3
and myocardltis patients excluded)
Unselected patients
As shown in Table 1, the calculated reference change limits from different sources of data were quite 5imilRr. Similnr results both from the unselected and diagnosisselected groups show that sickness-related change values do not much disturb the performance of the method as long as the health-related change values form the majority. The largest difference found was between control patients and unselected patients for the positive reference change limits of LD-1. Large numbers of sickness-related change values that overlap health-related change values in the group of unselected patients could affect the estimate for standard deviation of the underlying distribution and hence the estimates of reference change limits. Therefore, all available information should be used to ascertain that the proportion of sickness-related change values is as minims%1as possible before applying the statistical method. Harris and Yasaka (7) defined reference change as “that difference between two consecutive test results in an individual that is statistically significant in a given proportion of all similar persons.” To deal with the variation in within-subject variances, Harris and Yasaka used an autoregressive time-series model. They calculated the reference change limits representing that difference between two consecutive measurements that was expected by chance no more than 5% of the time in 88% of the healthy subjects. Their approach should be used if heterogeneity in within-subject variances is observed.
Several
have published estimates for variation of cardiac enzymes. we could have calculated the reference change limits by using these data and the available data of analytical imprecision in our laboratory. However, as shown in Table 2, there is considerable variation between different published data. This variation may reflect the difficulty in separating true biological variation within-subject Theoretically,
investigators biological
2302 CUNICAL CHEMISTRY, Vol. 39, No. 11, 1993
from all other preanalytical sources of variation. Without any further investigations it would be difficult to decide which of the published data would apply to our patients and our preanalytical standards. Therefore, methods involving routine patients’ data could be of significant help for computerized laboratories in the production of clinically applicable reference change limits. The clinical importance of the evaluation of changes between consecutive cardiac enzyme results has been pointed out in previous studies (4, 32). Biodeau et al. (33) described a case history of a patient whose MI was diagnosed by observing the changes in serial cardiac enzyme results, although the activities never exceeded the upper reference limits. We evaluated the clinical utility of the reference change limits in our retrospective database of 2029 patients. The clinical sensitivity of a diagnostic rule “at least one change outside reference change limits” was at the same level as that of a diagnostic rule “at least one enzyme activity result above reference interval,” 97.0% vs 97.9%. The value of this retrospective evaluation was reduced by the fact that the enzyme results had been available for the clinicians when they had given the diagnoses. Ordinary reference limits were available as well, but the reference change limits were not. Unbiased estimation of clinical sensitivities and specificities of reference change limits would require prospective studies and a classification of patients that does not rely on enzyme results. The lack of any statistically significant differences between the distributions of changes of control subjects and the mathematically produced distributions from actual patients’ data suggests that it is possible to produce clinically applicable reference change limits from patients’ data. The method presented could also be applied to other analytes that are used for monitoring patients, provided that only a minority of the patients actually develop the disease and that the within-subject van-
ances are homogeneous in those patients who remain well. A major advantage of the method is that the preanalytical and analytical factors are identical in comparison with the actual clinical situation. For improved utilization of clinical laboratory data, laboratories should be able to provide reference change limits in the same way as ordinary reference limits. This study was supported by grants from the Research and Science Foundation of Farmos, Turku, Finland, and Turku City, Finland. Portions of this work were presented in abstract form at the 9th hit Conf on Computing in Clinical Laboratories, Dublin, Ireland, October 8-9, 1992. AppendIx
Changes between lated by subtracting
consecutive enzyme results were calcuthe first result from the second result.
Estimation of Optimal Window Widths Frequency grouping of the change value data by using optimal window widths was necessary for the precise estimation of the modal change. We calculated optimal window widths with the formula (34) W
=
0.9 . A .
-
where W = optimal window width, A = min(s, RI1.34), 8 is the estimate of standard deviation, and n is the number of patients. R = Q1, where 3 is the limit between the
third and fourth quartile and 1 is the limit between the first and second quartile. These values were calculated after exclusion of outlying results. We used a simple rule to iteratively exclude all results that lay outside the ±4 SD limits of the mean (35). After each pass the new mean and new ±4 SD limits were recalculated and the process was repeated as many times as was necessary to end up in a situation that all results were inside the ±4 SD limits. The calculated window width was rounded to the next upper multiple of the original class width to facilitate frequency grouping of the data. Estimation of the Mode
Information classes
was used
Mode where L class, b occupied adjacent
of the mode class and the two adjacent according to the following formula (35)
=
L+b[(fufu_i)/(2fufu...ifu+i)]
lower class limit of the most heavily occupied class width, f = frequency of the most heavily class, and lu-i and f+1 = frequencies of the classes
= =
Estimating the Underlying Gaussian Distribution by Using Frequencies of the Mode Class and Adjacent Classes Rm is the relative frequency of the mode in a gaussian distribution; an approximate value is 0.398942. Relative frequencies of other classes (R1) were calculated with the formula R
=
(FdFmocje)Rrnoe
where F is the absolute frequency of a frequency class i and is the absolute frequency of the mode class. To facil-
Fme
itate linear regression analysis, R. was placed in the solved formula of a gaussian distribution
y’4 =
\/2.
Iln[1/\/
.
RjI
The y’ values were plotted in ax4 y’4 plot, in which the original frequency class center values of x4 had remained. When R4 = Rm, Y’i = Y’mo#{228}e = 0. Other points lie relatively linearly (for gaussian distributions, exactly linearly). All points with y’4 >1.96 were then removed; i.e., all frequency classes that have R,