METHODS DEVELOPMENT AND USE OF MACROINVERTEBRATES
AS INDICATORS OF ECOLOGICAL CONDITIONS FOR STREAMS IN
THE MID-ATLANTIC HIGHLANDS REGION
DONALD J. KLEMM1∗, KAREN A. BLOCKSOM1 , WILLIAM T. THOENY2 ,
FLORENCE A. FULK1 , ALAN T. HERLIHY3 , PHILIP R. KAUFMANN4 and
SUSAN M. CORMIER1
1 U.S. Environmental Protection Agency, National Exposure Research Laboratory (NERL),
Cincinnati, Ohio, U.S.A.; 2 SoBran, Inc., c/o U.S. EPA, NERL, Cincinnati, Ohio, U.S.A.; 3 Oregon
State University, c/o U.S. EPA, National Health and Environmental Effects Research Laboratory
(NHEERL), Corvallis, Oregon, U.S.A.; 4 U.S. EPA, NHEERL, Corvallis, Oregon, U.S.A.
(∗ author for correspondence, e-mail:
[email protected])
(Received 20 March 2001; accepted 2 October 2001)
Abstract. The Mid-Atlantic Highlands Assessment (MAHA) included the sampling of macroinver tebrates from 424 wadeable stream sites to determine status and trends, biological conditions, and water quality in first through third order streams in the Mid-Atlantic Highlands Region (MAHR) of the United States in 1993–1995. We identified reference and impaired sites using water chemistry and habitat criteria and evaluated a set of candidate macroinvertebrate metrics using a stepwise process. This process examined several metric characteristics, including ability of metrics to discriminate reference and impaired sites, relative scope of impairment, correlations with chemical and habitat indicators of stream disturbance, redundancy with other metrics, and within-year variability. Metrics that performed well were compared with metrics currently being used by three states in the region: Pennsylvania, Virginia, and West Virginia. Some of the metrics used by these states did not perform well when evaluated using regional data, while other metrics used by all three states in some form, specifically number of taxa, number of EPT taxa, and Hilsenhoff Biotic Index, performed well overall. Reasons for discrepancies between state and regional evaluations of metrics are explored. We also provide a set of metrics that, when used in combination, may provide a useful assessment of stream conditions in the MAHR. Keywords: benthic macroinvertebrates, bioassessment, biological monitoring, EMAP, methods development, metrics, Mid-Atlantic Highlands Region, multimetrics, PCA, stream condition
1. Introduction Using benthic macroinvertebrate community metrics and/or a multimetric method for evaluating biological impairment in streams has become a familiar research practice (Resh and Jackson, 1993; Lenat, 1993; Barbour et al., 1995, 1996b; Ger ritsen, 1995; Fore et al., 1996; Wallace et al., 1996; Carlisle and Clements, 1999). A multimetric method was first used to assess biotic integrity of fish communities in Illinois streams (Karr, 1981; Karr et al., 1986), and later for fish and macroin vertebrate communities by the Ohio Environmental Protection Agency (Ohio EPA) Environmental Monitoring and Assessment 78: 169–212, 2002.
© 2002 Kluwer Academic Publishers. Printed in the Netherlands.
170
D. J. KLEMM ET AL.
(Ohio EPA, 1988a–c; DeShon, 1995; Yoder and Rankin, 1995), and by the USEPA (Plafkin et al., 1989). The strength of using metrics or a multimetric approach is the ability to integrate data on community structure, to evaluate biological condi tions, and to make scientific conclusions with reference to biogeography and water quality (Karr et al., 1986; Plafkin et al., 1989; Karr, 1991; Karr and Kerans, 1992). Ideally, macroinvertebrate metrics should be used that assess biological condition based on measures of taxa richness, composition, pollution tolerance, and trophic structure (Karr and Kerans, 1992; Resh and Jackson, 1993; Carlisle and Clem ents, 1999; Karr and Chu, 1999). Individual metrics should respond to specific in-stream stressors and to general, cumulative perturbations (Karr, 1993; Karr and Chu, 1999), but they also should not be too variable to be useful. Suter (1993) and Polls (1994) cautioned against the loss of biological information when using metrics in a multimetric method without first statistically evaluating, calibrating, and rigorously testing them. Some U.S. states use multimetric methods for bioassessment, but other states have not been able to evaluate or standardize their sampling and processing meth ods because of lack of monetary and/or personnel resources or breadth of taxo nomic expertise. Other problems include the difficulty in characterizing the ref erence conditions against which the impaired sites are compared (Hughes, 1995; Reynoldson et al., 1997). Finally, identification of organisms to the lowest pos sible taxon can be a critical issue, even though genus and/or species level data can provide more ecological information (e.g., more precise pollution tolerance values (Appendix) and functional feeding groups) and taxonomic resolution. This more precise data can help to distinguish more subtle differences in biological conditions and can add strength to biocriteria development (Resh and Unzicker, 1975; Resh and McElravy, 1993; Davis and Simon, 1995; Karr and Chu, 1999; Waite et al., 2000). Many studies have shown that benthic macroinvertebrates are important bio logical indicators of water quality. They inhabit the sediment or live on the bot tom substrates of lakes, streams, and rivers and reflect the biological integrity of the aquatic ecosystem (Klemm et al., 1990; Rosenberg and Resh, 1993; Davies and Simon, 1995). Many macroinvertebrates have relatively long life cycles of a year or more, are especially important biological indicators of site conditions over time, and respond rapidly and predictably to changes in water quality and habitat changes. Additionally, some groups are tolerant and are found in polluted environ ments, while other groups are intolerant and respond to either specific stressors or a wide array of stressor and anthropogenic disturbances (Klemm et al., 1990; Rosen berg and Resh, 1993; Davis and Simon, 1995; Meyer, 1997; Karr and Chu, 1999). In addition, standardized sampling and processing methods for macroinvertebrates are well-developed and taxonomic keys are available to identify most specimens to genus and/or species. In this article, we statistically evaluated 45 macroinvertebrate metrics that meas ure a variety of ecosystem characteristics, many of which have been traditionally
EVALUATION OF BENTHIC MACROINVERTEBRATE METRICS
171
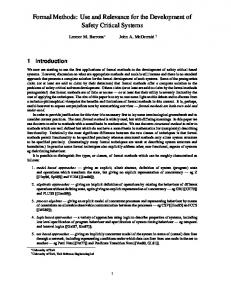
Figure 1. Sites sampled for the Mid-Atlantic Highlands Assessment (MAHA). Site designations of ‘Reference’ and ‘Impaired’ indicate that sites met the reference and impairment criteria, respectively (Table I). A designation of ‘Other’ indicates that the site met neither the reference nor the impairment criteria.
studied at the state or watershed scale (Plafkin et al., 1989; Green, 1990; Bar bour et al., 1992, 1996a, b; DeShon, 1995). The metrics were evaluated for use in region-scale assessment of wadeable streams as part of the U.S. Environmental Protection Agency, Environmental Monitoring and Assessment Program-Surface Waters (EMAP-SW). Evaluation of metrics was based on the ability of individual metrics to discriminate condition and respond to stressors, as well as the con sistency of metrics over multiple visits. The metrics that performed well at the regional scale were then compared to metrics currently used in the region at the state level. An additional objective of the assessment and evaluation was to de termine which metrics, individually or as a group, explain the greatest amount of variability among sites in the region.
172
D. J. KLEMM ET AL.
TABLE I Criteria developed to identify reference and impaired sites within the MAHR using water chemistry and habitat information (Waite et al., 2000) Variable
Reference criteria
Impairment criteria
Acid neutralizing capacity (µeq L−1 ) Chloride (µ eq L−1 ) Sulfate (µeq L−1 ) Total phosphorus (µg L−1 ) Total nitrogen (µg L−1 ) Mean RBP habitat score pH Total number of individuals counted
>50 1000 >100 >5000 4 No. Ephemeroptera taxa No. Plecoptera taxa No. Trichoptera taxa No. Megaloptera taxa Number Chironomidae (midge) taxa No. of taxa with PTV < 4 � i pi ti , where pi is the proportion of individuals in taxon i and ti is the PTV for taxon i, PTVs for general pollution Percentage of taxa with PTV < 4 Percentage of taxa with PTV > 6 Percentage of taxa with PTV ≥ 4 and ≤ 6 Percentage of individuals in the single dominant taxon Percentage of individuals in 2 dominant taxa Percentage of individuals in 5 dominant taxa (Total no. of individuals)/(Total no. of taxa) Percentage of individuals not insects Percentage of individuals in Oligochaeta and Hirudinea Percentage of taxa which are EPT taxa Percentage of taxa which are in Ephemeroptera Percentage of taxa which are in Plecoptera Percentage of taxa which are in Trichoptera Percentage of total individuals in Ephemeroptera Percentage of total individuals in EPT taxa Percentage of total individuals in Ephemeroptera, excluding taxa with PTV > 4 Percentage of total individuals in Plecoptera Percentage of total individuals in Trichoptera Percentage of taxa which are in Chironomidae Percentage of total individuals in Chironomidae Percentage of taxa which are in Megaloptera Percentage of total individuals in Megaloptera
Decrease Increase
2 2
Decrease Decrease
2 3
Decrease Decrease Decrease Decrease Increase Increase Decrease Increase
3 3 3 2 0 0 3 2
Decrease Increase Increase Increase
3 3 2 2
Increase Increase Increase Increase Increase
2 2 0 2 1
Decrease Decrease Decrease Decrease Decrease Decrease Decrease
3 3 2 2 2 3 3
Decrease Decrease Increase Increase Increase Increase
2 1 2 1 0 0
Shannon Diversity Index No. EPT taxa Modified number EPT taxa No. Ephemeroptera taxa No. Plecoptera taxa No. Trichoptera taxa No. Megaloptera taxa No. Chironomid taxa No. intolerant taxa HBI
% Intolerant taxa % Tolerant taxa % Facultative taxa % Indiv. in dominant taxon % Indiv. 2 dominant taxa % Indiv. 5 dominant taxa No. individuals per taxon % Non-insects % Oligochaetes and Leeches % EPT taxa % Ephemeroptera taxa % Plecoptera taxa % Trichoptera taxa % Ephemeroptera individuals % EPT individuals Modified % Ephemeroptera individuals % Plecoptera individuals % Trichoptera individuals % Chironomid taxa % Chironomid individuals % Megaloptera taxa % Megaloptera individuals
178
D. J. KLEMM ET AL.
TABLE III (continued) Metric
Definition
Response to stress
Discrim. power
EPT/Chironomidae ratio
Ratio of EPT individuals to Chironomidae individuals Percentage of individuals in collector-filterer taxa Percentage of individuals in collector-gatherer taxa Percentage of individuals in mixed function taxa Percentage of individuals in omnivorous taxa Percentage of individuals in parasitic taxa Percentage of individuals in herbivorous piercer taxa Percentage of individuals in predaceous taxa Percentage of individuals in shredder taxa Percentage of individuals in scraper taxa Ratio of individuals in scraper and collector-filterer taxa
Decrease
2
Decrease Decrease Decrease Increase Variable Variable
0 1 0 0 0 0
Variable Decrease Decrease Decrease
0 0 1 1
% Collector-filterer indiv. % Collector-gatherer indiv. % Mixed function indiv. % Omnivore indiv. % Parasitic indiv. % Herbivorous piercer indiv. % Predator indiv. % Shredder indiv. % Scraper indiv. Scrapers/Coll.-filterers
ships. Due to the large number of correlations run, an individual correlation was considered significant only if the p-value was ≤0.0001. We retained only metrics with at least one significant correlation for further evaluation. It was also at this stage that we eliminated metrics with conflicting responses in the correlations with stressors and the box plots. 2.5.4. Repeatability Repeatability of individual metrics within a year was determined from those sites with two visits within a given year between 1993 and 1995. There were 35 pairs of within-year visits. As these plots represented less than 10% of sites, we used this step only as a coarse screen for metrics. For each remaining metric, we plot ted the mean value for a site in a particular year against individual visit values. A plot with a strong linear trend around the diagonal (45-degree line) indicates that within-year visits show similar metric values and the mean metric value for a site is unrelated to the amount of within-year variability (i.e., larger mean values do not show higher variability). We examined the plots and excluded those with cone-shaped relationships or a high degree of variability around the diagonal (45 degree line) because those metrics had an undesirable relationship between mean and variability or excessively high within-year variability, respectively.
EVALUATION OF BENTHIC MACROINVERTEBRATE METRICS
179
2.6. OTHER CONSIDERATIONS 2.6.1. Redundancy of Metrics The redundancy among metrics used for biological assessment is an important characteristic to evaluate. Using two or more metrics which have a strong linear relationship to one another as indicators results in no new information being con tributed to an assessment (USEPA, 1998b). We used Pearson pairwise correlations and bivariate scatter plots to identify redundant pairs or groups among the remain ing metrics. Among pairs with high correlations (r > 0.70), we examined scatter plots to determine the nature of the relationship. If the relationship between metrics was curved, cone-shaped, or had a wide spread in some ranges, we concluded that the metrics were not redundant (USEPA, 1998b). Only tight relationships where both metrics fell close to a straight line were considered redundant. For the purposes of later analysis of metrics, a single metric was selected from each group based on correlations with environmental variables, discriminatory power, and correlations with other metrics. 2.6.2. Relationships to Watershed Size Some macroinvertebrate metrics are expected to vary naturally with stream size in the watershed according to the river continuum concept (Vannote et al., 1980). Thus, we plotted reference sites for each selected metric against the natural log arithm of the watershed drainage area to identify metrics related to watershed area. We looked for general trends with watershed area, as well as trends along the maximum or minimum of the metric distribution. 2.7. M ULTIVARIATE ANALYSES A Principal Components Analysis (PCA) of the metric data allowed us to determine which metrics contributed the most to explaining variability in the macroinverteb rate community data. In addition, PCA indicates how well the candidate metrics, in combination, can distinguish a stressor gradient (reference vs. impaired sites). PCA is based on the assumption of multivariate normality among the distributions (Johnson and Wichern, 1992). Therefore, we tested each candidate metric for uni variate normality and used a series of Box-Cox power transformations to identify an optimal transformation for metrics which were not normally distributed (Box and Cox, 1964; Neter et al., 1996). We ran two PCAs, one based on the full set of candidate metrics and one based on the subset of those metrics remaining following the entire evaluation process. For the second PCA, we included only a single metric from each group of redund ant metrics in the analysis. Data from all three types of sites (reference, impaired, and other) were used in this analysis. We also ran a linear discriminant analysis (Johnson and Wichern, 1992) to determine how well the PCA axes were able to classify reference and impaired sites.
180
D. J. KLEMM ET AL.
3. Results 3.1. M ETRIC EVALUATION 3.1.1. Discriminatory Power Twenty-seven of the initial 45 metrics showed clear discriminatory power between reference and impaired sites, scoring a 2 or a 3 in box plots of reference versus impaired sites (Table III). Only these metrics were retained for further evaluation. 3.1.2. Relative Scope of Impairment Of the 27 remaining metrics, only percent Plecoptera individuals and EPT/Chiro nomidae ratio had little relative scope of impairment and were excluded from subsequent analyses (Table IV). Percent Plecoptera taxa had a marginal interquart ile coefficient (1.06), but it was retained for further analysis because it was very close to the desired range. The coefficients for most other metrics were well below 1. 3.1.3. Relationship to Environmental Variables All of the 25 remaining candidate metrics were correlated with one or more envir onmental variables (Table IV). 3.1.4. Repeatability Most of the remaining metrics had reasonably good repeatability between site visits. Plots for percent tolerant taxa, Simpson’s diversity index, percent Ephemer optera individuals, modified percent Ephemeroptera individuals, and percent Eph emeroptera taxa all showed cone-shaped trends or high variability around the 45 degree line, so these metrics were eliminated (Table IV, Figure 3). 3.2. OTHER CONSIDERATIONS 3.2.1. Redundancy of Metrics Among the remaining 20 metrics, many were correlated with one another, but most did not indicate redundancy in plots. Percent intolerant taxa and percent EPT taxa were highly correlated and redundant (r = 0.91). Based on both correlations and scatter plots, percent intolerant taxa was also redundant with percent facultative taxa (r = 0.82). Numbers of EPT taxa, modified EPT taxa, intolerant taxa, and Ephemeroptera taxa were also redundant (r = 0.84 to 0.98). Number of Trichoptera taxa was redundant with percent Trichoptera taxa (r = 0.81). Shannon diversity was redundant with percent dominant 5 taxa, percent dominant 2 taxa, and percent dominant taxon (r = –0.95, –0.95, and –0.91, respectively). Finally, HBI was re dundant with percent EPT individuals (r = –0.857). For all other pairs of correlated metrics, scatter plots indicated either a non-linear relationship or wide variation along a linear trend, such that each metric could be considered separately.
181
EVALUATION OF BENTHIC MACROINVERTEBRATE METRICS
TABLE IV Results of evaluation based on metrics passing test of discriminatory power (Table III) Metric
Rel. scope of impairment
Relationship to environmental variables, top 3 significant correlations (r, n)
Total no. of taxa Simpson’s Diversity Index Shannon Diversity Index No. of EPT taxa
0.36 0.04 0.18 0.35
Modified no. EPT taxa
0.44
No Ephemeroptera taxa
0.75
No. Plecoptera taxa
1.00
No. Trichoptera taxa
0.75
No. intolerant taxa
0.47
HBI
0.17
% Intolerant taxa
0.29
% Tolerant taxa
0.04
% Facultative taxa
0.23
% Indiv. in dominant taxon % in 2 dominant taxa % in 5 dominant taxa % Non-insects
0.12
% EPT taxa
0.24
% Ephemeroptera taxa
0.33
% Plecoptera taxa
1.09
% Trichoptera taxa
0.63
Sulfate (–0.292, 422) Sulfate (0.243, 422) Sulfate (–0.283, 422) RBP embeddedness (0.410, 382) Conductivity (–0.454, 422) RBP embed. (0.313, 382) Conductivity (–0.575, 422) RBP mean habitat (0.362, 413) Conductivity (–0.396, 422) Population density (0.475, 424) Population density (–0.453, 424) Conductivity (0.452, 422) RBP epifaunal subst. (–0.322, 413) RBP embed. (–0.203, 382) Sulfate (0.213, 422) Sulfate (0.260, 422) TSS (0.348, 422) Population density (–0.470, 424) RBP embed. (0.318, 382) ANC (–0.541, 422) RBP mean habitat (0.390, 413)
% EPT individuals
0.60
% Ephemeroptera individuals Modified % Ephem. indiv.
0.65 0.79
% Plecoptera individuals % Chironomid taxa
2.31 0.17
EPT/Chironomid ratio
2.47
0.18 0.40 0.02
Conductivity (–0.457, 422) Conductivity (–0.310, 422) Conductivity (–0.311, 422) – Population density (0.368, 424)
–a – – Conductivity (–0.404, 422) RBP embed. (0.417, 382) Sulfate (–0.289, 422) Chloride (–0.495, 422) RBP epifaunal substrate (0.334, 413) RBP embed. (0.394, 382) Conductivity (0.470, 422) Conductivity (–0.442, 422) Chloride (0.446, 422) DOC (0.305, 422) Sulfate (0.193, 422) – – Conductivity (0.330, 422) Conductivity (–0.461, 422) Population density (–0.298, 424) Conductivity (–0.538, 422) RBP bank condition (0.349, 413) Population density (–0.457, 424) Chloride (–0.309, 422) Chloride (–0.305, 422) – Chloride (0.360, 422)
–
–
Repeatability trend – – – Population density (–0.384, 424) Population density (–0.410, 424) Total dissolved Al (–0.282, 422) Population density (0.471, 424) RBP embed. (0.326, 382) Sulfate (–0.370, 422) Chloride (0.459, 422) Chloride (–0.434, 422) Population density (0.432, 424) Population density (0.282, 424) –
Linear Cone-shaped Linear Linear Linear Linear Linear Linear Linear Linear Linear Cone-shaped Linear Linear
– – Population density (0.325, 424) Chloride (–0.449, 422) Total nitrogen (–0.270, 422) Chloride (–0.521, 422) RBP embed. (0.344, 382)
Linear Linear Linear
Housing density (–0.446, 383) Total nitrogen (–0.294, 422) Total nitrogen (–0.291, 422) – Housing unit density (0.359, 383) –
Linear
Linear Cone-shaped Linear Linear
Highly variable Cone-shaped – Linear
–
a – Indicates metric not evaluated at this step because already eliminated or no additional
significant correlations were observed.
182
D. J. KLEMM ET AL.
Figure 3. Metrics showing poor within-year repeatability.
3.2.2. Relationships to Watershed Size When plotted against the natural log of drainage area, several of the remaining metrics exhibited an apparent relationship with watershed size among reference sites. The maximum values for number of taxa, number of Ephemeroptera taxa, and number of Trichoptera taxa and the minimum value for percent facultative taxa increased with increasing watershed size. The maximum value for percent Plecoptera taxa and the minimum values for percent individuals in the dominant
EVALUATION OF BENTHIC MACROINVERTEBRATE METRICS
183
Figure 4. Examples of relationships between log(watershed area) and maximum values for total number of taxa and percent Plecoptera taxa.
2 taxa and percent individuals in the dominant 5 taxa decreased with increasing watershed size. Examples of relationships observed are shown in Figure 4. 3.3. M ULTIVARIATE ANALYSES The Box-Cox procedure preceding PCA indicated that most metrics required trans formation to optimize univariate normality. The preferred transformations con sisted of exponentiations of the raw data. First axes of the two PCAs were highly correlated (r = 0.95), and the second axes of the two PCAs were just as highly correlated with one another (r = 0.95). The first principal components axis, based the full set of metrics, represented about 34% of the variability in the data, and loadings for this axis were relatively large (>0.20) for about half of the set of metrics remaining after evaluation. These included numbers of EPT, modified EPT, intolerant, Ephemeroptera, and Plecoptera taxa, percentages of EPT and intolerant taxa, percentages of Ephemeroptera, modified Ephemeroptera, and EPT individu als, and the EPT/Chironomidae ratio. The second axis (17% of variability) had high loadings (>0.20) for number of taxa, Simpson diversity index, Shannon diversity, number of chironomid taxa, percentage chironomid individuals, and percentages in the dominant 1, 2, and 5 taxa. The first axis of the PCA based on the subset of met rics represented 50% of the variability in the data, and loadings were large (>0.25) for all but the number of taxa and percent dominant taxon, which had the highest loadings (0.64 and 0.55, respectively) on the second axis (20% of variability). A linear discriminant function using the PCA axes based on the nine selected metrics showed that the axes were effective at distinguishing reference from impaired sites (Figure 5). Approximately 91% of reference sites and 78% of impaired sites were correctly classified using the linear discriminant function.
184
D. J. KLEMM ET AL.
Figure 5. Separation of reference and impaired sites along first and second principal component axes based on 9 selected metrics.
4. Discussion Several of the region-scale candidate metrics were effective in detecting general impairment in the MAHR. However, when metrics currently being used by the three states in which the majority of MAHA samples were collected were applied at the regional scale, there was great variation in their performance. Those that are used in some form by all three of the states (Table II) that performed well included number of taxa, EPT richness, and HBI. These same metrics performed well for mid-Atlantic coastal plain streams and were selected as part of the Coastal Plain Macroinvertebrate Index (CPMI) (Maxted et al., 2000). Numbers of total taxa and EPT taxa were also among the most responsive metrics in a Swedish study of acidification and eutrophication in streams (Sandin and Johnson, 2000). These metrics, along with percent dominant taxon, were also the best indicators of metals contamination in the Clark Fork River in Montana (Poulton et al., 1995). Other metrics that performed well that were used by at least one of the three states were percent EPT individuals and percent dominant 2 taxa. Several state metrics did not perform well at the region level. State metrics unable to distinguish reference from impaired sites at the region level included percent shredder individuals, the ratio of scrapers to collector-filterers, and per cent chironomid individuals. The ratio of EPT to Chironomidae individuals dis tinguished reference and impaired sites, but this metric was too variable among
EVALUATION OF BENTHIC MACROINVERTEBRATE METRICS
185
regional reference sites to be effective at detecting impairment. Based on revisits to sites, the modified % Ephemeroptera metric was highly variable within a year. Finally, at the regional scale, the HBI was redundant with percent EPT individuals. Among the other candidate metrics, none of the functional feeding group met rics performed well at the regional scale. Our results support the conclusions of Karr and Chu (1997) that trophic metrics are not generally as reliable as metrics based on taxonomic groupings. In a study in southwest Germany, several functional feeding group metrics differed significantly between reference and impaired sites in highlands streams (Rawer et al., 2000). However, in southeastern Kentucky, functional feeding groups showed little difference between a reference headwater stream and one with past mining and logging disturbance (Pond, 2000). Carlisle and Clements (1999) also found that most functional feeding group metrics had low statistical power and were insensitive to metal pollution in the Arkansas River. In addition, classification of macroinvertebrates into functional feeding groups can be problematic because the feeding mode of a given taxon may be unknown (Merritt and Cummins, 1996) or change with life stage (Allan, 1995). This study evaluated the performance of macroinvertebrate metrics at the re gional scale, and most of the sites sampled were chosen using a probability-based design. Thus, factors affecting the range and performance of individual metrics re flect regional characteristics. It is not surprising, therefore, that some of the metrics used by individual states did not perform well at the regional scale. This analysis does not necessarily invalidate those metrics. By the regional and probabilistic nature of its design, this study did not include all areas of any given state, and metric evaluation incorporated conditions and potential stressors which may vary from state to state in the region. Thus, metrics useful at the regional scale should be evaluated and applied at the appropriate scale. An additional limitation to comparing these results to those obtained by indi vidual states in the region is that all metrics for this study were based on iden tification of specimens to the lowest possible taxon, and the pollution tolerance values were determined at that taxonomic level. Identification of specimens to a higher taxonomic level (i.e., class or family) or to varying levels depending on the macroinvertebrate group by states would likely have generated different results and data interpretation. In such a situation, a direct comparison of our region-scale results with state-specific results might be confounded by differences in taxonomic resolution. Several metrics remaining after regional-scale evaluation appeared to be related to watershed area. Ohio EPA also observed relationships with watershed size for number of taxa, number of Ephemeroptera taxa, and number of Trichoptera taxa, although the direction of trends of our data do not necessarily correspond with those found by Ohio EPA (DeShon, 1995). As recognized by DeShon (1995), if a metric that is related to drainage area (watershed size) is included in a multimetric index, the expectations need to be adjusted when scoring the metric. For metrics that decrease with increasing stress, the maximum value as watershed size
186
D. J. KLEMM ET AL.
increases is of greatest interest because higher values indicate higher quality sites. However, for metrics that increase with increasing stress, the minimum value is more important because the lower the values for these metrics, the higher quality the sites. All metrics used by states that were evaluated and had discriminatory power were important in separating sites along the first or second axis of the PCAs. The smaller subset of metrics, which excluded any redundant metrics, effectively sum marized the information in the larger set of metrics. In addition, this combination of metrics along the two PCA gradients (axes) was also effective in distinguishing reference from impaired sites. Based on this analysis, measures of composition and richness of specific macroinvertebrate groups may be more important in dis tinguishing reference and impaired sites than total richness, diversity, evenness, or functional feeding group measures.
Acknowledgements We wish to thank Philip A. Lewis, Jim Green, James Lazorchak, Phil Larsen, John Stoddard, and David Peck (USEPA), Robert Hughes (Dynamic Corp.), and Ian Waite (USGS) for assistance and suggestions relating to various aspects of EMAP and Regional EMAP (R-EMAP) research. We also thank Erica Grimmett, Brad Autrey, Shawn Mills (SoBran, Inc.) for Paradox database entry and editing, the macroinvertebrate taxonomists, EMAP field crews, and Mary Schubauer-Berigan (NIOSH) for their assistance with various aspects of data collection, analysis, and interpretation. Finally, we thank Donald W. Schloesser (USGS) for suggestions provided in reviewing the manuscript.
EVALUATION OF BENTHIC MACROINVERTEBRATE METRICS
Appendix Mid-Atlantic Highlands Region (MAHR) macroinvertebrate
taxa list with pollution tolerance values (PTVa )
Taxa name Haplotaxida Aeolosoma sp. Arhynchobdellida Erpobdella punctata punctata Rhynchobdellida Helobdella stagnalis Placobdella hollensis Placobdella sp. Piscicola milneri Piscicola sp. Branchiobdellida Xironogiton sp. Haplotaxida Haplotaxis cf. gordioides Lumbriculida Eclipidrilus sp. Lumbriculus inconstans Lumbriculus variegatus Stylodrilus heringianus Lumbricidae Tubificida Enchytraeidae Arcteonais lomondi Bratislava/Pristinella Chaetogaster diaphanus Chaetogaster sp. Dero obtusa Dero sp. Nais barbata Nais behningi Nais bretscheri Nais communis Nais elinguis Nais pardalis Nais pseudobtusa
PTV
8.0 8.0 8.0 6.0 6.0 6.5 6.5 7.0 6.7 5.5 7.5 7.8 8.0 8.3 7.7 7.0 6.7 9.0 6.0 6.0 8.0 8.0 8.0 6.0 7.0 8.3 10.0 8.3 8.3
a Pollution Tolerance Values (PTV) range from 0 (most
intolerant) to 10 (most tolerant) and were obtained by de termining the tolerance values of organisms to various types of stressors and calculating an average value.
187
188
D. J. KLEMM ET AL.
Appendix (continued) Taxa name
PTV
Tubificida (continued) Nais simplex Nais variabilis Ophidonais serpentina Piguetiella michiganensis Piguetiella/Uncinais Pristinella jenkinae Pristinella osborni Pristinella sp. Slavina appendiculata Specaria josinae Stylaria lacustris Aulodrilus americanus Aulodrilus limnobius Aulodrilus pluriseta Bothrioneurum vejdovskyanum Branchiura sowerbyi Ilyodrilus templetoni Isochaetides curvisetosus Isochaetides freyi Limnodrilus cervix Limnodrilus claparedianus Limnodrilus hoffmeisteri Limnodrilus tortilipenis Limnodrilus udekemianus Potamothrix hammoniensis Potamothrix moldaviensis Potamothrix vejdovskyi Quistadrilus multisetosus Rhyacodrilus falciformis Rhyacodrilus sp. Spirosperma carolinensis Spirosperma ferox Spirosperma nikolskyi Tasserkidrilus kessleri Tubifex tubifex Tubificidae w/capilliform chaetae Tubificidae w/o capilliform chaetae
6.5 10.0 6.5 6.0 8.0 8.9 8.9 8.9 6.3 5.0 6.0 6.7 6.7 6.7 5.3 8.0 7.0 6.0 8.0 8.8 8.0 9.3 8.3 10.0 6.0 6.0 6.0 8.0 5.0 5.0 7.8 6.0 7.2 8.0 9.5 8.0 8.0
EVALUATION OF BENTHIC MACROINVERTEBRATE METRICS
Appendix (continued) Taxa name Acariformes Hygrobates sp. Lebertia sp. Limnesia sp. Limnochares sp. Sperchon sp. Amphipoda Crangonyx sp. Stygonectes sp. Synurella chamberlaini Gammarus minus Gammarus sp. Stygobromus sp. Hyalella azteca Decapoda Cambarus bartonii Cambarus bartonii/sciotensis Cambarus cornutus Cambarus/Fallicambarus Orconectes limosus Orconectes rusticus Orconectes sanborni Orconectes sp. Isopoda Caecidotea kenki Caecidotea sp. Lirceus brachyurus Lirceus sp. Coleoptera Helichus basalis Helichus fastigiatus Agabus sp. Deronectes/Oreodytes Hydaticus sp. Hydroporus sp. Ilybius sp. Laccophilus sp. Liodessus sp. Lioporeus sp.
PTV
6.0 6.0 6.0 6.0 6.0 8.1 5.0 4.0 5.3 5.3 6.0 6.0 6.0 6.0 6.0 6.0 5.5 6.5 5.7 6.0 6.7 6.7 7.3 7.3 6.0 6.0 4.7 5.6 6.0 5.0 5.7 5.3 6.0 6.0
189
190
D. J. KLEMM ET AL.
Appendix (continued) Taxa name Coleoptera (continued) Oreodytes sp. Uvarus sp. Ancyronyx variegata Dubiraphia bivittata Dubiraphia quadrinotata Dubiraphia vittata Macronychus glabratus Microcylloepus sp. Optioservus ampliatus Optioservus fastiditus Optioservus immunis Optioservus ovalis Optioservus trivittatus Oulimnius latiusculus Promoresia elegans Promoresia tardella Stenelmis concinna Stenelmis crenata Stenelmis gammoni Stenelmis mera Stenelmis morsei Dineutus sp. Gyrinus sp. Peltodytes sp. Helophorus sp. Hydraenidae Hydrochus sp. Anacaena sp. Berosus sp. Cymbiodyta sp. Enochrus sp. Helocombus sp. Hydrobius sp. Laccobius sp. Paracymus sp. Sperchopsis sp. Sperchopsis tessellata
PTV
5.6 5.3 4.6 6.3 7.7 6.7 5.7 3.7 3.3 3.7 3.5 3.5 3.7 3.2 4.0 3.2 5.7 5.7 5.7 5.7 5.7 6.0 5.7 6.3 5.3 5.3 5.0 5.7 6.3 4.7 5.0 5.3 3.7 5.3 5.3 5.0 5.0
EVALUATION OF BENTHIC MACROINVERTEBRATE METRICS
Appendix (continued) Taxa name Coleoptera (continued) Tropisternus sp. Ectopria nervosa Ectopria sp. Psephenus herricki Anchytarsus bicolor Cyphon sp. Diptera Atherix sp. Atherix variegata Blepharicera sp. Blepharicera tenuipes Alluaudomyia sp. Atrichopogon sp. Bezzia gr. Ceratopogon sp. Culicoides sp. Dasyhelea sp. Palpomyia sp. Probezzia sp. Stilobezzia sp. Ablabesmyia janta Ablabesmyia mallochi Ablabesmyia monilis Ablabesmyia rhamphe gr. Ablabesmyia simpsoni Ablabesmyia sp. Antillocladius sp. Apsectrotanypus johnsoni Arctopelopia sp. Brillia flavifrons Brillia parva Brillia sera Brundiniella eumorpha Bryophaenocladius sp. Cardiocladius sp. Chaetocladius piger gr. Chaetocladius sp.
PTV
5.7 3.3 3.3 4.7 4.7 6.0 3.7 3.7 4.0 3.5 6.2 5.3 6.3 6.3 7.0 6.3 6.3 6.3 6.7 5.7 4.7 5.5 5.7 6.0 5.3 5.7 1.3 4.0 3.3 2.5 2.7 3.7 4.7 5.6 5.2 5.2
191
192
D. J. KLEMM ET AL.
Appendix (continued) Taxa name Diptera (continued) Chironomus sp. Cladopelma laccophila gr. Cladopelma sp. Cladotanytarsus mancus gr. Cladotanytarsus sp. Cladotanytarsus vanderwulpi gr. Clinotanypus pinguis Conchapelopia sp. Constempellina sp. Corynoneura sp. Cricotopus annectens Cricotopus annulator gr. Cricotopus bicinctus Cricotopus curtus gr. Cricotopus flavocinctus Cricotopus fuscus gr. Cricotopus intersectus gr. Cricotopus laetus Cricotopus sp. Cricotopus sylvestris gr. Cricotopus tremulus gr. Cricotopus triannulatus gr. Cricotopus tricinctus Cricotopus trifascia Cricotopus tristis Cricotopus vierriensis Cryptochironomus fulvus gr. Cryptochironomus sp. Cryptotendipes sp. Demicryptochironomus sp. Diamesa nivoriunda Diamesa sp. Diamesa spinacies Dicrotendipes fumidus Dicrotendipes incurvus Dicrotendipes modestus Dicrotendipes neomodestus
PTV
8.3 5.0 5.0 5.3 5.5 5.5 5.0 5.8 4.8 6.7 6.3 6.7 7.0 6.7 6.7 6.7 6.5 6.7 6.3 5.0 6.0 6.5 6.7 6.0 6.7 4.8 6.3 6.0 5.2 4.3 4.2 3.7 4.2 5.3 6.7 4.7 7.0
EVALUATION OF BENTHIC MACROINVERTEBRATE METRICS
Appendix (continued) Taxa name Diptera (continued) Dicrotendipes nervosus Diplocladius cultriger Djalmabatista pulchra Djalmabatista sp. Doithrix sp. Doithrix villosa Einfeldia natchitocheae Einfeldia sp. Endochironomus nigricans Endochironomus subtendens Epoicocladius flavens Epoicocladius sp. Eukiefferiella brehmi gr. Eukiefferiella brevicalcar gr. Eukiefferiella claripennis gr. Eukiefferiella coerulescens gr. Eukiefferiella cyanea gr. Eukiefferiella devonica gr. Eukiefferiella gracei gr. Eukiefferiella pseudomontana gr. Eukiefferiella rectangularis gr. Euryhapsis sp. Glyptotendipes sp. Glyptotendipes sp. A Guttipelopia guttipennis Harnischia sp. Hayesomyia senata Heleniella sp. Helopelopia sp. Heterotrissocladius hirtapex Heterotrissocladius marcidus gr. Heterotrissocladius sp. Heterotrissocladius subpilosus Hydrobaenus sp. Kiefferulus sp. Krenopelopia sp. Krenosmittia sp.
PTV
5.2 3.7 5.6 6.0 3.5 3.5 6.7 6.7 6.0 6.0 1.7 2.7 4.7 5.0 5.0 5.0 5.0 5.0 4.5 5.7 4.5 5.0 6.7 6.7 3.0 6.0 4.7 5.3 5.7 4.0 4.0 3.7 4.0 4.7 5.3 4.3 5.3
193
194
D. J. KLEMM ET AL.
Appendix (continued) Taxa name Diptera (continued) Labrundinia pilosella Labrundinia sp. Larsia sp. Lauterborniella agrayloides Limnophyes sp. Lopescladius sp. Macropelopia decedens Meropelopia americanus Meropelopia flavifrons Mesocricotopus sp. Mesocricotopus thienemanni Mesosmittia sp. Metriocnemus fuscipes gr. Metriocnemus sp. Microchironomus sp. Micropsectra sp. Micropsectra sp. 1 Micropsectra sp. 2 Microtendipes pedellus gr. Microtendipes rydalensis gr. Nanocladius (Plecopteracoluthus) Nanocladius balticus gr. Nanocladius crassicornus gr. Nanocladius distinctus Nanocladius downesi Nanocladius parvulus Nanocladius parvulus gr. Nanocladius rectinervis Natarsia baltimorea Natarsia sp. A Neozavrelia sp. Nilotanypus fimbriatus Nilotanypus sp. Nilothauma sp. Odontomesa fulva Oliveridia sp. Omisus sp.
PTV
6.0 6.0 6.0 4.3 5.0 5.7 5.2 5.3 5.7 4.5 4.5 6.0 5.0 5.0 5.3 5.0 5.0 5.0 5.3 5.3 3.5 3.3 3.8 3.3 3.7 3.7 3.7 3.3 5.7 5.7 5.3 5.0 5.7 4.2 4.5 4.7 4.6
EVALUATION OF BENTHIC MACROINVERTEBRATE METRICS
Appendix (continued) Taxa name Diptera (continued) Orthocladiinae genus F Orthocladius (Eudactylocladius) sp. Orthocladius (Euorthocladius) sp. Orthocladius carlatus Orthocladius clarkei Orthocladius curtiseta gr. Orthocladius dentifer Orthocladius dorenus Orthocladius lapponicus Orthocladius (Symposiocladius) lignicola Orthocladius mallochi Orthocladius nigritus gr. Orthocladius obumbratus Orthocladius oliveri Orthocladius robacki Pagastia sp. Pagastia sp. A Pagastiella sp. Paraboreochlus sp. Parachaetocladius sp. Parachironomus pectinatellae Parachironomus sp. Paracladius sp. Paracladopelma camptolabis gr. Paracladopelma doris Paracladopelma nais Paracladopelma nereis gr. Paracladopelma undine Paracricotopus sp. Parakiefferiella sp. Paralauterborniella nigrohalteralis Paralimnophyes sp. Paramerina anomala Paramerina sp. Parametriocnemus lundbecki Parametriocnemus sp.
PTV
5.0 5.0 5.0 4.7 4.3 4.3 4.0 4.7 4.7 5.0 5.0 4.0 5.0 5.0 4.7 1.8 1.8 4.0 5.3 4.3 5.8 6.0 4.3 5.0 5.0 5.3 6.0 5.3 5.3 4.7 5.3 8.5 4.5 5.0 3.3 3.7
195
196
D. J. KLEMM ET AL.
Appendix (continued) Taxa name Diptera (continued) Parametriocnemus sp. F Paraphaenocladius sp. Parasmittia sp. Paratanytarsus sp. Paratendipes albimanus Paratendipes sp. Paratendipes subaequalis gr. Paratrichocladius sp. Pentaneura sp. Phaenopsectra dyari Phaenopsectra obediens gr. Phaenopsectra punctipes gr. Polypedilum angulum Polypedilum aviceps Polypedilum convictum gr. Polypedilum fallax Polypedilum halterale gr. Polypedilum illinoense gr. Polypedilum laetum Polypedilum obtusum Polypedilum ophioides Polypedilum scalaenum gr. Polypedilum simulans gr. Polypedilum sp. A Polypedilum sp. C Polypedilum trigonus Polypedilum tritum Potthastia gaedii gr. Potthastia longimana gr. Procladius (Psilotanypus) bellus Procladius sp. Prodiamesa olivacea Propsilocerus sp. Psectrocladius (Mesopsectrocladius) Psectrocladius limbatellus Psectrocladius psilopterus gr. Psectrocladius sp.
PTV
3.7 4.0 4.0 5.0 4.0 4.4 4.8 6.0 6.0 5.0 4.7 5.0 5.8 5.3 6.2 6.3 5.3 6.3 4.3 6.0 5.7 5.7 5.7 5.8 5.8 6.0 5.7 4.7 4.7 6.7 6.3 4.3 4.7 5.7 5.7 4.8 5.7
EVALUATION OF BENTHIC MACROINVERTEBRATE METRICS
Appendix (continued) Taxa name Diptera (continued) Psectrotanypus discolor Psectrotanypus dyari Pseudochironomus articaudus Pseudochironomus fulviventris Pseudochironomus sp. Pseudodiamesa sp. Pseudorthocladius sp. Pseudosmittia sp. Psilometriocnemus sp. Rheocricotopus cf. atripes Rheocricotopus eminellobus Rheocricotopus fuscipes gr. Rheocricotopus glabricollis Rheocricotopus pauciseta Rheocricotopus robacki Rheocricotopus tuberculatus Rheopelopia sp. Rheosmittia sp. Rheotanytarsus distinctissimus gr. Rheotanytarsus exiguus gr. Rheotanytarsus sp. Robackia demeijerei Robackia sp. Saetheria sp. Saetheria tylus gr. Smittia sp. Stempellina bausei gr. Stempellina johannseni gr. Stempellina sp. Stempellinella sp. Stenochironomus sp. Stictochironomus annulicris Stictochironomus devinctus Stictochironomus flavicingula Stictochironomus marmoreus Stictochironomus sp. Stilocladius clinopecten
PTV
6.0 6.3 4.5 3.7 4.3 3.3 5.7 3.0 5.3 5.0 6.0 5.5 5.0 5.0 4.7 5.3 5.3 5.3 4.7 4.5 4.0 4.7 4.3 4.0 4.3 5.6 3.3 3.7 3.3 4.7 4.0 4.3 4.3 4.3 5.3 4.7 5.0
197
198
D. J. KLEMM ET AL.
Appendix (continued) Taxa name Diptera (continued) Sublettea coffmani Sympotthastia sp. Syndiamesa sp. Synorthocladius sp. Tanypus carinatus Tanypus punctipennis Tanypus sp. Tanytarsus curticornis gr. Tanytarsus glabrescens Tanytarsus guerlus gr. Tanytarsus sp. 1 Tanytarsus sp. 2 Tanytarsus sp. 3 Tanytarsus sp. 4 Tanytarsus sp. 5 Tanytarsus sp. 6 Tanytarsus sp. 7 Tanytarsus sp. 8 Tanytarsus sp. 9 Tanytarsus sp. 10 Tanytarsus sp. 11 Tanytarsus sp. 12 Tanytarsus sp. 13 Telopelopia sp. Thienemannia sp. Thienemanniella sp. Thienemanniella xena Thienemannimyia gr. Thienemannimyia sp. Tribelos fuscicorne Tribelos jucundum Tribelos sp. Trissopelopia ogemawi Tvetenia bavarica gr. Tvetenia discoloripes gr. Unniella multivirga Xenochironomus sp.
PTV
2.0 4.7 5.3 5.3 4.3 4.7 5.0 5.7 6.7 6.3 6.0 6.0 6.0 6.0 6.0 6.0 6.0 6.0 6.0 6.0 6.0 6.0 6.0 5.2 5.7 5.3 5.5 5.2 5.2 5.2 4.3 4.8 3.7 5.8 5.7 1.2 4.0
EVALUATION OF BENTHIC MACROINVERTEBRATE METRICS
Appendix (continued) Taxa name Diptera (continued) Xylotopus par Zavrelia sp. Zavrelimyia sp. Aedes sp. Anopheles sp. Dixa sp. Dixella sp. Dolichopodidae Chelifera sp. Clinocera sp. Hemerodromia sp. Oreogeton sp. Ephydridae Limnophora sp. Pericoma sp. Psychoda sp. Bittacomorpha sp. Ptychoptera sp. Scathophagidae Cnephia sp. Prosimulium rhizophorum Prosimulium sp. Simulium decorum Simulium quebecense Simulium sp. Simulium tuberosum complex Simulium venustum/verecundum complex Simulium vittatum Stegopterna mutata Stegopterna sp. Twinnia tibblesi Caloparyphus sp. Euparyphus sp. Myxosargus sp. Nemotelus sp. Odontomyia sp. Chrysops sp.
PTV
6.0 5.0 5.0 6.7 6.7 6.0 6.0 5.3 6.3 6.0 6.3 6.5 5.6 5.0 6.7 8.7 5.3 5.0 6.0 3.3 5.0 5.3 5.6 5.0 5.6 4.7 4.5 6.0 3.3 3.3 3.5 6.2 6.7 6.2 6.2 6.0 6.0
199
200
D. J. KLEMM ET AL.
Appendix (continued) Taxa name Diptera (continued) Hybomitra sp. Tabanus sp. Protoplasa fitchii Antocha sp. Cryptolabis sp. Dactylolabis sp. Dicranota sp. Erioptera sp. Gonomyia sp. Helius sp. Hexatoma sp. Limnophila sp. Limonia sp. Lipsothrix sp. Molophilus sp. Ormosia sp. Paradelphomyia sp. Pedicia sp. Pilaria sp. Polymera sp. Prionocera sp. Pseudolimnophila sp. Rhabdomastix sp. Tipula sp. Ephemeroptera Ameletus sp. Acentrella ampla Acentrella insignificans Acentrella sp. Acerpenna macdunnoughi Baetis brunneicolor Baetis flavistriga Baetis intercalaris Baetis tricaudatus gr. Callibaetis sp. Centroptilum sp. Cloeon sp. Baetisca carolina
PTV
6.7 6.7 4.3 3.7 4.0 4.0 4.8 3.3 5.6 4.7 5.3 4.3 4.7 4.3 5.3 5.3 4.3 4.3 4.3 5.8 5.7 3.3 3.3 5.7 3.7 3.3 2.7 3.3 3.5 2.7 2.7 2.7 2.7 4.0 2.5 2.8 3.4
EVALUATION OF BENTHIC MACROINVERTEBRATE METRICS
Appendix (continued) Taxa name Ephemeroptera (continued) Baetisca gibbera Baetisca sp. Brachycercus sp. Caenis anceps Caenis diminuta Caenis latipennis Caenis tardata Attenella sp. Drunella cornuta Drunella cornutella Drunella lata Drunella tuberculata Drunella walkeri Ephemerella aurivillii Ephemerella catawba Ephemerella coxalis Ephemerella dorothea Ephemerella excrucians Ephemerella inconstans Ephemerella invaria Ephemerella needhami Ephemerella rossi Ephemerella rotunda Ephemerella septentrional Ephemerella simila Ephemerella subvaria Eurylophella aestiva Eurylophella bicolor Eurylophella bicoloroides Eurylophella doris Eurylophella funeralis Eurylophella macdunnoughi Eurylophella minimella Eurylophella temporalis Eurylophella verisimilis Serratella deficiens Serratella serrata
PTV
2.2 3.8 4.3 2.2 3.8 2.7 3.3 3.0 3.0 3.0 2.7 2.7 2.7 2.7 3.3 2.7 3.0 3.0 3.0 3.0 2.7 2.0 2.7 3.0 2.7 2.7 3.3 3.2 3.2 3.3 3.3 3.3 3.7 3.7 3.3 3.0 3.7
201
202
D. J. KLEMM ET AL.
Appendix (continued) Taxa name Ephemeroptera (continued) Timpanoga lita Timpanoga simplex Ephemera blanda Ephemera guttulata Ephemera simulans Ephemera varia Hexagenia atrocaudata Hexagenia limbata Hexagenia sp. Litobrancha recurvata Cinygmula sp. Epeorus sp. Heptagenia sp. Leucrocuta sp. Rhithrogena sp. Stenacron interpunctatum Stenacron pallidum Stenonema carlsoni Stenonema femoratum Stenonema integrum Stenonema ithaca Stenonema luteum Stenonema mediopunctatum Stenonema meririvulanum Stenonema modestum Stenonema pudicum Stenonema pulchellum Stenonema rubromaculatum Stenonema rubrum Stenonema sinclairi Stenonema terminatum Stenonema tripunctatum Stenonema vicarium Isonychia sp. Choroterpes sp. Habrophlebia vibrans Habrophlebiodes sp.
PTV
3.3 3.3 2.0 2.3 1.7 1.8 3.8 4.5 5.7 4.7 2.2 3.7 4.3 3.0 3.7 5.0 4.3 4.0 5.0 5.0 3.3 3.3 4.2 2.7 3.8 3.7 4.3 3.3 4.3 3.5 4.7 5.3 4.0 2.2 2.7 2.0 4.0
EVALUATION OF BENTHIC MACROINVERTEBRATE METRICS
Appendix (continued) Taxa name Ephemeroptera (continued) Leptophlebia sp. Paraleptophlebia sp. Ephoron leukon Anthopotamus myops Anthopotamus sp. Siphlonurus sp. Leptohyphes sp. Tricorythodes sp. Hemiptera Corisella sp. Dasycorixa sp. Hesperocorixa sp. Palmacorixa sp. Sigara sp. Gerris sp. Limnoporus sp. Trepobates sp. Notonectidae Saldidae Microvelia sp. Rhagovelia sp. Lepidoptera Parapoynx sp. Petrophila sp. Megaloptera Corydalus cornutus Nigronia fasciatus Nigronia serricornis Sialis sp. Odonata Aeshna sp. Boyeria grafiana Boyeria vinosa Calopteryx maculata Calopteryx sp. Argia sp. Enallagma sp.
PTV
3.7 2.7 2.3 3.2 4.0 3.7 2.7 2.8 6.3 7.0 9.0 6.7 6.7 8.0 7.7 6.7 7.0 8.3 7.3 7.3 3.7 3.7 5.8 3.0 3.7 7.0 5.7 6.0 6.0 4.8 4.7 5.0 7.9
203
204
D. J. KLEMM ET AL.
Appendix (continued) Taxa name Odonata (continued) Cordulegaster diastops Cordulegaster erroneus Cordulegaster maculata Cordulegaster obliqua Didymops transversa Helocordulia sp. Neurocordulia sp. Somatochlora sp. Arigomphus lentulus/pallidus Arigomphus sp. Dromogomphus sp. Dromogomphus spinosus Erpetogomphus sp. Gomphus descriptus Gomphus exilis Hagenius brevistylus Lanthus parvulus Lanthus sp. Ophiogomphus mainensis Ophiogomphus sp. Progomphus sp. Stylogomphus albistylus Stylurus sp. Erythemis sp. Pachydiplax longipennis Perithemis sp. Macromia sp. Plecoptera Allocapnia sp. Capnia sp. Nemocapnia sp. Alloperla sp. Alloperla/Paraperla Haploperla brevis Haploperla sp. Rasvena sp. Suwallia marginata
PTV
4.0 5.0 4.7 4.0 4.7 6.0 5.0 4.3 5.0 5.0 4.3 4.3 4.7 5.3 5.3 4.0 5.2 3.3 4.0 3.7 4.3 3.3 4.7 6.3 6.0 5.7 5.0 1.3 1.7 1.7 1.0 1.3 1.7 1.7 0.7 1.0
EVALUATION OF BENTHIC MACROINVERTEBRATE METRICS
Appendix (continued) Taxa name Plecoptera (continued) Sweltsa sp. Utaperla sp. Leuctra sp. Paraleuctra sp. Zealeuctra sp. Amphinemura delosa Amphinemura sp. Nemoura sp. Ostrocerca sp. Paranemoura sp. Soyedina sp. Zapada sp. Peltoperla sp. Tallaperla sp. Viehoperlaada Acroneuria abnormis Acroneuria carolinensis Acroneuria sp. Agnetina sp. Attaneuria sp. Eccoptura xanthenes Hansonoperla appalachia Hesperoperla sp. Neoperla sp. Paragnetina sp. Perlesta sp. Perlinella sp. Clioperla clio Cultus decisus Diploperla sp. Diura sp. Isoperla bilineata Isoperla lata Isoperla nana Malirekus hastatus Malirekus iroquois
PTV
2.0 2.0 2.3 3.3 3.3 4.7 4.7 3.7 3.3 3.3 3.0 3.3 2.8 1.0 2.7 3.5 2.3 2.7 1.7 2.7 3.3 2.5 3.0 3.3 2.7 3.7 3.0 2.0 2.8 2.3 0.5 2.8 3.0 3.0 2.7 2.7
205
206
D. J. KLEMM ET AL.
Appendix (continued) Taxa name Plecoptera (continued) Remenus bilobatus Yugus bulbosus Yugus sp. Pteronarcys sp. Bolotoperla sp. Taeniopteryx sp. Trichoptera Brachycentrus appalachia Brachycentrus sp. Micrasema sp. Anisocentropus pyraloides Phylocentropus sp. Agapetus sp. Culoptila sp. Glossosoma sp. Matrioptila jeanae Goera sp. Goerita sp. Helicopsyche borealis Cheumatopsyche sp. Diplectrona modesta Diplectrona sp. Hydropsyche betteni gr. Hydropsyche carolina Hydropsyche depravata Hydropsyche dicantha/scalaris Hydropsyche scalaris gr. Parapsyche apicalis Parapsyche flavida Parapsyche sp. Symphitopsyche alhedra Symphitopsyche bronta gr. Symphitopsyche cheilonis Symphitopsyche etnieri Symphitopsyche morosa Symphitopsyche slossonae Symphitopsyche sparna
PTV
2.3 3.0 3.0 4.3 3.0 3.0 4.5 4.5 3.7 2.0 3.4 3.0 3.7 3.3 2.3 1.0 2.7 3.0 5.5 3.7 3.7 5.7 4.3 4.3 3.7 4.3 3.3 3.3 3.3 1.7 6.0 4.3 3.0 4.3 3.7 4.7
EVALUATION OF BENTHIC MACROINVERTEBRATE METRICS
Appendix (continued) Taxa name Trichoptera (continued) Symphitopsyche ventura Symphitopsyche walkeri Dibusa sp. Hydroptila sp. Leucotrichia sp. Neotrichia sp. Ochrotrichia sp. Palaeagapetus celsus Stactobiella sp. Lepidostoma sp. Ceraclea sp. Mystacides sp. Nectopsyche sp. Oecetis sp. Setodes sp. Triaenodes sp. Anabolia sp. Apatania sp. Frenesia sp. Hesperophylax sp. Hydatophylax argus Ironoquia sp. Limnephilus sp. Onocosmoecus sp. Pseudostenophylax sp. Pycnopsyche sp. Molanna blenda Molanna sp. Molanna tryphena Psilotreta labida Psilotreta sp. Chimarra sp. Dolophilodes sp. Wormaldia sp. Oligostomis sp. Cernotina sp. Cyrnellus fraternus
PTV
3.7 3.8 4.7 4.7 3.3 5.3 5.0 2.7 2.8 3.0 4.0 4.0 4.4 4.3 3.7 4.5 3.7 2.3 3.3 3.7 3.7 4.3 3.7 3.3 2.0 4.7 3.0 3.0 3.0 1.0 1.0 4.0 3.3 1.3 4.0 4.3 4.0
207
208
D. J. KLEMM ET AL.
Appendix (continued) Taxa name Trichoptera (continued) Neureclipsis crepuscularis Neureclipsis sp. Nyctiophylax sp. Polycentropus sp. Lype diversa Psychomyia flavida Psychomyia sp. Rhyacophila carolina gr. Rhyacophila fuscula gr. Agarodes sp. Fattigia sp. Neophylax sp. Gastropoda Ferrissia rivularis Rhodacmea hinkleyi Fossaria sp. Physa sp. Physella sp. Gyraulus circumstriatus Gyraulus parvus Helisoma sp. Micromenetus dilatatus Planorbula sp. Promenetus umbilicatellus Somatogyrus sp. Elimia sp. Leptoxis carinata Leptoxis praerosa Leptoxis sp. Lithasia sp. Mudalia sp. Pleurocera sp. Pomatiopsis sp. Valvata sp. Campeloma decisum
PTV
5.3 5.3 3.7 4.7 3.3 2.3 2.3 4.3 3.3 2.7 3.0 3.3 5.0 4.0 4.5 7.3 7.3 7.5 7.0 4.7 4.7 6.8 7.5 5.0 3.3 2.8 2.8 2.8 6.0 3.0 5.0 6.0 4.5 5.7
EVALUATION OF BENTHIC MACROINVERTEBRATE METRICS
209
Appendix (continued) Taxa name
PTV
Pelecypoda Lampsilis radiata Corbicula fluminea Musculium partumeium Musculium sp. Pisidium sp. Sphaerium rhomboideum Sphaerium simile Sphaerium sp. Sphaerium striatinum Sphaerium transversum Nematoda Hoplonemertea Prostoma graecense Turbellaria Tricladia Phagocata morgani
5.0 6.3 8.0 7.5 8.0 7.0 8.0 8.0 7.6 8.0 6.0 6.3 6.0 5.0
References
Allan, J. D.: 1995, Stream Ecology: Structure and Function of Running Waters, Chapman and Hall, London, U.K., pp. 131–161. Barbour, M. T. and Stribling, J. B.: 1991, ‘Use of Habitat Assessment in Evaluating the Bio logical Integrity of Stream Communities’, in G. Gibson (ed.), Biological Criteria: Research and Regulation, Proceedings of a Symposium, 12–13 December 1990, Arlington, Virginia, EPA-440-/5-91/005, USEPA, Office of Water, Washington, D.C. Barbour, M. T., Plafkin, J. L., Bradley, B. P., Graves, C. G. and Wisseman, R. W.: 1992, ‘Evaluation of EPA’s rapid bioassessment benthic metrics: Metric redundancy variability among reference stream sites’, Environ. Toxicol. Chem. 1, 437–449. Barbour, M. T., Stribling, J. B. and Karr, J. R.: 1995, ‘The Multimetric Approach for Establishing Biocriteria and Measuring Biological Conditions’, in W. S. Davis and T. Simon (eds), Biolo gical Assessment and Criteria, Tools for Water Resource Planning and Decision Making, Lewis Publishers, Boca Raton, FL, pp. 63–77. Barbour, M. T., Gerritsen, J., Griffith, G. E., Frydenborg, R., McCarron, E., White, J. S. and Bastian, M. L.: 1996a, ‘A framework for biological criteria for Florida streams using benthic macroinvertebrates’, J. N. Am. Benthol. Soc. 15, 185–211. Barbour, M. T., Gerritsen, J. and White, J. S.: 1996b, ‘Development of the Stream Condition Index (SCI) for Florida’, Florida Department of Environmental Protection, Tallahassee, FL.
210
D. J. KLEMM ET AL.
Barbour, M. T., Gerritsen, J., Snyder, B. D. and Stribling, J. B.: 1999, Rapid Bioassessment Protocols for Use in Wadeable Streams and Rivers: Periphyton, Benthic Macroinvertebrates, and Fish, 2nd ed., EPA 841-B-99-002, U.S. Environmental Protection Agency, Washington, D.C. Box, G. E. P. and Cox, D. R.: 1964, ‘An analysis of transformations’, J. Roy. Stat. Soc. (B) 26, 211–243. Carlisle, D. M. and Clements, W. H.: 1999, ‘Sensitivity and variability of metrics used in biological assessments of running waters’, Environ. Toxicol. Chem. 18, 285–291. Davis, W. S. and Simon, T. P. (eds): 1996, Biological Assessment and Criteria Tools for Water Resource Planning and Decision Making, Lewis Publisher, Boca Raton, FL. DeShon, J. E.: 1995, ‘Development and Application of the Invertebrate Community Index (ICI)’, in W. S. Davis and T. P. Simon (eds), Biological Assessment and Criteria, Tools for Water Resource Planning and Decision Making, Lewis Publishers, Boca Raton, FL, pp. 217–243. Fore, L. S., Karr, J. R. and Wisseman, R. W.: 1996, ‘Assessing invertebrate responses to human activities: Evaluating alternative approaches’, J. N. Am. Benthol. Soc. 15, 212–231. Gerritsen, J.: 1995, ‘Additive biological indices for resource management’, J. N. Am. Benthol. Soc. 14, 451–457. Green, J.: 1990, ‘Freshwater Macroinvertebrate Species List Including Tolerance Values and Functional Feeding Group Designations for Use in Rapid Bioassessment Protocols’, Report No. 11075.05, Assessment and Watershed Protection Division, U.S. Environmental Protection Agency, Washington, D.C. and Region 3, U.S. Environmental Protection Agency, Wheeling, WV. Herlihy, A. T., Kaufmann, P. R. and Mitch, M. E.: 1991, ‘Stream chemistry in the Eastern United States, 2. Current sources of acidity in acidic and low acid-neutralizing capacity streams’, Water Resour. Res. 27, 629–642. Herlihy, A. T., Stoddard, J. L. and Johnson, C. B.: 1998, ‘The relationship between stream chemistry and watershed land cover data in the Mid-Atlantic Region, U.S.’, Environ. Monit. Assess. 105, 377–386. Herlihy, A. T., Larsen, D. P., Paulsen, S. G., Urquhart, N. S. and Rosenbaum, B. J.: 2000, ‘Designing a spatially balanced, randomized site selection process for regional stream surveys: The EMAP Mid-Atlantic pilot study’, Environ. Monit. Assess. 63, 95–113. Hilsenhoff, W. L.: 1987, ‘An improved biotic index of organic stream pollution’, Great Lakes Entomol. 20, 31–39. Hughes, R. M.: 1995, ‘Defining Acceptable Biological Status by Comparing with Reference Condi tions’, in W. S. Davis and T. Simon (eds), Biological Assessment and Criteria, Tools for Water Resource Planning and Decision Making, Lewis Publishers, Boca Raton, FL, pp. 31–47. Johnson, R. A. and Wichern, D. W.: 1992, Applied Multivariate Statistical Analysis, 3rd ed., Prentice Hall, Edgewood Cliffs, NJ, 642 pp. Karr, J. R.: 1981, ‘Assessment of biotic integrity using fish communities’, Fisheries 6, 21–27. Karr, J. R.: 1991, ‘Biological integrity: A long-neglected aspect of water resource management’, Ecol. Applicat. 1, 66–84. Karr, J. R.: 1993, ‘Defining and assessing ecological integrity beyond water quality’, Environ. Toxicol. Chem. 12, 1521–1531. Karr, J. R., Fausch, K. D., Angermeier, P. L., Yant, P. R. and Schlosser, I. J.: 1986, Assessing Biolo gical Integrity in Running Waters, A Method and its Rationale, Illinois Natural History Survey, Special Publication 5, Champaign, IL, 28 pp. Karr, J. R. and Kerans, B. L.: 1992, ‘Components of biological integrity: Their definition and use in development of an invertebrate IBI’, in T. P. Simon and W. S. Davis (eds), Environmental Indicators: Measurement and Assessment Endpoints, EPA 905/R-92-003, U.S. Environmental Protection Agency, Chicago, IL, pp. 1–16. Karr, J. R. and Chu, E. W.: 1997, ‘Biological monitoring: Essential foundations for ecological risk assessment’, Hum. Ecolog. Risk Assess. 3, 933–1004.
EVALUATION OF BENTHIC MACROINVERTEBRATE METRICS
211
Karr, J. R. and Chu, E. W.: 1999, Restoring Life in Running Waters, Island Press, Washington, D.C., 206 pp. Klemm, D. J., Lewis, P. A., Fulk, F. and Lazorchak, J. M.: 1990, Macroinvertebrate Field and Labor atory Methods for Evaluating the Biological Integrity of Surface Waters, EPA.600/4-90/030, Environmental Monitoring Systems Laboratory, Office of Modeling, Monitoring Systems, and Quality Assurance, Office of Research and Development, U.S. Environmental Protection Agency, Cincinnati, OH Lenat, D. R.: 1993, ‘A biotic index for the southeastern United States: Derivation and list of tolerance values, with criteria for assigning water-quality ratings’, J. N. Am. Benthol. Soc. 12, 279–290. Lewis, P. A. and Klemm, D. J.: 1990, Pollution Tolerance Values for RARE and EMAP Streams, U.S. Environmental Protection Agency, Office of Research and Development, National Expos ure Research Laboratory, Ecological Exposure Research Division, Ecosystems Research Branch, Cincinnati, OH (unpublished). Maxted, J. R., Barbour, M. T., Gerritsen, J., Poretti, V., Primrose, N., Silvia, A., Penrose, D. and Renfrow, R.: 2000, ‘Assessment framework for Mid-Atlantic coastal plain streams using benthic macroinvertebrates’, J. N. Am. Benthol. Soc. 19, 128–144. Merritt, R. W. and Cummins, K. W.: 1996, An Introduction to the Aquatic Insects of North America, 3rd ed., Kendall/Hunt Publishing Co., Dubuque, IA. Meyer, J. L.: 1997, Stream health: Incorporating the human dimension to advance stream ecology, J. N. Am. Benthol. Soc. 16, 439–447. Neter, J., Kutner, M. H., Nachtsheim, C. J. and Wasserman, W.: 1996, Applied Linear Statistical Models, 4th ed., WCB/McGraw-Hill, Boston, MA, 1408 pp. Ohio EPA: 1988a, Biological Criteria for the Protection of Aquatic Life. Volume I: The Role of Biological Data in Water Quality Assessment, Ohio Environmental Protection Agency, Division of Water Quality Monitoring and Assessment, Columbus, OH. Ohio EPA: 1988b, Biological Criteria for the Protection of Aquatic Life. Volume II: Users Manual for Biological Field Assessment of Ohio Surface Waters, Ohio Environmental Protection Agency, Division of Water Quality Monitoring and Assessment, Columbus, OH. Ohio EPA: 1988c, Biological Criteria for the Protection of Aquatic Life. Volume III: Standardized Biological Field Sampling and Laboratory Methods for Assessing Fish and Macroinvertebrate Communities, Ohio Environmental Protection Agency, Division of Water Quality Monitoring and Assessment, Columbus, OH. Overton, W. S., Stevens, D. L. and White, D.: 1991, Design Report for EMAP, Environmental Mon itoring and Assessment Program, EPA/600/3-91/053, U.S. Environmental Protection Agency, Corvallis, OR. Plafkin, J. L., Barbour, M. T., Porter, K. D., Gross, S. K. and Hughes, R. M.: 1989, Rapid Bioassessment Protocols for Use in Streams and Rivers: Benthic Macroinvertebrates and Fish, EPA 841-D-97-002. U.S. Environmental Protection Agency, Office of Water Regulations and Standards, Washington, D.C. Polls, I.: 1994, ‘How people in the regulated community view biological integrity,’ J. N. Am. Benthol Soc. 13, 598–604. Pond, G. J.: 2000, ‘Comparison of macroinvertebrate communities of two intermittent streams with different disturbance histories in Letcher County, Kentucky’, J. Ky. Acad. Sci. 61, 10–22. Poulton, B. C., Monda, D. P., Woodward, D. F., Wildhaber, M. L. and Brumbaugh, W. G.: 1995, ‘Relations between benthic community structure and metals concentrations in aquatic macroinvertebrates: Clark Fork River, Montana’, J. Freshw. Ecol. 10, 277–294. Rawer, J. C., Boehmer, J., Blank, J. and Rahmann, H.: 2000, ‘Macroinvertebrate functional feeding group methods in ecological assessment’, Hydrobiolog. 422–423, 225–232. Resh, V. H. and Jackson, J. .: 1993, ‘Rapid Assessment Approaches to Biomonitoring Using Benthic Macroinvertebrates’, in D. M. Rosenberg and V. H. Resh (eds), Freshwater Biomonitoring and Benthic Macroinvertebrates, Chapman & Hall, NY, pp. 195–233.
212
D. J. KLEMM ET AL.
Resh, V. V. and McElravy, E. P.: 1993, ‘Contemporary Quantitative Approaches to Biomonitor ing using Benthic Macroinvertebrates’, in D. M. Rosenberg and V. H. Resh (eds), Freshwater Biomonitoring and Benthic Macroinvertebrates, Chapman & Hall, NY, pp. 159–194. Resh, V. H. and Unzicker, J. D.: 1975, ‘Water quality monitoring and aquatic organisms: The importance of species identification,’ J. WPCF 47, 9–19. Reynoldson, T. B., Norris, R. H., Resh, V. H., Day, D. E. and Rosenberg, D. M.: 1997, ‘The refer ence condition: A comparison of multimetric and multivariate approaches to assess water-quality impairment using benthic macroinvertebrates,’ J. N. Am. Benthol. Soc. 16, 833–852. Rosenburg, D. M. and Resh, V. H.: 1993, Freshwater Monitoring and Benthic Macroinvertebrates, Chapman & Hall, New York. Sandin, L. and Johnson, R. K.: 2000, ‘The statistical power of selected indicator metrics using macroinvertebrates for assessing acidification and eutrophication of running waters’, Hydrobiol. 422–423, 233–243. Strahler, A. N.: 1957, ‘Quantitative analysis of watershed geomorphology’, Trans. Am. Geophys. Un. 38, 913–920. Stribling, J. B., Jessup, B. K. and White, J. S.: 1998, ‘Development of a Benthic Index of Biotic Integrity for Maryland Streams’, Report No. CBWP-EA-98-3, Maryland Department of Natural Resources, Monitoring and Non-Tidal Assessment Division, Annapolis, MD. Suter II, G. W.: 1993, ‘A critique of ecosystem health concepts and indexes’, Environ. Toxicol. Chem. 12, 1533–1539. USEPA: 1987, Handbook of Methods for Acid Deposition Studies, Laboratory Analysis for Surface Water Chemistry, EPA/600/4-87/026, U.S. Environmental Protection Agency, Office of Research and Development, Washington, D.C. USEPA: 1994, Environmental Monitoring and Assessment Program: Surface Waters and Region 3, Regional Environmental Monitoring and Assessment Program: 1994 Pilot Laboratory Meth ods Manual for Streams, EPA/640/R-94/003, U.S. Environmental Protection Agency, Office of Research and Development, National Exposure Research Laboratory and National Health and Environmental Effects Research Laboratory, Research Triangle Park, NC. USEPA: 1998a, Environmental Monitoring and Assessment Program: Surface Waters, Field Opera tions and Methods for Measuring the Ecological Conditions of Wadeable Streams, EPA/620/R 94/004F, U.S. Environmental Protection Agency, Office of Research and Development, Na tional Exposure Research Laboratory and National Health and Environmental Effects Research Laboratory, Research Triangle Park, NC. USEPA: 1998b, Lake and Reservoir Bioassessment and Biocriteria Technical Guidance Document, EPA/841/B-98/007, U.S. Environmental Protection Agency, Office of Wetlands, Oceans, and Watersheds, Office of Science and Technology, Office of Water, Washington, D.C. USEPA: 2001, Laboratory Methods for Processing Macroinvertebrate Samples, Macroinvertebrate Indicator Standard Operating Procedures (SOP #701), U.S. Environmental Protection Agency, Office of Research and Development, National Exposure Research Laboratory, Ecological Exposure Research Division, Ecosystems Research Branch, Cincinnati, OH. Vannote, R. L., Minshall, G. W., Cummins, K. W., Sedell, J. R. and Cushing, C. E.: 1980, ‘The river continuum concept’, Can. J. Fish. Aquat. Sci. 37, 130–137. Waite, I. R., Herlihy, A. T., Larsen, D. P. and Klemm, D. J.: 2000, ‘Comparing strengths of geographic and non-geographic classifications of stream benthic macroinvertebrates in the Mid-Atlantic Highlands, U.S.A.’, J. N. Am. Benthol. Soc. 19, 429–441. Wallace, J. B., Grubaugh, J. W. and Whiles, M. R.: 1996, ‘Biotic indices and stream ecosystem processes: Results from an experimental study’, Ecol. Applicat. 6, 140–151. Yoder, C. O. and Rankin, E. T.: 1995, ‘Ecological Criteria Program Development and Implementation in Ohio’, in W. S. Davis and T. P. Simon (eds), Biological Assessment and Criteria, Tools for Water Resource Planning and Decision Making, Lewis Publishers, Boca Raton, FL, pp. 109–144.