Ubiquitous Computing and Communication Journal
AIR TRAFFIC RUNWAY ALLOCATION PROBLEM USING ARTMAP (ART1) 1
2
Krishan Kumar1 Invertis Institute of Management Studies, Bareilly, India (
[email protected])
Ravendra Singh2 Department of CSIT,IET, MJP Rohilkhand University, Bareilly, India (
[email protected]) Zubair Khan3 Department of Computer Science, IIET, Bareilly, India (
[email protected])
3
3
Ajai Indian3 Invertis Institute of Management Studies,Bareilly (
[email protected])
ABSTRACT The biggest of the ATC challenges is the continuing rise in traffic volumes and which is increasing the movements of airbuses around the airport due to busy runways. This air traffic congestion is increasing the running cost of flights due to unwanted movement of airbuses around the airport and it will also increase the chances of the airbus collision. Such type of problem can be solved either by increasing runway’s capacity which is very costly or by means of providing some artificial intelligence solutions to optimize the utilization of existing capacity. So for optimum utilization of existing resources, some researchers have given the genetic algorithm based solutions but these solutions are not able to minimize the average arrival delay of the air traffic less than 11.25 minutes. In this paper we have proposed Adaptive Resonance Theory ART (ART1) algorithm to produce optimize solution. Our result shows that the average arrival delay of 9 flights using ARTMAP has been minimized to 10.55 minutes.
KEYWORDS- ATC (Air Traffic Control), ATM (Air Traffic Management), Adaptive resonance theory
1 INTRODUCTION Today as we know that Air Traffic is going to increase day by day and creates traffic congestion, delay of flights at airport and hence loss to air industry due to increase in running cost. However, continuing rise in traffic volume can be solved by increasing the existing capacity and will require investment in new automated systems and infrastructure. Improving the current systems will provide a short-term solution. Artificial Intelligence techniques constitute an optimized methodology effective for solving discontinuous, non-convex, nonlinear, or non-analytic problems. Airport ground operations and en-route ATM Safety is being enhanced through the implementation of improved tools for enhancement in conflict
Volume 3 Number 3
Page130
detection and alert systems to reduce cost & delay, as well as improved ground guidance systems will increase situational awareness both in the cockpit and on the ground. Trial and error or cut and try methods for finding the answers to a problem are well accepted in every field of science. The success rate of the cut and try approaches depends greatly on the experience the user has with the problem under consideration. Artificial Intelligence areas like Artificial Neural Networks, Fuzzy Logic, & Genetic Algorithm constitute an optimization methodology effective for solving discontinuous, non-convex, non linear or nonanalytic problems. This research explores the application of such techniques to a non-analytic event-related air traffic control problems that of run-
www.ubicc.org
Ubiquitous Computing and Communication Journal way assignment, sequencing and scheduling of arrival flights at an airport with multiple runways. Today survey of Federal Aviation Administration (FAA) shows that average arrival and departing traffic both are experiencing delays of 15 minutes or more, and a lot of research [3],[4],[5],[6] has been done till now. In order to minimize the fuel consumption and total cost for a flight, we have planned a new tool in java language using ART map which solves the problem of congestion and landing on the airport in a most economical and efficient manner. This tool will proved to be a great assistance for ground controllers and provide them optimized solutions. The major problem of landing at the busiest runways can be solved by calculating the total waiting time and fuel cost an aircraft spend while waiting to land on runway. This method can be applied to modern ATC’s where ground controlling is the major cause of concern and hence we can minimize the average delay. In this paper there is a busy airport with three runways. 2 PROBLEM DESCRIPTION Consider a busy airport with three runways and 9 flights are waiting to land. The ATC problem discussed in this paper has concerns with the runway assignment and scheduling of x arrival flights to y runways.
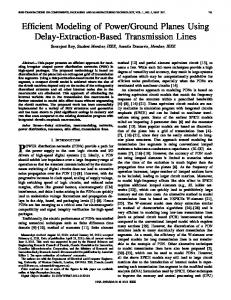
Figure 1: Nine aircrafts are waiting to land on three runways A simple scenario has been arbitrarily generated for evaluation of the two schemes with nine flights and three runways. For identification purposes, the call signs of the flight numbers from 1 to 9 are given by s1, s2, s3, s4, s5, s6, s7, s8, s9. Matrix for eta values (in minutes) is given by
2.1
Assumptions The problem is formulated with the following conditions: 1. For each of flight arrival, an expected time of arrival (eta) to each runway is available as the minimum time to get to the runway. Any restriction in aircraft performance and flight pattern is assumed to have been included in the determination of these expected times of arrival (eta) values. The schedule time of arrival (sta) of a flight to a runway can not be earlier than the corresponding eta. 2. All the flights scheduled to land on a runway have to observe specific separation rules between the leading aircraft and the trailing aircraft based on the aircraft types
3. When a flight is scheduled to a runway, the delay as a result of the schedule is defined as the difference between the schedule time of arrival (sta) and the expected time of arrival (eta) among all the runways for that flight.
Volume 3 Number 3
Page131
16 11
eta [9][3] =
4 5 15 15 16 4 15 5
8 16 8 6 7 6 17 11 13 8 9 16 13 6 7 6 7
Where the rows represent the flight numbers and columns represent runway numbers. sta [ 9]= {16, 27, 28, 19, 23, 21 ,25 ,20, 24} (We have taken 9 values in the above array, which means we are taking only one value out of three values on three runways) 3 METHODOLOGY USED Earlier in 1999 Chang and P.K. Menon used four [3] genetic search schemes, out of which section third to explore the different characteristics associated with
www.ubicc.org
Ubiquitous Computing and Communication Journal the different base to formulate the genetic search. Genetic search methods represent a logical approach to cut and try search methods. Continuing improvements in the computational power of desktop machines make genetic search method a practical methodology for finding the answers to difficult problems. But these solutions are not able to minimize the delay less than 11.25 minutes. So we are proposing an Adaptive Resonance Theory based solution to minimize the delay by using ART1. 3.1 Algorithm A discussion of the choice of parameter values and initial weights follows the training algorithm. The notation we use is as follows: n- number of components in the input vector. m- maximum number of clusters that can be formed. bij-bottom-up weights (from F1(b) unit Xi to F2 unit Yj). tji- top-down weights (from F2 unit Yj to F1 unit Xi). ρ- vigilance parameter. s- binary input vector (an n-tuple). x-activation vector for F1 (b) layer (binary). ║x║ norm of vector x, defined as the sum of the components xi. 3.2 Description A binary input vector s is presented to the F1 (a) layer, and the signals are sent to the corresponding X units. These F1 (b) units then broadcast to the F2 layer over connection pathways with bottom-up weights. Each F2 unit computes its net input, and the units compete for the right to be active. The unit with the largest net input sets its activation to 1; all others have an activation of 0.We shall denote the inbox of the unit as j. This winning unit becomes the candidate to learn the input pattern. A signal is then sent down from F2 to F1 (b) (multiplied by the top down weights). The X units (in the interface portion of the F1 layer) remain “on” only if they receive nonzero signals from both the F1 (a) and F2 units [figure (2)]. The norm of the vector x (the activation vector for the interface portion of F1) gives the number of components in which the top-down weight vector for the wining F2 unit tj and the input vector s are both 1. (This quantity is sometimes is referred to as the
Volume 3 Number 3
Page132
match.) If the ratio of ║x║ and ║s║ is greater than or equal to the vigilance parameter, the weights (top down and bottom up) for the winning cluster unit are adjusted. However, the ratio is less than the vigilance parameter; the candidate unit is rejected, and another candidate unit must be chosen. The current winning cluster becomes inhibited, so that it cannot be chosen again as a candidate on this learning trial, and the activations of the F1 units are reset to zero. The same input vector again sends its signals to the interface units, which again send this as the bottom-up signal to the F2 layer, and the competition is repeated (but without the participation of any inhibited units). The process continues until either a satisfactory match is found (a candidate is accepted) or all units are inhibited. The action to be taken if all units are inhibited must be specified by the user. 3.3 Training Algorithm The training algorithm an ART1 net is presented next. A discussion of the role of the parameters and an appropriate choice of initial weights follows. Step0. Initialize parameters: L > 1, 0 < ρ ≤ 1. Initialize weights: 0 < bij(0) < L / L- 1 + n , tji(0) = 1. Step1. While stopping condition is false, do Steps 2-13. Step2. For each training input, do steps 3-12. Step3. Set activation of all F2 units to zero. Set activations of F1(a) units to input vector s. Step4. Compute the norm of s: ║s║= ∑ si Step5. Send input signal from F1(a) to the F1(b) layer: xi = si. Step6. For each F2 node that is not inhibited: If yj ≠ -1, then yj = ∑ bij*xi. Step7. While reset is true, do step 8-11. Step8. Find J such that yJ ≥ yj for all nodes j. If yj = -1, then all nodes are inhibited and
www.ubicc.org
Ubiquitous Computing and Communication Journal
Figure2: Basic Architecture of ART1
bij: bottom-up weights (from F1(b) unit Xi to F2 unit Yj).Used to store different clusters values. Permissible range is given by
this pattern can not be clustered. Step9. Recompute activation x of F1 (b): xi = si*tji.
0 < bij(0) < L / (L – 1 + n) sample value 1 /( 1 + n).
Step10. Compute the norm of vector x: ║x║ = ∑ xi. Step11. Test for reset: If ║x║ / ║s║ < ρ, then yj = -1 (inhibited node J) (and continue executing Step 7 again) If ║x║ / ║s║ ≥ ρ, Then proceed to Step 12. Step12. Update the weights for node j (fast learning): bij(new) = L*xi / L-1 + ║x║ , tji (new) = xi. Step13. Test for stopping condition. 3.4 Parameters Used n: number of components in the input vector. Used as a sequence of flights. m: maximum number of clusters that can be formed. Used as a runway assignment.
Volume 3 Number 3
Page133
tji: top-down weights (from F2 unit Yj to F1 unit Xi).Used to store runways assignment for different flights. ρ - vigilance parameter.(For deciding the learning node). s - binary input vector (an n-tuple). Input array to store different input values. x - activation vector for F1 (b) layer (binary). Output array to decide the learning node. ║x║ - norm of vector x, defined as the sum of the components xi. Full algorithm is coded by using core java. Now the algorithm works as follows in our case: Initialize parameters: L =50 ρ=0.8 Initialize weights: bij(0) =0.2
www.ubicc.org
Ubiquitous Computing and Communication Journal tji(0) = 1
4 CONCLUSION AND RESULTS
We have taken 9 flights in all and 3 runways at an airport. Each flight is presented as an input pattern one by one in a sequence and the top down weight matrix is updated in which each row is taken as the runway number. The flight sequence is defined by the following table1:
Our main objective of allocating runways to flights (table2) and hence minimizing congestion and minimizing the arrival delays in minutes (table3, figure3) is successfully achieved. The use o Adaptive Resonance Theory (ART1) instead of Genetic Algorithm has drastically reduced the arrival delay and hence cost. The computation time required is reduced 6000 generations to 50 generations as compared with genetic techniques (table4, figure4) and result so obtained are more accurate and optimum. Implementations for all the iterations is done by using java development tool kit (jdk1.6)and on Pentium IV processor. Implementation time is 30 minutes for 50 iterations. For the particular sequence 918653472 at 50 generations following runway assignment is found (shown by table2)
Binary Input pattern
Flight Number
0001
flight1 (s1)
0010
Flight2 (s2)
0011
Flight3 (s3)
0100
Flight4 (s4)
0101
Flight5 (s5)
0110
Flight6 (s6)
0111
Flight7 (s7)
1000
Flight8 (s8)
S. No
1001
Flight9 (s9)
1 2 3 4 5 6 7 8 9
Table1: Input Sequence Pattern as per Flight Sequence After the completion of one sequence pattern different delay values are calculated for that pattern. Flights are assigned to the runways on the basis of top down weight matrix. Flights are arranged in sequence starting from first row for first flight, second row for second flight and so on. Now whatever the value of the runway number in that row, the flight is assigned to that runway. That sequence pattern to be selected is on the basis of delay value that is calculated and is then compare with the other delay values and the minimum one is selected. We have taken the following assumption in our case for runway numbers: Runway 1->0001, 0100, 0111 Runway 2->0010, 0101, 1000 Runway 3->0011, 0110, 1001 and rest of the sequence left up to 1111. This means that if the value in the first row of top down matrix is 0101 then flight number 1 will land at runway 2 and so on. The delay values are calculated by subtracting the expected time of arrival (eta) for a flight at a runway and scheduled time of arrival (sta) for that flight on the scheduled
Volume 3 Number 3
Page134
Sum4 (as per input sequence) 4 15 15 15 15 15 15 15 15
Flight Number s1 s2 s3 s4 s5 s6 s7 s8 s9
Allocated Runway R1 R3 R3 R3 R3 R3 R3 R3 R3
Table2: Runway Allocation Air Traffic Control System Command Center says that general arrival/departure delays are 15 minutes or more. Departures are experiencing air taxi delays of 16 to 45 minutes and also arrivals are experiencing airborne holding delays of 16 to 45 minutes. Traffic destined to this airport is being delayed at its departure point. Departures are experiencing taxi delays greater than 45 minutes and/or arrivals are experiencing airborne holding delays greater than 45 minutes. So we can say that our results are far better. 5 FUTURE WORK This technique can be further implemented to air and local control of ATC to provide the optimum air traffic control at the busiest airport. Also the first module, which we implemented with this problem can be combined with second module by using adaptive resonance theory (ART2) to get the best air traffic simulation tool. Further work will concentrate in refining the modeling and the global criteria to optimize, taking into account for example take-off
www.ubicc.org
Ubiquitous Computing and Communication Journal sequencing needs of approach sectors or priority levels for slotted departures.
Table3: Delay according to our proposed ART1
Delay(in minutes)
Sequence of Flights and Corresponding Average Delay in Minutes 485291673:15 148569327:15 163297548:14.5555555 362579481:14.5555555 167834592:14.5555555 854173692:14.2222222 275194368:14 879156342:14 498175362:14 918653472:13.7777777 315864972:13.7777777 437295168:12.1111111 781569423:12.1111111 187569423:11.2222222 871564932:11.2222222 381659247:10.5555555 718596432:10.5555555 841569723:10.5555555 381549628:10.5555555 921567413:10.5555555
16 14 12 10 8 6 4 2 0 0
20
40
60
80
100
120
Generations
Figure3: Results according to our proposed ART1
35 Average Arrival Delay(minutes)
Generations (Iterations) 5 10 15 20 25 30 35 40 45 50 55 60 65 70 75 80 85 90 95 100
Average Landing Time Chart Using ART map
30.25
30 25 20
19
15
13.5 13.5 13
10
11.25
5 0 0
2000
4000
6000
8000
Generations
Figure4: Results according to V.H.L. Chang & et. al. [3] Generations 1000 2000 3000 4000 5000 6000
Fitness value (Delay) 30.25 19 13.5 13.5 13 11.25
REFERENCES
Table4: Delay according to V.H.L.Chang & et. al.[3]
Volume 3 Number 3
Page135
[1] Gail A.Carpenter, Stephen Grossberg, Adaptive Resonance Theory MAP. [2] Yang Yuying, Shi Xizhi, Li Guoyi, Rules from fuzzy adaptive resonance theory map, Progress in Natural Science May 1999, Vol.9 No.5, p.382. [3] V.H.L. Chang, Crawford, P.K.Menon, Air Traffic Control Using Genetic Search Techniques, Optimal synthesis palo alto California, May 1999, Vol.9 No.5, p.382. [4] Nathan L. Kleiman, Stacy D. Hill, Simulation optimization of air traffic delay cost, IEEE Winter Simulation Conference, Proceedings of the 30th Conference on Winter simulation Washington, D.C., United States, Pages: 1177–1182,Year of
www.ubicc.org
Ubiquitous Computing and Communication Journal Publication: 1998,ISBN:0-7803- 5134-7. [5] Delahaye and Elliot, Genetic Algorithm for Air Traffic Assignment, European ECAI 94, 11th Conference on Artificial Intelligence. [6] B. A. Peters, J. S. Smith, D. J. Medeiros, and M. W. Rohrer, eds. David W. Hutchison, Stacy D. Hill, Simulation Optimization of Airline Delay with Constraints, Proceedings of the 2001 Winter Simulation Conference. [7] Heinz Erzberger, The Automated Airspace Concept, 4th USA/Europe Air Traffic Management R&D Seminar, December 2001. [8] Erich Gamma, Richard Helm, Ralph Johnson, and John Vlissides. Design Patterns: Elements of Reusable Object-Oriented Software. AddisonWesley, Reading, Massachusetts, 1995. [9] Tom G. Reynolds and R. John Hansman. Conformance monitoring approaches in current and future air traffic control environments. 21st Digital Avionics Systems Conference, October 2002. [10] David C. Zhang. Collaborative arrival planner: Its design and analysis using object modelling. Master’s thesis, Massachusetts Institute of Technology, May 2000. [11] H. Rezberger, T.J. Davis and S. Green, De sign of center-TRACON Automated System, Proceedings of the 56th AGARD Symposium on Machine Intelligence in Air Traffic Management, Berlin Germany, 1993 pp 11-1-11-12 [12] Gail A. carpenter, Stephen Grossberg John H. Reynolds, ARTMAP: Supervised Real-Time Learning and Classification of Nonstationary Data by a Self-Organizing Neural Network
Volume 3 Number 3
Page136
www.ubicc.org