... of relaxation times T1 with and without one. REST slab for two ROIs from left and right femoral artery area. Proc. Intl. Soc. Mag. Reson. Med. 16 (2008). 2775.
Minimizing Inflow Effect in Measured Arterial Input Function for Prostate DCE-MRI Y. PANG1, M. Bernardo2,3, B. Turkbey3, G. Ravizzini3, D. Thomasson4, and P. Choyke3 Philips Medical Systems, Bethesda, MD, United States, 2SAIC-Frederick, Frederick, MD, United States, 3Molecular Imaging Program, National Cancer Institute, Bethesda, MD, United States, 4National Institutes of Health, Clinical Center, Bethesda, MD, United States
1
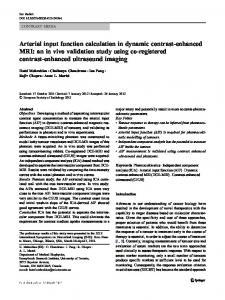
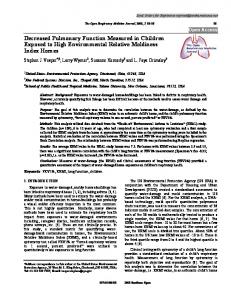
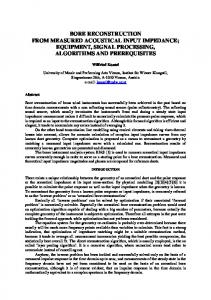
Introduction Analysis of T1-weighted dynamic contrast enhanced MRI (DCE-MRI) data based on the pharmacokinetic model (Generalized Kinetic Model, GKM) could provide key diagnostic information about prostate tissue perfusion1. In order to derive meaningful pharmacokinetic parameters, it is indispensable to know an accurate arterial input function (AIF) which represents the delivery of intravascular tracer to the tissue of interests. In practice, AIF is normally taken from either right or left femoral artery areas within imaging planes. However, due to the limited scan volume coverage, none polarized blood from outside imaging volume will flow through the imaging planes resulting in apparent decreased longitudinal relaxation times T1 and thus leading to an overestimation of AIF. In this work, we propose to apply an additional RF pulse to extend the imaging volume coverage for reducing this blood inflow effect. Methods & Materials All measurements for four patients were performed on a 3 Tesla Philips Intera whole body MRI scanner (Philips Medical System, Best, NL) with combined SENSE cardiac coil and an endorectal coil (Medrad, Indianola, PA). After a digital rectal examination, the endorectal coil was inserted and then inflated with a fluorinated liquid to a volume of approximately 50 ml. Based on a dual-flip-angle approach for T1 mapping, a 3D T1W fast field echo (FFE) protocol was used for acquisition with flip angles of 5º and 15º, respectively. To reduce the blood inflow effect, a pre-polarized pulse (REST slab of 80 mm wide) with the same flip angles (5º/15º) was applied before each acquisition (see Figure 1, Panel A for scan planning). Other relevant acquisition parameters were TR/TE of 8.8/2.0 ms, FOV of 262, 262 and 60 mm along anterior-posterior (AP), right-left (RL) and foot-head (FH) directions and corresponding digital scan resolution of 1.02*1.02*6 mm^3, and the number of scan average (NSA) was 10 and 2 for two flip angles while the latter is collected in dynamic mode with 5 dynamic scans. For comparison, these dual-flip-angle scans were repeated without applying the REST slab. Finally, a low resolution (1.8*1.8*6 mm^3) B1 map was generated for one central image slice using 3D T1W FFE based on dual TR (50/250 ms) technique, with TE of 1.26 ms and flip angle of 60º. All image data were analyzed and visualized using in-house written IDL (ITT Visual Information Solutions, Boulder, CO) packages. Results & Discussion As shown in Panel D of Figure 1 for one patient’s measurement, T1 relaxation times (red square) measured from right (upper panel) and left (lower panel) femoral artery areas (red circles in Panel B), are systematically shortened along FH direction (slice number from 1 to 10). This phenomenon is becoming more pronounced for imaging slices further away from feet because of fresh/none-polarized blood flowing downstream. With an additional RF pulse (REST slab) being applied, before entering the imaging volume, the spins in blood are equally pre-polarized so that they could not bring any new net magnetizations to the target volume. T1 values (blue diamond) measured using this REST slab show much less variation across imaging slices and are much more closer to the published data (~1660 ms) 2, suggesting that the unwelcome blood inflow effect is largely reduced. These are some unexpected discrepancies in T1 values measured from right and left femoral artery areas, which could be accounted for primarily with the variations of spatial B1 field homogeneities across the field of view. B1 fields in the right femoral artery area are always lower than those in the left, and these differences could be as large as 25% in our cases. In Panel C, the means of Table 1. Comparison of relaxation times T1 with and without one relative B1 fields within ROIs (red circles) for three patients’ measurements are REST slab for two ROIs from left and right femoral artery area. labeled, which resonances with those recent findings reported for breast imaging at Left ROI Righr ROI 3 the same field (3T) . Fortunately, B1 fields around prostate area and left femoral REST No REST REST No REST T1(ms) SD(%) T1(ms) SD(%) T1(ms) SD(%) T1(ms) SD(%) arterial area are very similar (0.95 vs. 0.94), which justifies the measuring of AIF 7 391 32 582 10 194 26 from the left femoral artery. In Table 1, T1 relaxation times from four patients are Patient A 1212 608 32 771 12 269 35 tabulated showing dramatic changes in average T1 values before and after applying Patient B 1925 17 Patient C 1610 42 493 43 380 31 117 48 REST slab on either left side ROI (574+/38% vs. 1709+/- 21%) or right side ROI Patient D 2088 21 805 45 793 11 241 29 (205+/34% vs. 631+/- 16%). There exist noticeable variations among T1 mean values AVE 1709 21 574 38 631 16 205 34 across imaging slices using REST slab for different subjects, which could be resulted from different blood flows in femoral arteries. In conclusion, the application of an additional RF pulse above imaging targets in prostate DCE-MRI would greatly reduce the blood inflow effect, thus, giving less compromised T1 values and more accurate arterial input functions. Right Side ROI 1000 800 T1 (m s )
L
L
R
R
600
REST Slab No REST Slab
400 200
0.94
0.81
0 0
2
4
6
8
10
Slice Number
P Left Side ROI
0.95 2500
T1 (ms)
2000 1500 REST Slab
1000
No REST Slab
500 0
A
B
C
-500
0
2
4
6
Slice Number
8
10
D
Figure 1, (A) MRI scan planning with a REST slab; (B) Region of interests (ROI) containing right and left femoral arteries; (C) B1 map showing spatial variations in B1 field homogeneity for the imaging plane in Panel B, for the regions with an ideal RF pulse flip angle having relative B1 value of 1.00; (D) T1 relaxation times from the right and left ROI (red circles in Panel B) in different image slices, with and without a REST slab.
References (1). Ocak, I., et al., AJR AM J Roentgenol, 2007. 189(4): p. W192-W201. (2). Sharma, P., et al., JMRI, 2006. 23(3): p. 323-330. (3). Kuhl, C. K. et al. Radiology 2007; 244:929-930
Proc. Intl. Soc. Mag. Reson. Med. 16 (2008)
2775