an estimating equation depending entirely on a user-selected function A(5), such that A(5) = 5 gives a solution to the likelihood equations and A(5)
Ann. Inst. Statist. Math. Vol. 46, No. 4, 683-705 (1994)
MINIMUM DISPARITY ESTIMATION FOR CONTINUOUS MODELS: EFFICIENCY, DISTRIBUTIONS AND ROBUSTNESS AYANENDRANATH BASU1 AND BRUCE G. LINDSAY2
1Department of Mathematics, University of Texas at Austin, Austin, TX 78712-1082, U.S.A. 2Department of Statistics, Pennsylvania State University, University Park, PA 16802, U.S.A. (Received August 9, 1993; revised March 3, 1994)
A b s t r a c t . A general class of minimum distance estimators for continuous models called minimum disparity estimators are introduced. The conventional technique is to minimize a distance between a kernel density estimator and the model density. A new approach is introduced here in which the model and the data are smoothed with the same kernel. This makes the methods consistent and asymptotically normal independently of the value of the smoothing parameter; convergence properties of the kernel density estimate are no longer necessary. All the minimum distance estimators considered are shown to be first order efficient provided the kernel is chosen appropriately. Different minimum disparity estimators are compared based on their characterizing residual adjustment function (RAF); this function shows that the robustness features of the estimators can be explained by the shrinkage of certain residuals towards zero. The value of the second derivative of the R A F at zero, A2, provides the trade-off between efficiency and robustness. The above properties are demonstrated both by theorems and by simulations.
Key words and phrases: Disparity, Hellinger distance, Pearson residuals, MLE*, robustness, efficiency, transparent kernels.
I.
Introduction and overview
A pioneering work by Beran (1977) showed t h a t by using m i n i m u m Hellinger distance estimators one could obtain robustness properties together with first order efficiency. Further investigation of this idea came from T a m u r a and Boos (1986) and Simpson (1987, 1989). T h e present p a p e r continues this line of work, in the process extending the general m i n i m u m disparity approach of Lindsay (1994), who e x t e n d e d the range of choice b e y o n d the Hellinger distance. T h e latter work deals only with multinomial models; here we widen the technique to include continuous models, with emphasis on the multivariate normal where we show how to jointly estimate # and E robustly without loss in first order efficiency. We will refer to our estimators as the m i n i m u m disparity estimators (MDEs). 683
684
AYANENDRANATH BASU AND BRUCE G. LINDSAY
The methods described herein differ from previous work in this area in two key ways: • Unlike previous Hellinger distance approaches, our procedures are constructed in such a way that we do not require consistency or rate of convergence results for the nonparametric density estimators. However we can still obtain first order efficiency with robustness. • Additionally our construction of minimum distance procedures allows simple parametric adjustment of possible tradeoffs between efficiency and robustness features, just as one can do with tuning constants in M-estimation. However, unlike M-estimation, the minimum distance methods are first order efficient and applicable to a wide range of models, not just to location scale models. In addition, we believe our method offers some new insights into the mechanism that enable the minimum Hellinger distance estimator to be simultaneously efficient and robust. One of the most appealing features of M-estimation in the location model is that one can see directly how the method limits the impact of large observations. That is, given residuals ei = Yi - #, one solves for # in the equation ~(ei) = 0 for some function ~. Since ~(c) = e gives the sample mean (normal theory maximum likelihood estimator) as a solution, other ~-functions with y] and then letting the influence function be T'(y) = T'(S, y) = °T(Se)I~=o. I represents the indicator function. Let Vj and Vjk represent the partial derivatives with respect to ¢?y and fly, ~k and write ~tj(x,/3) = Vj lnrn}(x) and ~tjk(X,/3) = Vjk lnm}(x). Also let
u; (t, 13) =
f
k(x; t, h)~tj (x,/3)dx = Vj
t, h)dx, J in m~(x)k(x, *
MINIMUM DISPARITY ESTIMATION
Uyk(t,/3 ) =
k(x;t,h)~jk(x,/3)dx = Vjk
697
lnmZ(x)k(x,t,h)dx.
J*(/3) is the p x p matrix whose jk-th element is given by Ez[-u~k(X,/~)]; it is nonnegative definite as it is the information matrix corresponding to a random variable with pdf m*Z(x). Let s*(x) = f k(x;t, h)s(t)dt be the kernel smoothed version of s(x). Let 5*(x) = s*(x)/m*~(x) - 1. We will define J*~(/3s) to be the p x p matrix whose jk-th element is given by
/A'(5*)~tj(x,/~s)~tk(x,/3S)s*(x)dx-/A(5*)Vjkm*~s(x)dx and let v*(t,/3 ~) be the p-dimensional vector whose j - t h component is
/
9Ok(x; ,h)dx-f
90s*(x)dx
Under the above definitions, a straightforward calculation gives the following result. LEMMA 5.1. Let S(x) be the true distribution not necessarily in the model. For the minimum disparity functional T, let T(S) =/~s. Then the influence function ofT has the form T'(y) = [J*S(~s)]-lv*(y, ~ ) . If S = M~o for some/3o, then the above reduces to T'(y) = [J*(/3o)]-lu*(y,/3o). If in addition k is a transparent kernel for the family MZ then we get T'(y) = [I(flo)]-lu(y, flo), where I(fl) is the Fisher information about fl in mz. If T is the minimum disparity functional and Mz,~(x) = ( 1 - c)Mz(x)+ eI[x > y], then the bias in estimation is A T = T(Mz,~) - T(Mz) = T(MZ,~) -/3. For the estimator to be robust it is necessary that A T be small. Expanding the bias in a Taylor series we get that the first order approximation to the bias as A T = T(Mz,~ ) -/3 ~ eT'(y). For the mean parameter in the one parameter exponential family, in the transparent kernel case, the influence function of all MDEs at the model is T'(y) = ( y - #); thus predicted bias is unbounded. Yet simulation results show that for some disparities like the Hellinger distance the actual bias is much lower than the predicted bias. For the MLE* the predicted bias is exact, indicating that the actual biases for some disparities are lower than the bias of the MLE*. A second order expansion of the bias function can help explain this behavior if the second order term in the expansion is large in magnitude and opposite in sign to the first order term, thus balancing its effect. Consider the estimating equation f d(6;(x))Vm*~(x) = 0 where fl~ = T(S~) and 5*(x) = (s*/m*z~) - 1. For simplicity, we now let S be in the model and look at the case where fl is a scalar. Evaluating the second derivative of the above estimating equation at e = 0 we get the following theorem. THEOREM 5.1. Let T"(y) = ~-~2T(Mz,e)I~=o. Then for an estimating function of the type f d(5*)Vm*~(x)dx, we have
T"(y) = T'(y)
[/
(t2(x,/3)m*~(x)
]1
{fl(Y) + A2f2(y)},
698
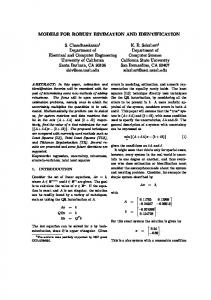
AYANENDRANATH BASU AND BRUCE G. LINDSAY Table 3. Values of f2 (y) for the normal example. Y h 0.10 0.20 0.30 0.40 0.50 0.60 0.70 0.80 0.90
2.0 43.997 17.889 9.419 5.458 3.325 2.095 1.356 0.899 0.609
2.5 146.572 64.779 37.173 23.463 15.507 10.521 7.261 5.075 3.585
3.0 606.299 277.450 163.052 104.229 69.046 46.536 31.682 21.734 15.019
3.5 3119.198 1424.326 823.770 512.146 326.917 210.925 136.914 89.400. 58.813
4.0 20274.770 9065.688 5052.851 2987.208 1794.768 1082.376 654.207 397.326 243.401
4.5 168193.646 73008.995 38780.168 21510.281 11978.329 6638.372 3668.817 2033.806 1138.232
where fl(Y) = 2Vu* (y, ~) - 2Ez[Vu*(X, ¢~)] + T'(y)Ez[V2u*(X,/3)], and f2(Y)=[u*(y, j3)]-~ [/~2(x,/3)m*~(x)dx]
- 2f
+
[f
1
f
COROLLARY 5.1. Suppose that all the conditions of Theorem 5.1 hold. Assume that the model is a one parameter exponential family, the kernel k is transparent, and/~ is the mean value parameter. Then fl(Y) is zero and T"(y) = A2T'(y)f2(y).
PROOF.
In the one parameter exponential family the transparent kernel gives
fl(Y) = C { 2 W ( y , ~) - 2 E [ W ( X , ~)] + T ' ( y ) E [ V ~ ( X ,
~)]} = C g ( y , ~).
T h e q u a n t i t y g(y, fl) has been shown to be zero in Lindsay ((1994), Corollary 4). [] In the one p a r a m e t e r exponential family, if f2 (Y) is positive and A2 is negative, the second derivative in the Taylor series a p p r o x i m a t i o n of the bias will have sign opposite to the first. For values of e where the first a n d the second order a p p r o x i m a t i o n s differ substantially, the second order a p p r o x i m a t i o n can predict a m u c h smaller bias t h a n the first. It is not obvious t h a t f2(Y) is necessarily positive for all y under a n y model. In Table 3 we present some numerical calculations for the N ( # , 1) m o d e l w i t h the t r a n s p a r e n t kernel we have used in Sections 3 a n d 4. We have d e t e r m i n e d the values of f2(Y) for several choices of h and y, using the t r u e value 0 of #. T h e following points deserve mention. First, the entries in Table 3 are all positive.
MINIMUM DISPARITY ESTIMATION
699
Secondly, the value of f2(Y) increases in magnitude as the absolute value of y grows large (making it a more surprising value). So for such values of y, the balancing effect of the second order term will be stronger. Finally, the value of f2 (Y) decreases with h, indicating stronger robustness for a small value of h. Thus for finite samples, more smoothing will mean higher efficiency and higher bias.
6. Asymptotic properties In this section we will establish important asymptotic results involving the minimum disparity estimators, namely consistency and asymptotic normality. Subscripts j, k and l will represent the partial derivatives with respect to flj, ~k and/~l. Also let 5*(x) = (s*(x) - rn*~(x))/m*~(x) be the Pearson residual corresponding to s*(x) and ,3s be the unique value of/~ which solves the minimum disparity estimating equation. Let J*(~) and J*S(/~*) be as in Section 5. Many of the proofs in this section closely follow the methods of Simpson (1987) and Lindsay (1994) and will only be briefly outlined. LEMMA 6.1.
Provided it exists, Var(f*(x)) = ~A(x), where A(x) is given by A(x) = f k2(x; t, h)s(t)dt - [s* (x)] 2.
PROOF. Note that A(x) = Var(k(x, Xi,h)). As f*(x) = n1 ~ =nl k ( x ' X i , has the form of a sample mean, the result follows. []
h)
Assume that the kernel function k is bounded. That is, assume k(x; t, h) < N(h), with N(h) < ~ , where N(h) may depends on h, but not on x or t. From Lemma 6.1 it follows that A(x) < N(h)s*(x). LEMMA 6.2.
nl/4(f*U2(x)
- 8"1/2(x))
---+ 0
with probability 1 if A(x) < oo.
PROOF. Using the central limit theorem we get n l / 4 ( f * ( x ) -- 8 * ( X ) ) --+ O. The result then follows by looking at a Taylor series expansion of the above. [] DEFINITION. The residual adjustment function A(5*) will be called regular, if it is twice differentiable and A'(5*) and A"(5*)(1 + 5") are bounded on [-1, c~). In the following proofs it will be easier to use the Hellinger residuals rather than the Pearson residuals. We define the Hellinger residual A* as A*
f.1/2 --
m'l~ 2
1.
The Hellinger residual A~ is obtained by replacing f* by s* in A*. Let Yn(x) = hi/2 (Z~*(x) - As*(x)) 2. LEMMA 6.3.
For any k E [0, 2]
700
AYANENDRANATH BASU AND BRUCE G. LINDSAY (i) E[Y~] < E[15* - 5*l]kn k/2