Missing Data in Interactive High-Dimensional Data ... - CiteSeerX
Recommend Documents
Keywords: Missing values, imputation of missing values, data visualiza- ... Many data analysts have encountered a serious obstacle as they tried to use.
available in the major statistical software, offering the chance to 'do the right thing' to .... case), the cases are de
Fernando Ruiz: About a prompt strategy for estimating missing data in long time
series. Rev. Acad. Colomb. Cienc. 26(100): 411-418, 2002. ISSN 0370-3908.
There can be many such reasons for nonresponse. ... Do not attempt to control for non response error. ..... Missing data known or unknown: Proceed to next step.
forms of interactive data mining, roles, requirements, as well as complex- ities of interactive data mining systems are discussed in this paper. 1 Introduction.
domain we increasingly encounter the problem of missing data within that ... In this paper we present an approach that allows us to recover missing values in.
A COMPARISON OF TWO STRATEGIES FOR ASR IN ADDITIVE NOISE : MISSING. DATA AND SPECTRAL SUBTRACTION. Christopher Kermorvant and ...
distribution of Xi given the evidence eâusing some standard propagation algorithm (Pearl,. 1988; Castillo, Gutierrez, & Hadi, 1997)âand then to select the ...
ABSTRACT. Unlike for other types of cancers, there are no tests suit- able for mass screening that will reliably detect cases of ovarian cancer. The most ...
Index Termsâ Compressive Sensing, Missing Data Tech- niques, Noise ... tially when speech is corrupted by background noise not seen during training. ..... While theoretical guarantees for successful recovery of x given a matrix WA do exist ...
Abstract We review a number of issues regarding missing data treatments for intervention and prevention researchers. Many of the common missing data ...
We require that the referent object has no missing data. The two adapted rough set approaches boil down to the original approaches when there are no missing ...
Applied Multiple Regression/Correlation Analysis for the Behavioral Sciences, by
Jacob and Patricia ... 12, the entire MI manual is available as a PDF file.
conclude with a brief discussion of issues surrounding this particular analysis. Missing Data. Methods for Treatment of Missing Data. The intent of any analysis is ...
1 School of Information Technology, Charles Sturt University, Bathurst,. NSW 2795, Australia. [email protected]. 2 School of Social Sciences and Liberal ...
our Smart Aggregation approach in a visual analytics system called VIAssist (Visual Assistant for Information Assurance. Analysis) to facilitate exploration, ...
FROM MISSING DATA TO MAYBE USEFUL DATA: SOFT ..... negative spectral features, where each feature may or may not be dominated by additive noise. Let.
Cite this paper as: Lachiheb O., Gouider M.S. (2014) Adapting Aerial Root Classifier Missing Data Processor in Data Stream Decision Tree Classification. In: Ait ...
been achieved in the area of HR analytics. All ... The good of the analytics story produces ..... technology and consulting firm helping firms grow and innovate by ...
Sep 9, 1999 - Michael Cox. MRJ/NASA Ames Research Center. 1 Introduction. We first distinguish the problem of big data collections from that of big data ...
Aug 17, 1995 - hierarchical data structure for structured grids and an original ... we focus our attention on the isosurfacing algorithm, comparing ... Historically, a common method for interactively visualizing large volume data sets has been .... u
Jun 14, 2007 - Tool to facilitate activities related to interactive data anal- ysis. During data ... easily be integrated into other existing visual exploration tools. 2.
Sep 9, 1999 - 2 Important differences among big data applications ... look at some differences between visualization (and data analysis) applications because.
Missing Data in Interactive High-Dimensional Data ... - CiteSeerX
Keywords: Missing values, imputation of missing values, data visualiza- tion, statistical graphics, interactive graphics, dynamic graphics, linked views, brushing ...
Missing Data in Interactive High-Dimensional Data Visualization Deborah F. Swayne 1, Andreas Buja 2 1 Bellcore, 445 South Street, Room 2L-331, Box 1910, Morristown, NJ 07962-1910; [email protected] 2AT&T Labs, Room 2C-261, 600 Mountain Avenue, Murray Hill, NJ 07974-0636; [email protected], http://www.research.att.com/~andreas/ Summary We describe techniques for the interactive exploratory analysis of multivariate data with missing values. The approach is to 1) provide trivial imputations such as xed values, 2) accept multiple imputations computed elsewhere, and 3) provide a means for keeping track of the location of missing values in the data. The techniques have two major uses: First, they support the exploration of missing values, their correlations across variables and their associations with the variables of interest. Second, the techniques support the investigation and comparison of precomputed imputation schemes; in particular, they can be used to informally diagnose the adequacy of imputations. The techniques are illustrated with an implementation in the XGobi software. Keywords: Missing values, imputation of missing values, data visualization, statistical graphics, interactive graphics, dynamic graphics, linked views, brushing, data rotations, grand tours, projection pursuit, parallel coordinate displays.
2
1 Introduction Many data analysts have encountered a serious obstacle as they tried to use contemporary interactive dynamic graphics software, because such software usually makes no special provision for missing data. An exception is the work of Unwin et al. (1996) discussed in section 2 below. For many data analysts, particularly in the eld of biostatistics, a data set without missing values is a rarity. Furthermore, if the software doesn't usefully handle missing values, it certainly doesn't o er any help in investigating the questions speci cally raised by the presence of missing data: How are the missing values distributed? Do the missing values a ect our ability to infer structure among the variables of interest?
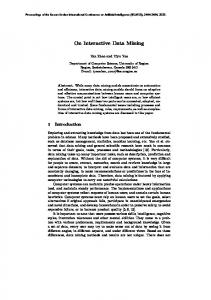
Figure 1: An XGobi window containing a displaying a scatterplot. Each plotted variable has missing values which have been replaced with a xed imputed value at 20% below the variable range. The missing values for the horizontally plotted variable, AlkPhos, show up as points along a vertical line to the left of the main scatter; those for Albumin lie along a horizontal line below the scatter.
The simplest solution to cleaning up data with missing values for visualization is to remove all the incomplete cases. This is often not an option: Little is left to analyze when a majority or a critical subset of the data is incomplete. In addition, leaving out even small sets of missing can introduce
3 unacceptable bias when the presence of missing values is correlated with the variables of interest. When dropping cases with missing values is not an option, analysts are likely to use some sort of imputation method, both for graphical and formal analysis. In the simplest case, when using scatterplots, analysts may impute some xed value purely as a graphical aid; for example, they may set each missing value to 20% below each variable's minimum. This approach allows pairwise scatterplots to be viewed without loss of information. As shown in gure 1, missing values in the horizontal or vertical variable are represented as points lying along a vertical or horizontal line, respectively. In such displays, it is possible to make e ective use of many interactive techniques, such as linked brushing and linked identi cation. Techniques that do not work well, however, include projections of three or more variables, as in 3-D data rotations. In the latter, xed values map the data with missing values onto artifactual 2-planes in 3-space, which obscure each other and the main point cloud. When using more sophisticated model-based imputations, the analyst avoids the artifacts caused by imputation of xed values. Two problems arise, however: 1) One loses track of the location of the missing values in the data, and 2) one is exposed to potentially inadequate imputations. As a general solution to such problems, we propose that data visualization systems 1) provide trivial imputations such as xed values, 2) accept multiple imputations computed elsewhere, and 3) provide a means for keeping track of the location of missing values in the data. These three capabilities open up much of the toolbox of interactive data visualization to data with missing values, both for examining missing value patterns and diagnosing imputations of missing values. We will exemplify these capabilities with an implementation in the XGobi system.
2 Comparison of XGobi with MANET In data visualization there has been a dearth of attention to the problems caused by missing values. The leading exception to this general trend is the work of Unwin et al. (1996), in particular the MANET system described therein. A comparison of MANET and XGobi is therefore of interest, in particular a comparison of their missing value features. MANET and XGobi are strikingly di erent in design and intended data applications: MANET is written for the Macintosh environment, XGobi for the Unix/X11 environment; MANET is strongest for discrete data, XGobi for continuous data. The di erent strengths would suggest that the two systems should really be married; unfortunately, the di erent environments preclude this vision. MANET provides a variety of linked views, such as scatterplots of pairs
4 of variables, boxplots, histograms, bar charts, mosaic plots, and geographic maps. These views are augmented with representations of data with missing values. For example, histograms will show an additional bar representing the frequency of missing values in the chosen variable; scatterplots will show dot plots below and to the left of the main plot, representing data with one value missing in the two variables. By comparison, XGobi is designed as a projection engine for viewing point clouds, curves, wire meshes and discrete graphs in arbitrarily high dimensions by means of 2-D projection views. Lately, XGobi has acquired two kinds of auxiliary views: parallel coordinate displays and textual displays of case label lists. XGobi's views preserve the identity of individual cases (at least in principle). Views are linked for color brushing of points and lines as well as glyph brushing and labeling of points. XGobi handles missing values in a way that is consistent with the idea of projecting high-dimensional points: It uses imputations to turn cases with missing values into valid points in high-dimensional space, but it keeps track of the locations of imputed values.
3 Exploratory graphical methods for missing data To start, we need to state the obvious: The information about the location of missing values is itself multivariate | di erent cases have missing values in di erent sets of variables. It is therefore necessary to think of the missing value information as a shadow dataset of the same dimensionality as the main dataset, but consisting of binary indicators of \missingness" of data values. This may amount to a binary data matrix of zeros and ones where ones indicate missing values. We call this matrix the \missing value shadow".
3.1 Two windows: recorded data and \missingness" data
In order to explore the data and their missing value shadow, it is natural to display each in a separate window. In the main window, we show the data with missing values replaced by some xed or imputed values. In the shadow window, we show our binary indicators. Although it may seem unnatural, we like to display binary data in scatterplots because scatterplots preserve case identity in a natural way; by contrast, histograms and other aggregating presentations visualize groups rather than individual cases. When using scatterplots to present binary data, it is natural to spread the points so as to avoid multiple overplotting. We achieve this by adding small random numbers to the zeros and ones. The result is a plot like the rightmost plot in gure 2. The data fall into four square clusters, indicating presence and \missingness" of values for the two selected variables: For instance, the top right cluster consists of the cases for which both variables have missing values, and the
5 lower right cluster shows the cases for which the horizontal variable value is missing but the vertical variable value is present.
Figure 2: Two linked XGobi windows. The leftmost window shows a view of the data: a jittered dotplot of Sex. The rightmost window contains a jittered scatterplot of the missing value indicators for two other variables, Albumin vs. AlkPhos. We are brushing the square cluster representing cases for which both variables have missing values (high levels of both missing value indicators). We note that those cases represent only male subjects (low level of Sex).
Shadow plots of missing value indicators give us a quick appreciation of various patterns: 1) The number of missing values for each variable can be visually examined by cycling through a series of single variable plots. 2) Correlations of missing values for pairs of variables can be found by cycling through pairwise variable plots. 3) Associations of missing values for three variables at a time can be examined with 3-D rotations; in this case, one sees eight clusters centered at the vertices of a cube. In 3-D, each of the four clusters in a two-variable plot divides into two, indicating cases where the third variable is present or missing, respectively. | Observe the following: All four possible missing value patterns (00, 01, 10, 11) in two variables can be interpreted as forming the vertices of a square; similarly all eight missing value patterns (000, 001, 010, 011, 100, 101, 110, 111) can be interpreted as forming the vertices of a cube in 3-space. The adventurous data analyst
6 may want to interpret the sixteen missing value patterns in four variables as vertices of a 4-cube in 4-space... Figure 3 shows an example.
3.2 Linking the recorded data and the \missingness" data
The next important question in an exploration of data with missing values is whether there are associations between missing values and variables in the dataset. Here the preservation of case identity, which was mentioned above, becomes critical. Recall that we have been talking about two windows: One displays the data, with missing values replaced by xed or imputed values; the other displays the binary indicators of \missingness," with plotted points spread for better viewing. In our approach, these two windows are linked across cases, where each case is represented by a point in each window. When we brush a point in one window, thereby changing its color or plotting symbol, the corresponding point in the other window responds in the same way. If we query a point in one window to display its case label (or more generally, to retrieve its case record), the associated point in the next window responds identically. This linking of windows depends on case identity being preserved in the same manner in both plots. The ability to link these two plots across cases allows us to explore the association between missing values and the variables of interest. For example, we might nd that cases with missing values on the variables X and Y tend to have high values on the variables U and V . This fact (if present) could be found by brushing the cases with missing values on X and Y in the shadow window, and searching the pairwise scatterplots in the main window. In the example shown in gure 2, we can see that cases for which both AlkPhos and Albumin have missing values represent exclusively male subjects.
3.3 Graphical exploration of imputation methods
The investigation of imputation schemes is supported by interactive selection from sets of precomputed imputations. We can compare imputations by selecting rst one scheme and then another from a menu of possibilities. To compare imputation schemes side by side, more windows could be used, all of which could then be linked across cases. Using rapid variable selection, the viewer can examine these imputations in large numbers of views. As a result, the viewer acquires an intuitive sense of the adequacy of the imputations, or the comparative merits if more than one imputation scheme was used.
7
4 How it works in the XGobi software The techniques described in the previous section have been implemented in the XGobi software (Swayne, Cook and Buja 1996, Buja, Cook and Swayne 1996), and this section brie y describes the data les and user interactions used in the implementation. First consider the case in which no missing values have been imputed. The missing values are represented in the input data le as \na" or \NA". The XGobi software reads the data le, initially assigning some arbitrary xed value to each missing data item. A couple of very simple assignments or imputations can then be performed using the software | the assignment of some xed value or a value that is some percentage above the variable maximum; single imputation or single imputation that takes account of current brushing groups. For the random imputation schemes, each click of a button generates a new set of imputed points, so that the imputed points are easily visible. The user can now click a button to launch a second XGobi process, which will display the missing value window: zeros (present) and ones (missing), randomly spread for better viewing. The degree of spread can be controlled with a scrollbar, and new random spreads can be readily recomputed as well. Now linked brushing is used to explore the structure of the missing data: As described in the previous section, we brush the missings in the missing value XGobi window and see where they lie in the XGobi window displaying the data. In the example in gure 2, we are brushing the cluster representing cases for which both variables have missing values, and we note that those cases represent only male subjects. If a set of imputed values has been calculated, they can certainly be used. It is still useful to distinguish between the recorded and imputed data. To use this approach, the missing entries in the data matrix are populated with the imputed values; a second le is created which contains nothing but zeros and ones. In this case, linked brushing can still be used to explore the structure of the missing data, and the rest of the graphical analysis can proceed exactly as if all the data were present. This approach can also be used with censored data. In that case, the censored values would remain unaltered in the original data le, and the missing values le would consist of ones for censored values and zeros for uncensored values. To investigate and compare imputation schemes, two additional data les are used: the rst contains all the imputed values, one set after the other. The second le contains the names to be used to label the imputation methods. Now when an imputationscheme is selected from a menu in the XGobi process containing the data, the missing values are replaced with the imputed values determined by the chosen scheme.
8
5 Discussion A major goal implicit in this work has been to make data with missing values accessible to existing powerful methods of interactive data visualization. These methods include linked brushing and identi cation in multiple views, and scaling, panning and data rotations in single views. In this paper we documented potential uses of linked brushing (as in gure 2) to explore missing value patterns and associations between missing values and the variables of interest. Other interactive data visualization methods can be equally useful and apply immediately in this approach. We hope to have provided a useful adjunct to traditional methodology for missing value problems. We expect it to be quite useful for data exploration as well as for imputation diagnostics. The XGobi software is freely available from StatLib at this URL: http://lib.stat.cmu.edu/general/XGobi/ For more references on XGobi, visit the following (identical) web pages: http://www.public.iastate.edu/~dicook/xgobi.html http://www.research.att.com/~andreas/xgobi.html
References [1] Buja, A., Cook, D., and Swayne, D. F. (1996), \Interactive HighDimensional Data Visualization," Journal of Computational and Graphical Statistics, 5, pp. 78{99. [2] Cestnik, G., Konenenko, I., and Bratko, I. (1987), \Assistant-86: A knowledge-elicitation tool for sophisticated users," in I. Bratko and Lavrac, N. (eds.), \Progress in Machine Learning," 31-45, Sigma Press. [3] Diaconis, P., and Efron, B. (1983), \Computer-intensive methods in statistics," Scienti c American, Volume 248. [4] Swayne, D. F., Cook, D., and Buja, A. (1996), \XGobi: Interactive dynamic data visualization in the X Window system," Technical report, Bellcore, Iowa State University, and AT&T Labs, submitted. [5] Swayne, D. F. and Cook, D. (1990), \XGobi: A Dynamic Graphics Program Implemented in X with a Link to S," in Proceedings of the 22nd Symposium on the Interface, Springer/Verlag. [6] Unwin, A. R., Hawkins, G., Hofmann, H., and Siegl, B. (1996), \Interactive Graphics for Data Sets with Missing Values { MANET," Journal of Computational and Graphical Statistics, 5, pp 113{122.