Model-Based Predictive Control of a Circulating Fluidized Bed Combustor
Vladimír Havlena1,2, Daniel Pachner1 1
Honeywell ACS Advanced Technology Laboratory
V Parku 2326/18, 148 00 Prague 4, Czech Republic 2
Faculty of Electrical Engineering
Czech Technical University in Prague Technická 2, 160 00 Prague 6, Czech Republic
[email protected],
[email protected]
Abstract This chapter will present a novel multivariable advanced control strategy for Circulating Fluidized Bed (CFB) boilers that was implemented at the Sinopec Principal Power Plant of Shanghai Petrochemical Company, P.R. China. The objective of the advanced control and optimization project was to improve stability of key process variables, effectiveness of limestone use and boiler combustion efficiency under emissions limits. The plant operates two Foster–Wheeler CFB boilers burning mixture of coal and coke with nominal steam production 310 t/h. The CFB boilers were operated with a standard PID control strategy in a Distributed Control System (DCS). As the fluidized bed combustion shows strong interactions between process variables standard PID control did not fully meet operational requirements. A multivariable Model based Predictive Control (MPC) was designed and installed. The MPC strategy is based on a state-space model with nonlinear state estimator used as an inferential sensor of accumulated char and lime inventory in the bed and a linear time varying model parameterized by the bed char inventory. The first-principles based model resulting from a lumped macroscopic description of the coal particle burning and disintegration in the bed was validated using experimental data. The bed temperature was originally manually kept between 860 — 900 °C by operators. Now it is automatically maintained with standard deviation of less than 1 °C at a given reference value, optimal for SO2 emissions removal. The SO2 emissions, originally only monitored, are now controlled with standard deviation less than 25 mg/m3. Reduced variability of main process variables is a prerequisite for further optimization of boiler thermal efficiency, fuel and limestone consumption and plant dynamic responsiveness. The operational improvements were achieved by advanced control tools without any boiler hardware refurbishment.
1
1. Introduction Fluidized bed combustors burn solid fuels in a turbulent mixture of gases, fuel particles and inert particles suspended in a strong stream of primary air. There are two main reasons for the introduction of fluidized bed combustion technology – the ability of the fluidized bed to use a variety of fuels including fuels difficult to burn using other technologies, and the possibility of achieving lower emission levels. For nitric oxides, fluidized bed combustion can achieve combustion temperatures below the threshold of nitrogen oxides forming, which is approximately at 1400 ºC [1]. For sulphur oxides, the flue gases can be in effective contact with sulphur absorbents such as calcium dioxide produced by limestone calcination in the bed. This desulphurization mechanism can capture more than 95% of the SOx formed. As a result, the fluidized bed combustion technology can be successfully used with low quality coals, turfs, and biomass [6]. In the following text, development and pilot application of advanced model based predictive control strategy will be presented. The MPC control strategy is based on a state-space model with a nonlinear state estimator used as an inferential sensor of accumulated char and lime inventory in the bed and a linear time varying model parameterized by the bed char inventory. The first-principles based model results from a lumped macroscopic description of the coal particle burning and disintegration in the bed and was validated using experimental data. The pilot customer where the advanced control strategy was validated was SINOPEC Shanghai Petrochemical Co. Ltd. (SPC) located in the Jinshan District of Shanghai, People’s Republic of China. SPC Principal Power Plant operates multiple pulverized coal boilers and circulating fluidized bed (CFB) boilers to produce high pressure steam, to generate electric power, and to provide the middle and low pressure steam for the refinery process. Currently, three CFB boilers are in operation: Unit 5 consists of two CFB Foster-Wheeler boilers producing each 310 tons per hour of superheated steam at 9.4 MPa, 540 ºC into the common steam header, one 100 MW e steam turbine with two steam extractions and a condensing stage, and two steam let-down stations. Unit 6 consists of a CFB 600 tons-perhour boiler and a 100 MW e steam turbine. The boilers burn mixture of coal and petroleum coke, lime is dosed into the fluidized bed to reduce the sulfur oxide emissions. Honeywell TPS distributed control system is used for the regulatory control. Both CFB boilers of Unit 5 have been subject to the described closed-loop advanced control and real-time optimization project. The details on the project can be found in [2]. This chapter will concentrate on the advanced control of the CFB combustion process only.
2
2. The process to be controlled The circulating fluidized bed (CFB) combustor shown in Figure 1 represents the most sophisticated atmospheric fluidized bed based combustion technology. The retention of ashes in the cyclone and its reinjection to the bed lead to low loss of unburned fuel particles and efficient limestone utilization. However, the principles as well as the main characteristics of the combustion process discussed below are similar to other fluidized bed boiler types. Thus, the approach described is not limited to the CFB boilers.
Cyclone Secondary air Lime Bed Fuel Flue gas Ash removal Primary air
Figure 1: CFB boiler schematics.
The key variables affecting the combustion process are fuel delivered to the bed, limestone delivered to the bed, primary air used for fluidization and secondary air distributed above the bed level and the bed material removed from the bed. The measurements used for control are drum pressure, feed water and steam flow, bed differential pressure and temperature and flue gas analysis (O2, CO, SOx and NOx concentrations). The CFB boiler dynamics contains strong cross interactions between the controlled and measured variables. Hence the Multiple Input – Multiple Output (MIMO) model is necessary for a successful control. Moreover, the dynamic response of the model is significantly different in individual operation regimes - quoting Bittanti [3], “Fluidized beds are remarkably difficult to model, since the process is characterized by a series of complex thermal and mechanical interactions”. In spite of these facts, it is possible to develop a relatively simple control oriented model of fluidized bed boiler. The original CFB control strategy was based on allocation of individual controlled variables (CVs) and manipulated variables (MVs) to a set of single loop PID controllers as depicted in Figure 2 below (only the major loops are included). Note that besides the DCS control loops pairing (depicted by “C”), there is a significant number of strong (“S”) and minor (”M”) interactions. Due to significant interactions and complex dynamics, the performance of the PID control was limited and some loops were frequently operated in manual mode. The objective of the supervisory control layer, typically implemented using the model based predictive control technology, is to provide coordinated control of individual loops to reduce the variability of individual CVs and decouple the interactions. However, the previous applications of model-based predictive control technology for CFB boilers were not fully successful because of difficulty to get a consistent set of models – the results of individual step testing experiments used to estimate a black-box input-output model for predictive controller tuning were significantly different. In the following sections, we will 3
clarify the reasons and present a novel modeling and control strategy, based on the concept of bed fuel inventory (BFI) and bed lime inventory (BLI).
cv1 VARIABLE mv1
cv2
Steam Bed pressure temperature
Fuel feed flow
cv4
S
M
M
C
S
S
Primary air flow
S
mv3
Secondary air flow
M
mv4
Limestone feed flow
M
mv5
Ash removal flow
M
cv5
SO2 in flue gas Bed pressure
C
mv2
mv6
cv3 Oxygen in flue gas
M
C C
cv6
cv7
Chamber pressure
cv8
Drum Steam level temperature
M
S/M
S/M
S
S/M
S
S
S/M
S
M C C
Flue gas flow
mv7
Feed water flow
M
mv8
Spray water flow
M
C
dv1
Steam flow
S
S/M
C S M
C
DCS Control loop pairing Strong interaction Minor interaction
Figure 2: Interaction of major MVs, CVs and DVs in CFB boiler combustion control and selected variables for 4x4 MIMO controller configuration (grey box)
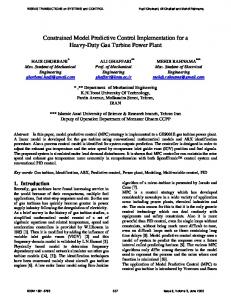
The PID control system performance also degrades with significant fuel quality changes. The model based control presented contains parameters that can be directly interpreted as the fuel properties (mainly its heating value). The model can adapt even to substantial changes of the heating value based on the estimated amount of heat released by the combustion process. The approach based on released heat estimation was verified in practice on a boiler burning a mixture of coal and coke with a varying ratio. This feature is also important for the multi-fuel boilers, e.g. renewable bio fuel (wooden chips) co-firing. 2.1. Understanding the CFB combustion process Classical boiler control strategy depicted in Figure 2 is based on the master pressure controller loop using fuel as the primary manipulated variable to control the outlet steam pressure (in the specific case described in this chapter, there are two boilers operating to a common steam header, see Section 3.2), and oxygen trim using air/fuel ratio to control the combustion quality and oxygen content in the flue gas. When applied to CFB boiler control, the response of the steam generation to a fuel step change is significantly slower than e.g. with pulverized coal fired boilers – see Figure 3 below (note the 3 hours time scale of the trend depicted). On the contrary, the response of steam generation to primary air step change is almost immediate, with derivative character (i.e. zero steady state gain) – see Figure 4. Note also the inverse response transient of oxygen in the flue gas – after the step increase of primary air flow, O2 level is decreased (more intensive firing rate of the accumulated char consumes more oxygen); however, it has a positive gain in the steady state (with firing rate recovered to its original level, additional primary air results in increased O2 level).
4
Figure 3: Response of key variables to fuel flow step change
Figure 4: Response of key variables to primary air flow step change
These two responses are crucial for understanding the circulating fluidized bed dynamics. In spite of a very complex nature of fluidized bed combustion process, the explanation is very intuitive: the heat released in the bed is proportional to the product of accumulated char in the bed – referred to as bed fuel inventory (BFI) in the following text – and the primary air flow available for combustion. For the given amount of fuel flow and primary air flow, dynamic equilibrium level of BFI is achieved after some time. This time may be quite significant, e.g. the standard of the American Society of Mechanical Engineers (ASME) for unit performance testing recommends for fluidized bed units 24 - 48 hours pretest stabilization period to establish thermal, chemical and circulating material size equilibrium at the test conditions (compared to 1 hour stabilization period recommended for pulverized coal and gas/oil fired units). While the step change in fuel feed rate results in a slow change of the BFI accumulated in the bed and resulting change of released heat corresponding the new BFI level (Figure 3), 5
the step change in primary air results in an immediate increase of released heat, but is limited to the period of depletion of BFI until a new equilibrium is achieved (Figure 4). The released heat is closely related to O2 in the flue gas – during the period of increased released heat, more primary air is consumed in the bed, resulting in reduced O2 in the flue gas, while the consumption of primary air is reduced to the original level after the BFI depletion, resulting in increased steady state O2 level. These observation and understanding of the driving forces of CFB dynamics create a basis for a new control strategy that uses primary air to control the released heat in the bed, and fuel supply to stabilize the BFI. The model is nonlinear and can provide a very good fit to experimental data as depicted in Figure 5. Exhaust oxygen fraction
Steam power
4.2 boiler data model
4
210 205
3.6 [MW]
O2 [% mol]
3.8
3.4
200 195
3.2 3
190
2.8 185
2.6 0
1
2
3 4 time [h]
5
6
0
1
2
3 4 time [h]
5
6
Figure 5: Real (dashed) vs. simulated (solid) O2 and released heat trends
The knowledge of BFI has a significant role to “parameterize” the dynamic response of the released heat and oxygen in the flue gas to a step change of primary air – see Figure 6. This explains the problems with “inconsistent models” – as the BFI is not directly measurable, it was difficult to explain this behavior. However, BFI can be estimated using state observer using Kalman filtering technology provided the dynamic state-space model is available. A more generic lesson learned from this application is that for processes with significant accumulation phenomena, state space approach is a must. Model predictive control using the input output models do not capture the effect of accumulation and do not provide sufficient prediction accuracy – while the estimated accumulation level provided by the state observer can fully explain the variability in step responses. Another significant result from CFB modeling effort is the observation that the bed temperature is proportional to volumetric heat release, which is strongly correlated with BFI and may exhibit quite complex behavior related to primary air to BFI ratio as depicted in Figure 7. The nonlinear (and without full understanding to the BFI effect also quite complex and confusing) bed temperature behavior is the reason why single loop control strategy does not provide good performance and bed temperature is often maintained within its limits only with frequent operator interventions. In a similar way, relation between the SO2 released and captured in the bed can be described using the bed lime inventory (BLI), i.e. estimated amount of “active lime” in the bed.
6
O2 [% mol]
Exhaust oxygen fraction 4 3 2 0
0.2
0.4
more fuel accumated less fuel accumulated 0.6 0.8 1 1.2 Steam power
[MW]
200 190 180
o
[ C]
170
0
0.2
0.4 0.6 0.8 Bed temperature
1
1.2
0
0.2
0.4
1
1.2
910 900 890 880 870 0.6 0.8 time [h]
Figure 6: Response of O2, released heat, and bed temperature to primary air step for two different BFI levels. Note the difference in the initial bed temperature resulting from different initial BFI levels. Bed temperature 895 890
o
[ C]
885 880 875 boiler data model
870 0
1
2
3 4 time [h]
5
6
Figure 7: Real (dashed) vs. simulated (solid) bed temperature trends
2.2. Control oriented CFB model The concept of a “mathematical model of the CFB boiler” exhibits extreme variability in its complexity. The researchers in fluidization engineering focused on CFB boiler design develop finite element method models describing the key variables like temperature, concentrations, pressure and velocity as time-varying three-dimensional fields defined in the combustion chamber [3]. On the other hand, there exists the usual transfer matrix based approach prevalent in control engineering. The transfer functions between the key manipulated and controlled variables are obtained through plant step testing without deeper understanding the physical laws governing them. 7
For a number of reasons we have not used any of the two approaches: for a real time control application with the sampling period several seconds, the accurate finite elements method based modeling is unusable due to its complexity and computational burden implied. The empirical transfer matrix models are appealing for their simplicity; unfortunately, it is not possible to get a consistent set of step responses of the CFB boiler. The fuel accumulation, a slowly varying internal variable that cannot be measured directly, strongly affects the inputoutput relation between the manipulated and controlled variables. Hence, the input output relationship seemingly changes in time (based on the actual mass of the fuel accumulated in the bed) and it is not possible to get a unique input-output model. Physical understanding of the CFB boiler leads to the control strategy which manages the boiler power and the bed temperature using its internal state monitored by a Kalman filter based ‘inferential sensor’ [4]. As a result of the observations summarized above, a low order lumped CFB boiler model based on first principles (the mass and energy balance) was developed. Despite its simplicity, the prediction capability of the model is sufficient for modelbased predictive control – the purpose is not to model the state variables and their spatial distribution exactly, but rather to predict how the boiler will respond to the manipulated variables changes over the prediction horizon of several minutes based on the currently estimated initial state. The fuel particles present in the bed can be represented as a population of balls with various radii. The burning rate is assumed to depend on the temperature and the oxygen concentration close to the surface, i.e. it can be controlled by the primary air flow which directly affects the oxygen availability on the surfaces of the fuel particles. Whereas the instantaneous thermal power depends on the fuel surface, the thermal energy being released depends on the mass of the accumulated fuel. It is commonly denoted as bed char inventory, or bed char loading throughout the literature. The geometric properties of the fuel particles, namely the fuel granularity, define the instantaneous energy flow and its relation to the energy accumulation. As an example, finely ground fuel accumulation produces a more intense thermal power compared to the same mass accumulated in greater lumps. It is an important observation that both the fuel efficient surface and the fuel mass represent the bed internal state. The fuel ball radii distribution function approach, i.e. the statistical viewpoint, has been used to analyze the dynamic equations governing the fuel efficient surface and mass. Assuming the linear burning rate is the same for any of the balls in the population and the radii of the balls supplied to the bed have exponential distribution (probability density function) characterized by the mean radius, the mean radius is not affected by the combustion process and the surface to mass ratio remains constant in time [5]. An important consequence of this result is that the boiler internal state can be represented by accumulated fuel mass only (at least approximately), i.e. the BFI inferential sensor can estimate only the mass of the accumulated fuel. The assumption that the fuel surface is proportional to the mass was validated – at least indirectly – by a very good prediction capability of the model. The real processes to which the fuel particles are submitted after being delivered to the bed are very complex. Basu and Frazer [6] model the bed fuel particles attrition rate dynamics in detail as a function of the relative velocity of the fuel and solid particles, for example. Also, the fuel volatiles have shown negligible effect on the boiler power control which is not included in the model. Besides the accumulation, the linear burning rate is the key parameter of the combustion process. Analyzing the oxygen concentration in the flue gas, notably its response to a step change of the primary air supply, it is possible to explain how the burning rate is affected by the primary air supply rate. As depicted in Figure 4 the boiler power (burning rate in the bed) increases temporarily and the output oxygen concentration decreases at the same time after the primary air supply rate step up. In the steady state, the boiler power returns to the original value which is given by the fuel supply rate only; this fact is given by the energy conservation law (the mass of the fuel burned equals the fuel supply rate). The primary air rate cannot affect the boiler power in 8
the steady state. The oxygen step response may look paradoxical – the more primary air is supplied the less oxygen is left in the flue gas. This FBC behavior is different compared to the other combustor types like the pulverized coal firing where the inverted response effect does not occur. The inverse (non-minimum phase) response of oxygen concentration to a step in the air rate is caused by a combination of two effects. After the step up in the air supply rate the linear burning rate is increased. The observed decrease of O2 concentration in the flue gas results from increased oxidation efficiency, but does not imply reduced concentration on the fuel surface. After a while the increased burning rate reduces BFI which leads to the return of the burning rate to its original value and an increased oxygen concentration in the steady state eventually. The mathematical condition for the inverse response of the oxygen concentration expressed as a property of the thermal power Q(A), where A is the air supply rate, is the following: the ratio of released heat in the bed Q(A2)/ Q(A1) for the two air rates A2 > A1 has to be greater than the ratio of the air supply rates A2/A1. This condition on the Q(A) dependency is visualized in Figure 8. Released heat [MW] Q
[A, Q]
Primary Air [m 3/s] A0
A
Figure 8: The released heat (linear burning rate) vs. primary air flow
The simplest approximation satisfying this condition is an affine function with negative constant term. When this functional form is combined with the assumption that the boiler power is proportional to the BFI – fuel mass accumulation m(t) [kg] we get Q(t ) = Hk ( A(t ) − A0 )m(t ),
A0 > 0 ,
(1)
where Q is the released heat [MW], H is the fuel heating value [MJ/kg], k [1/Nm3] the rate constant and A(t) the primary air flow [Nm3/s]. Equation (1) is in a good agreement with the data as shown in Figure 9 and, despite its simplicity, is the key empirical approximation which allows accurate predictions of the CFB thermal power and the O2 concentration in the flue gas. The two empirical parameters A0 and k can be calculated from the O2 concentration step response directly. The experiments have shown their values are remarkably stable in time. Moreover, two boilers of the same construction exhibit the same values A0 and k. Equation (1) holds under the normal conditions. During the operation of duct oil burners, that are fired in the primary air duct before the air enters the combustion chamber, equation (1) can be used to predict the boiler response to the duct burner firing. The Q(A) function is shifted if the oxygen concentration in the air flow A is changed from 21% (vol.) to the actual concentration of O2 in the Primary Air (PA) stream entering the bed. Thus, even though some additional heat is developed by the duct burner, the overall boiler response is similar to the response to an appropriate step down in the primary air flow. The linear burning rate is abruptly decreased, the oxygen concentration in the flue gas is increased and the bed thermal power is decreased. The boiler response to the oil burner firing is rather the opposite of what could be intuitively expected but fully consistent with observed response. 9
O2 [% mol]
Exhaust oxygen fraction 4 3 2 0
boiler data model 1
0.5 Steam power
[MW]
200 180 0
0.5 1 Bed temperature
880
o
[ C]
890
870 0.5 1 Primary air flow
40
3
[Nm /s]
0
38 0
0.5
1 time [h]
Figure 9: Oxygen concentration in the flue gas and its response to primary air step change
Equation (1) predicts the boiler power for a known value of the fuel accumulation m(t). Implicitly it also defines the bed temperature. The bed temperature is correlated with the flue gas temperature. If it is assumed that the heat released by the combustion is used to increase the gas enthalpy, the flue gas temperature Tg (at bed outlet) is given as Tg (t ) = Tg 0 +
A0 Hk 1 − m(t ) , cp A(t )
(2)
where c p [MJ/Nm3/°C] is the average gas specific heat and Tg0 is the gas inlet temperature. This equation predicts the inverse step response to the primary air step changes similarly to the oxygen concentration responses. After the primary air step up, both the flue gas volume and the burning rate increase. Based on the assumption that the ratio of boiler heat powers Q(A2)/ Q(A1) is greater than the ratio of the air supply rates A2/A1 introduced above, this results in an increase of the flue gas temperature at the bed output. After a while the fuel accumulation is reduced, which leads to a decreased gas temperature. Though this inverse response effect is less visible than in the case of the oxygen response, it has actually been verified. The fact that the bed temperature decreases after the duct burner is fired is also predicted by (2) as shown in Figure 10. The bed temperature follows the Tg temperature with the time constant of order of several minutes corresponding to the heat transfer between the 10
gas and the bed material. The time constant value also depends on the temperature sensor placement.
[MW]
O2 [% mol]
Exhaust oxygen fraction 3.5 3 2.5
boiler data 1 model
0
0.5 Steam power
0
0.5 1 Bed temperature
0
0.5 1 Duct burner oil flow
225 220 215 210
900
o
[ C]
905
895
[kg/s]
0.2 0.1 0
0
0.5
1 time [h]
Figure 10: Boiler response to the duct burner oil firing compared to the model predictions.
The bed temperature model accuracy can be further improved if the heat radiation is taken into account. The primary air supplied at the bottom of the bed causes slow rich combustion process characterized by relative lack of oxygen and low temperatures. The flue gas leaving the bed contains a fraction of CO which has to be oxidized by means of the secondary air flow supplied above the bed, see Figure 1. The secondary air has to be mixed with the flue gas at still sufficiently high temperatures, i.e. immediately at the top of the bed. Denoting the primary and secondary air flows Ap, As [Nm3/s] the oxygen concentration O2 [%vol] should be O2 (t ) = 21 − α
Q(t ) , AP (t ) + AS (t )
(3)
where α [Nm3/MJ] is defined by the fuel composition. A more detailed data analysis has shown that the burning rate in the bed is also weakly affected by the secondary air flow. As a result, the air flow A in equation (1) should be calculated as a linear combination 11
A = AP + β AS ,
with typical values 0.1 ≤ β ≤ 0.2 .
(4)
To model the oxygen concentration on an accuracy level necessary for the control purposes equation (3) has been supplemented by an empirically estimated time constant modeling O2 dilution dynamics due to the gas accumulation and analyzer time delay. The key equation (1) has to be combined with the fuel conservation equation dm(t ) Q( t ) = F (t ) − , dt H
(5)
where F [kg/s] denotes the fuel supply rate and H [MJ/kg] represents the fuel heating value. Assuming two heat transfer time constants, τQ for bed to steam transfer and τB for gas to bed transfer, the final CFB equations can formally be expressed as the following transfer matrix between the manipulated inputs F(s), AP(s) and AS(s), disturbance inputs H(s) and constant bias 1/s and the four outputs Qs(s), TB(s), m(s) and total air AT(s)
Qs (s ) TB (s ) m(s ) AT (s )
F (s )
AP (s )
AS (s )
0
kmH τ Qs + 1
β kmH τ Qs + 1
Hc2 c kmH β c2kmH − 2 − s(τ B s + 1) s(τ B s + 1) s(τ B s + 1) 1 s 0
−
kmH s 1
−
β kmH s 1
H (s )
1 s
kmA0 τQs + 1
0
c2 kmA0 s(τ Bs + 1)
c1
−
kmA0 s 0
(6)
0 0
The above transfer matrix does not represent a local linearization of the nonlinear equations but rather a gain-scheduled version of the nonlinear model. To calculate the model predictions using the transfer matrix, the future trajectory of fuel accumulation m(t) is approximated by the current value m. This approximation is justified by the fact the fuel accumulation is slowly time-varying and is actively stabilized by the controller on the prediction horizon. The multiplication by m is the only nonlinearity with the exception of the bed temperature model (2), where also division by A(t) defined by (4) occurs. This nonlinearity is globally approximated by an affine function (defined by the parameters c1 and c2). Thanks to the fact the prediction model is not based on a local linearization, the control can be used in a broad range of operation without loosing its fidelity when deviating further from the point of linearization. The nonlinear oxygen concentration model (3) is not necessary for the predictive control and does not need to be included in the control model. It is evident from that equation (3) that the oxygen stabilization can be achieved stabilizing the released heat to the total air ratio [MW/Nm3]. This can be achieved by controlling the ratio of two controlled variables - the released heat Qs and the total air flow AT (the ACC controller described in Section 3.2 has the ratio control functionality). This ratio should track a set point trajectory defined by the desired excess oxygen concentration value based on (3). To add integral action to O2 control, which is necessary for zero steady state offset, the nonlinear inferential sensor estimates an additive offset term added to (3). The released heat is not directly measurable, but can be estimated indirectly. The energy conservation law for the steam/water system of the boiler yields the following equation [7] V
dHs dP (t ) = (t ) + Qs (t ) , dt dt
(7)
where P is the main steam pressure [MPa] and V is the volume of the steam system [m3]. The term Qs is the thermal power transferred to the steam system and Hs represents the steam enthalpy. The energy balance equation does not contain the energy used for the calcination, which is neglected. 12
The CFB predictive controller is based on the above linear time varying transfer matrix. Note that the gains of the transfer functions in this matrix are scaled by the fuel heating value H and the fuel accumulation m. The nonlinear estimator of these variables is necessary to provide the gain scheduling. As both fuel heating value and the fuel accumulation are slowly varying, the gains can be considered constant on the prediction horizon used for control sequence optimization (which is fifteen minutes in this application). This approach is further justified by the fact that the control system actively stabilizes the fuel accumulation on the prediction horizon. Therefore, a time invariant model with the appropriately scheduled gains can be used for model-based predictive control of the key CFB variables.
13
3. The control technique applied 3.1. Model Based Predictive Control Method The advanced combustion control for CFB is based on multivariable model-based predictive control technology. MPC has already become an industry standard in chemical and hydrocarbon processing industries and is gradually penetrating the area of power generation. The potential to improve plant performance by using multivariable, coordinated control strategies with inherent hard constraints (both on the amplitudes and the rates of change of the manipulated variables) was studied for boiler-turbine coordination as a replacement for traditional boiler/turbine follow strategies [8], [9], for steam temperature control [10], [11] and chapter [P14] of this book [20], for drum level control [12] and for combustion control and optimization [13]. The details on presented MPC package with a number of specific features designed for applications in power generation and industrial energy are given in [14] and several applications reported in [15] and [16]. The trajectories of controlled variables (CVs), disturbance variables (DVs), and manipulated variables (MVs) are expressed as sets of measured/calculated values with a given sampling period. In compliance with the selected model of process dynamic and given receding control horizon, MPC calculates/predicts the courses of CVs and MVs that are optimal with respect to given performance index. One of the extensions of the classical MPC control is the concept of range control – the setpoint is replaced by an interval of minimum and maximum acceptable value of the CV and there is no penalty provided the predicted CV trajectory is within the funnel created by the minimum and maximum CV range trajectory – see Figure 11. control horizon correction horizon
controlled variable
high limit low limit
manipulated variable
r Ts time
current time
Figure 11: Definition of the funnel of acceptable CV trajectories
This approach results in calm control with reduced high-frequency excitation of the MVs and enables better coordination of multiple interacting manipulated variables in low and midfrequency band where also the quality of the model used for prediction is satisfactory. Moreover, the set range provides additional degrees of freedom for optimization – for example, the level of accumulated char in the bed (BFI) is not controlled to a given set point – rather it is stabilized within a widely open funnel with a particular value of the BFI defined indirectly by the bed temperature control.
14
3.2. Control Strategy Applied Since the two CFB boilers produce steam to the common high pressure steam header, additional advanced control and real-time optimization components are used to improve control of the header and dynamic allocation of the overall steam demand to the boilers. The Master Pressure Controller (MPC)1 component objective is to stabilize header pressure as a controlled variable (CV) within a given set range, i.e. in the interval pMIN ≤ p ≤ pMAX, taking into account actual steam consumption as a disturbance variable (DV). Model based predictive control technology provides optimized boiler responsiveness and fully utilizes boiler storage capacity and accumulated fuel in the bed during steam demand ramping. The manipulated variable (MV) is the required trajectory of total heat developed in the boilers that is provided as a set point to the Economic Load Allocation for Boilers (ELA-B) component. The objective of ELA-B is to allocate the required trajectory of total heat developed in the boilers (provided by the Master Pressure Controller) to individual boilers [17]. Dynamic allocation is based either on target biases provided by operator (in ELA MAN mode), or calculated as optimal from the boiler incremental costs (in ELA OPT mode). ELA-B allocates the transient trajectories to achieve the required target allocation at the end of the prediction horizon. The economic allocation is a well-defined problem only in the steady state. While traditional real-time optimization (RTO) solutions typically wait until the steady state has been achieved, the predictive multivariable process control provides new possibilities for the integration of the advanced process control and real-time optimization (ELA-B) layers: estimated steady state header balance at the end of prediction horizon can be used as a target value for the computation of economic allocation, while and dynamic deviations of the transient part of the MV trajectory during the prediction period are allocated independently, proportionally to the dynamic weights set by operator. The use of predicted steady-state values of total heat demand enables RTO layer to be executed as fast as the advanced control layer and results in fast tracking of the optimal load allocation [18]. The manipulated variables of ELA-T are the required trajectories of heat developed in individual boilers that is provided as a set point to the Advanced Combustion Controller for CFB (ACC CFB) for individual boilers. The overall control strategy is depicted in Figure 12.
Figure 12: MPC/ELA-B/ACC advanced control strategy
The predictive CFB controller receives it setpoint trajectory in term of released heat demand from ELA-T and provides its manipulated variables as set point values to the regulatory level layer: master fuel controller (MV1), primary air controller (MV2) and secondary air controller
1
In this Section, the acronym MPC refers to Master Pressure Controller, not Model Predictive Control.
15
(MV3) in the DCS. For MV4 (limestone feed) the advanced control strategy provides feed forward signal (current lime consumption rate) to the SO2 controller in the DCS. The ACC advanced control strategy is depicted in the following Figure 13. ACC provides multivariable control to the variables depicted in Figure 2 – released heat, bed temperature, and flue gas O2. To achieve these objectives, ACC CFB also maintains required ratio between the total air and the released heat, stabilizes the BFI and observes disturbances (DVs) that are not directly measurable like fuel calorific value. CV 6 – O 2, CV 7 – SO 2
BFI, BLI sensor TA /RelHeat - ratio
Lime Consumption
SHIII SHII SHI
MV 3 - SA SP RelHeat
ECO
MV 1 - fuel
ACC
MV 4 - Lime MV 2 - PA
GAH
Figure 13: Advanced Combustion Control strategy
The summary of the multivariable CFB control strategy is as follows: •
The CFB boiler power is controlled via the primary air supply rate which defines the fuel linear burning rate. The primary air supply rate directly affects the burning rate of the fuel already accumulated in the bed. The dynamic response of the boiler power control is limited by the heat transfer time constant only. The boiler can increase the power significantly faster compared to its natural response to the increased fuel supply rate which is the existing practice in the CFB boiler power control.
•
The fuel supply rate is then used to stabilize the fuel accumulation. The control system can decrease the fuel accumulation temporarily in favor of the faster boiler power response. The fuel accumulation is related to the bed temperature. The control system finds the optimal accumulation to meet the bed temperature set point. To allow the control system to decrease the accumulation temporarily during an abrupt power demand step up, the bed temperature is not controlled on a target set point but to a set range. The range chosen by the operator is usually 5 or 10ºC wide, however, typical steady state bed temperature fluctuations are significantly lower (see Section 5).
•
The oxygen concentration in the flue gas is controlled by the ratio of the boiler power to the total air flow ratio according to (3). As the primary air is used for the power control primarily, the oxygen concentration is controlled by the secondary air flow mainly.
3.3. Inferential sensors The CFB control and optimization is based on a non-linear dynamic lumped-parameter model of CFB boiler bed. This model is used to update the parameters of the linear model in the ACC controller. As a number of boiler dynamic states and parameters are not measured, the inferential sensor algorithm is part of the ACC CFB solution. The inferential sensor provides synthetic metering of those unmeasured process variables which are required for the boiler response calculation. The inferential sensor implements the extended Kalman Filter (EKF) algorithm to achieve this goal. This algorithm processes the measured process 16
variables and provides additional calculated process variables that can be used by the ACC as if they were measured. The EKF algorithm estimates the unmeasured CFB boiler states and parameters producing the estimates and their likelihoods as the inferentially sensed values. The major unmeasured CFB states calculated by the inferential sensor are the BFI (Bed Fuel Inventory – the total mass of the unburned fuel in the bed m defined by equation (6)) that is used as a time varying model parameter and is also stabilized by the ACC, and the BLI (Bed Lime Inventory –the total mass of the active lime yet available for the SO2 retention). The estimated lime consumption rate is used as a feed-forward signal for the SO2 controller to minimize the bed lime inventory variation thus stabilizing the SO2 output concentration below limit and minimizing the lime consumption at the same time. In parallel, some time-varying parameters of the model are estimated – for example the instantaneous heat released within the bed. The released heat calculator uses measurable process variables – drum pressure, main steam flow and temperature and the feed-water flow and temperature to calculate the heat released in the combustion chamber that is proportional (except for the heat losses in the flue gas) to the heat Qs defined by equation (6). This value is then used to calculate the released heat tracking error. Note that with multiple boilers running in parallel, the released heat set point trajectory provided by ELA-B is followed with a prescribed dynamics τQREF. In this way, the variability in boiler dynamic response characterized by the time constant τQ in the CFB transfer function matrix (6) is compensated and all the boilers provide coordinated dynamic response to the load demand. The other estimated parameters are the gain of the primary air flow to released heat k in (6) and the bias in the oxygen equation (3).
17
4. Application
The advanced control solution implemented in Jinshan power plant consists of multiple advanced control and real-time optimization solution components: Master Pressure Controller (MPC), Economic Load Allocation for Boilers (ELA-B), Advanced Temperature Control (ATC), and Advanced Combustion Control (ACC). The advanced control and realtime optimization layer is running on a Personal Computer (PC) node with the solution components hosted in a flexible real-time execution environment Unified Real Time (URT) [19]. The main interfaces / communication links used by the solution components are: •
Components communicate with the DCS via OPC protocol
•
Individual components are implemented in the URT execution environment and communicate directly using COM standard. Optionally, the platform can be distributed over multiple computers, in which case the components communicate via OPC;
•
The Graphical User Interface (GUI) for engineers (configuration, tuning, control performance monitoring) communicate via OPC;
•
The GUI for operators (standard operations) is fully integrated into the boiler regulatory control schematics in operator station of the DCS. The communication is handled by the standard DCS protocol via the advanced application node of the DCS.
Overview scheme of the solution architecture in depicted in Figure 14 below. All basic regulatory control resides in the Honeywell TPWS (“TotalPlant” Solution) DCS system (below the dashed line). The advanced control and optimization components for both CFB boilers (5A and 5B) run in the common dedicated Application Node (APP node). The node computer is a PC integrated with the TPS DCS system to share the process data for advanced applications. APP node internally includes an OPC server interface for the process data (TPN OPC server) and the common application platform for the individual advanced control solution components (URT Platform). The GUI for engineers are available on a PC node as standalone Microsoft Windows operating system applications.
5AATCA 5AATCB 5AACC 5BACC
5BATCA 5BATCB
Server for ENG GUI
MPC ELA-B
ACC Engineering GUI
URT Platform
ATC Engineering GUI
TPN OPC server
UES Interface Algorithms
APP node
Watchdog
Target DCS, TPS
UES Operator GUI GUS
Honeywell TPS
Figure 14: System architecture of the advanced control solution
The set points from the advanced control layer are interfaced to individual regulatory controllers on DCS level. The original robust basic control strategies, i.e. a master pressure controller, boiler load allocation, individual boiler control loops, remain implemented in the DCS. In case when the advanced control algorithms are not running, or in case of any communication problems, i.e. if the optimal set point from the advanced control layer is not communicated within a predefined shed period, the DCS regulatory control layer automatically sheds from the CAS mode to BCAS/AUTO mode, i.e. to the set point provided 18
by the regulatory control strategies. Typically, AUTOMAN stations or PID controllers are used as interface points. Using the initialization functionality in the DCS, the back-up regulatory control strategy is initialized to guarantee bumpless transition from CAS (advanced control) to BCAS/AUTO (regulatory control) mode. Only ACC CFB controllers write periodically the desired set points to DCS, while the upper parts of the component cascade (MPC and ELA-B) read the process values and provide outputs only to their slave components within the advanced control ACC/ELA-B/MPC cascade. The Human-Machine Interface (HMI) for operators is fully integrated with the schematics of the existing DCS regulatory control on the operator console screens in the control room. The purpose of such integration is to minimize distraction of the operators by overseeing the additional advanced control layer during their normal plant control operations. No matter whether the advanced control strategy is running or idle, the operators still use the same screens and the same graphical patterns to intuitively supervise the process. The GUI for the advanced applications consists of a visualization object included in the frequently used control schematics (e.g. boiler overview, combustion air loops, limestone control, etc.), and detailed multi-page schematics for each advanced control component. The advanced application visualization object provides information about the status of the advanced controllers and buttons calling up the corresponding detailed display for more information. Changing the advanced set ranges or selected parameters of the advanced controller or switching it on/off is possible from the detailed display. Some examples of integration of the advanced control HMI into operator schematics are provided in Figure 15 and Figure 16.
Figure 15: Boiler 5A combustion control schematic on DCS operator station with interface points of the APC/RTO solution.
19
Figure 16: Boiler 5B ACC CFB detail on DCS operator station – summary of MV/CV/DV trajectories and limits
As an open OPC communication standard is used to interface the advanced control layer with the regulatory control, the solution is not limited to Honeywell DCS, but can be implemented as a supervisory control layer with any modern 3rd party DCS that provides support to the OPC technology.
20
5. Operation Experience The implementation of the advanced control strategy on CFB boiler results in a significant reduction of variability of the key process variables. The major improvement was the performance of the bed temperature control: compare the variability of the bed temperature during 7 day period before and after the ACC commissioning in Figure 17. While the regulatory control was not able to keep the bed temperature in the 860 – 900 oC range and required frequent operator interventions, with the multivariable predictive control, the variability of bed temperature was significantly reduced. B e d t e m p e r a tu r e @ 7 d 0 h 0 m 0 s 1 / 1 5 /0 8 9 0 0 .0 0
1 6 :5 8 : 0 6
1 /2 2 / 0 8
ACC OFF 8 6 0 .0 0 * *# 1
( R ) 5 a b e d t e m .p v
1 / 2 2 /0 8 1 6 : 5 8 : 0 0
8 8 4.1 5
(R a w )
16 :58 :0 6
ACC ON
B ED TEM PER ATURE AVG
Figure 17: Boiler 5A bed temperature control 7-day trend; 6 days with standard PID controls, last day with ACC switched on
After final tuning, the achieved steady state variability (standard deviation) of the bed temperature was σTB = 0.87 oC – see Figure 18. Similar improvement was achieved in the variability of the oxygen in the flue gas and the SOx in the flue gas – see Figure 19 and Figure 20. The calm control strategy used for the CFB boiler combustion control has also a positive effect on other control loops. As an example, see the variability of the superheated steam temperature controlled by the predictive Advanced Temperature Control (using the same predictive control engine as the ACC controller [2]) with achieved variability (standard deviation) of the superheated steam temperature σSS = 0.4 oC – see Figure 21. As the multivariable predictive controller is based on the dynamic model, the performance during the transients was also significantly improved. The coordinated control can stabilize key process variables within the required set range for step change of the load up to 40 – 50 t/h. Reduced variability of key process variables is a precondition to further optimization of boiler operations. During extensive boiler tests the key performance indicators were evaluated as functions of boiler load, bed temperature and excess air level. The dependencies resulting from these tests are used to optimize boiler operation from operation cost point of view. 21
From: 1/22/08 8:58:41 PM To: 1/23/08 8:58:41 AM #Bars = 50
200
Count
150
100
50
0880
882
884
886
888
890
5abedtem.pv
Figure 18: Boiler 5A bed temperature histogram, setpoint TB SP = 885 oC, mean value TB MEAN = 885.0 oC, standard deviation σTB < 1 oC From: 1/23/08 1:07:31 AM To: 1/23/08 5:07:31 AM #Bars = 50
250
200
Count
150
100
50
02.8
2.9
3.0
3.1
3.2
3.3
3.4
3.5
5AAT0701.pv
Figure 19: Boiler 5A oxygen level histogram; setpoint O2 SP = 3.1%, mean value O2 MEAN = 3.097%, standard deviation σO2 < 0.1%
22
3.6
From: 1/23/08 12:04:52 AM To: 1/23/08 4:04:52 AM #Bars = 50
120
100
Count
80
60
40
20
0 1400
1450
1500
1550
1600
5AAT0703.pv
Figure 20: Boiler 5A SOx level histogram; setpoint SOx SP = 1500 mg/m3, mean value SOx MEAN = 1495 mg/m3, standard deviation σSOx < 25 mg/m3 From: 1/22/08 10:42:44 AM To: 1/22/08 12:42:44 PM #Bars = 50
250
200
Count
150
100
50
0 536
537
538
539
540
541
542
5acmsa01.pv
Figure 21: Boiler 5A superheated steam temperature histogram; setpoint TSS SP = 539 oC, mean value TSS MEAN = 539.0 oC, standard deviation σTss < 0.4 oC
As an example, consider the dependency of boiler efficiency on boiler load and excess air in Figure 22. The sensitivity of boiler efficiency to oxygen in the flue gas ∆η = −0.49 ∆ O2 23
provided by weighted least square estimate suggests that significant improvement in boiler efficiency can be achieved by operating the boiler with reduced excess air (the sensitivity is approximately 0.5% point increase of efficiency to 1% point decrease in O2 concentration). Further tests were performed to evaluate the constraints to excess air reduction. Unlike with pulverized coal fired boilers, with the ACC multivariable control strategy the reduced O2 set point in the range 2 - 2.5% (originally the boilers were operated at 3.0 – 3.5% flue gas O2) results only in an increased primary air/secondary air ratio while no significant increase of CO and unburned carbon in the bed and fly ash was observed. In a similar way, reduced variability of the bed temperature can be used to optimize the lime calcination efficiency.
Figure 22: Boiler 5A efficiency as a function of boiler load Fss [t/h] and excess air indicated by oxygen concentration VO2 [%]. Note the significant sensitivity of efficiency to reduced excess air (oxygen concentration).
24
6. Summary The control strategy based on the simple non-linear model described in this text can control the CFB boiler thermal power, oxygen level, and the bed temperature independently. The CFB model analysis demonstrates some features that make classical PID regulatory control tuning difficult: for example inverse responses of the oxygen concentration in the flue gas and the bed temperature. Moreover, there is no manipulated variable which could control the bed temperature directly – the bed temperature control can be achieved via multivariable coordination of all the manipulated variables only. It is difficult to make any general statement concerning this control system performance when compared to the PID – configuration of the PID loops (using transformed auxiliary variables like primary/secondary airs ratio etc.) could mimic the strategy described. However, the complexity of such solution would be prohibitive from the transparency and maintainability point of view. Moreover, the gain scheduling is impossible without the bed char inventory inferential sensor. Hence, the worst case solution would have to be used leading to sluggish controls. The implementation of the closed-loop advanced control on top of existing DCS PID controls significantly improved operations of the 310 t/h circulating fluidized bed boilers 5A and 5B of the Jinshan Power Plant at SINOPEC Shanghai Petrochemical Company. The most significant benefits include reduced variability of the bed temperature from 860 – 900 °C to required set point around 885 °C with the standard deviation less than 1 °C; controlled SOx emissions with standard deviation less than 25 mg/m3; reduced flue gas O2 emissions to 2.5% resulting in boiler efficiency increase by 0.25 - 0.5% point; improved boiler responsiveness to load demand changes, resulting in ability of the boilers to maintain key process variables (flue gas O2, bed temperature, SO2 emissions) stabilized within load step changes up to 40 – 50 t/h. Besides practical success of the model based predictive control based solution, the understanding of the core phenomena provides a good example of a relatively simple proces with high level of interaction and complex dynamics. The model covered in Section 2 can be used in control engineering education as a benchmark example where it is difficult to achieve the required performance without full utilization of multivariable state space theory and online adaptation of key process parameters. Acknowledgement: This work was partially supported by the Ministry of Industry and Trade of the Czech Republic under the POKROK project 1H-PK/22, “Advanced Methods of Control and Optimization for Power”. All trademarks used herein are the property of their respective owners.
25
7. References [1]
Howard, J. R.: Fluidized beds–combustion and applications. Applied Science Publishers, London (1983)
[2]
Findejs, J., V. Havlena, J. Jech, D. Pachner, J. Vohryzek, P. Liu, and Weijie Zhao: Experience of Circulating Fluidized Bed Boiler Control and Optimization at SINOPEC Principal Power Plant. Power Gen Asia 2008 [on CD], Kuala Lumpur (2008).
[3]
Bittanti, S., P. Bolzern, M. C. Campi, A. DeMarco, G. Poncia, and W. Prandoni: A Model of a Bubbling Fluidized Bed Combustor Oriented to Char Mass Estimation. IEEE Transactions on Control Systems Technology 8 (2) 247-256 (2000).
[4]
Havlena, V. and D. Pachner: US Pub. App. No 20090056603 Control of CFB boiler utilizing accumulated char in bed inventory (2009)
[5]
Findejs, J., V. Havlena, J. Jech and Pachner, D.: Model Based Control of the Circulating Fluidized Bed Boiler. Proceedings of the 9th IFAC Symposium on Power Plant and Power Systems Control, Tampere, Finland (2009).
[6]
Basu, P. and S. A. Fraser: Circulating fluidized bed boilers–design and operations. Butterworth-Heinemann, Boston (1991)
[7]
Åström, K. J., and R. D. Bell: Drum-Boiler Dynamics. Proceedings of IFAC Symposium on Power Systems, Modeling and Control Applications. (1998)
[8]
Rossiter, J.A., B. Kouvaritakis and R. M. Dunnett: Application of generalized predictive control to a boiler-turbine unit for electricity generation. IEE Proceedings D, 138 (1), (1991)
[9]
Lu, S. and B. W. Hogg: Predictive coordinated control for power-plant steam pressure and power output. Control Engineering Practice, 5 (1), 79-84 (1997)
[10] Hogg, B. W., S. Lu and W.D. Ni: Generalized predictive steam temperature control for power plant systems. Proceedings of IEEE International Conference on Power System Technology, Beijing, China, 266-270 (1994) [11] Silva, R. N., P. O. Shirley, J. M. Lemos, and A. C. Gonçalves: Adaptive regulation of super-heated steam temperature: a case study in an industrial boiler. Control Engineering Practice, 8, 1405–1415 (2000). [12] Kothare, M. V., B. Mettler, M. Morari, P. Bendotti and C. M. Falinower: Linear Parameter Varying Model Predictive Control for Steam Generator Level Control. Computers and Chemical Eng., Supplement to vol. 21, S861-S866 (1997). [13] Chu, J. Z., S. S. Shieh, S. S. Jang, C. I. Chien, H. P. Wan and H. H. Ko: Constrained optimization of combustion in a simulated coal-fired boiler using artificial neural network model and information analysis. Fuel, 82, 693–703 (2003). [14] Havlena V. and J. Findejs: Application of model predictive control to advanced combustion control. Control Engineering Practice 13 (6), 671-680 (2005). ISSN 09670661 [15] Kratochvíl, S., V. Havlena, J. Findejs, and J. Jech: Unified Energy Solutions package (heat plant Otrokovice experience). Euro Heat & Power, European Technology Review 2002: Cogeneration & District Heating and Cooling (2002) [16] Havlena, V., J. Findejs, J. Jech, H. S. Kim, K. C. Park and K. Y. Kim: Application of the “Unified Energy Solutions” package in Samsung Fine Chemicals. Preprints of the IFAC Symposium on Power Plants & Power Systems Control 2003 (CD-ROM). Seoul, Korea. (2003) [17] Šomvarský, J. and V. Havlena, V.: Economic Load Allocation. Preprints of the 15th Triennial World Congress of the International Federation of Automatic Control [CDROM]. 2413-2418 (2000). 26
[18] US patent No. 6,832,134 Coordination in multilayer process control and optimization schemes (2004) [19] Beran, J., J. Findejs, V. Havlena, B. Horn, and M. Rozložník: Platform for Advanced Control Applications. Preprints of the 16th Triennial World Congress of the International Federation of Automatic Control [CD-ROM] (2005). [20] Lemos, J. M., P. O. Shirley, R. N. Silvay and B. A. Costa: Adaptive Predictive Control of Superheated Steam and Economic Performance. In: Pal Szentannai (ed.): Power Plant Applications of Advanced Control Techniques. ProcessEng Engineering GmbH, Wien (2010) ISBN 978-3-902655-11-0
27