In: Proceedings of the Fourth IEEE International Conference on Broadband ...... 0323648), Cisco Systems Inc., and the IBM Corporation. 8. ... Audio Traffic, Proc.
Modeling and Generating TCP Application Workloads INVITED PAPER Félix Hernández-Campos
Kevin Jeffay
F. Donelson Smith
Department of Computer Science University of North Carolina at Chapel Hill http://www.cs.unc.edu/Research/dirt
Abstract — In order to perform valid experiments, traffic generators used in network simulators and testbeds require contemporary models of traffic as it exists on real network links. Ideally one would like a model of the workload created by the full range of applications running on the Internet today. Unfortunately, at best, all that is available to the research community are a small number of models for single applications or application classes such as the web or peer-to-peer. We present a method for creating a model of the full TCP application workload that generates the traffic flowing on a network link. From this model, synthetic workload traffic can be generated in a simulation that is statistically similar to the traffic observed on the real link. The model is generated automatically using only a simple packet-header trace and requires no knowledge of the actual identity or mix of TCP applications on the network. We present the modeling method and a traffic generator that will enable researchers to conduct network experiments with realistic, easy-to-update TCP application workloads. An extensive validation study is performed using Abilene and university traces. The method is validated by comparing traces of synthetically generated traffic to the original traces for a set of important measures of realism. We also show how workload models can be re-sampled to generate statistically valid randomized and rescaled variations.
1 Introduction An important limitation of most experimental networking evaluations is that they depend on application-specific workload1 models. Given the complexity inherent in this approach (e.g., the effort involved in understanding, measuring, and modeling specific application-layer protocols), it is quite understandable that workload models usually consider only one or a small number of applications. However, few (if any) networks today carry traffic from one or two applications or application classes. Most carry traffic from hundreds or perhaps thousands of applications in proportions that vary widely from link to link. (In fact simply determining precisely the mix and traffic volume of diverse applications is a difficult problem.) This issue of application mixes is a serious concern for networking researchers. For example, if one wanted to evaluate a new active queue management scheme (or router architecture, or TCP protocol enhancement,…), it stands to reason they should consider its impact on all web-based applications, peer-to-peer applications, streaming media, other non-interactive applications 1 We generally use the term workload for data input to the network at the socket level and the term traffic for packets that are generated by the protocol stack and are carried by the network elements.
such as mail and news, and on the ensemble of all applications mixed together. The majority of previous work in workload modeling has focused on the development of source-level models of single applications, for example [1, 5, 7, 9, 12, 13, 14]. Because of this, there are no models for mixes of networked applications. Worse, the use of analytic (distribution-based) models of specific TCP applications doesn’t “scale” to developing workload models of application mixes comprised of hundreds of applications. Most related, and complementary to our work, is the Swing system [19]. However, whereas an emphasis in Swing is the accurate representation of structural aspects of applications’ use of the network (e.g., the use of parallel connections), here the focus is more on the accurate representation of individual connections. In this paper we describe a method for constructing statistically sound workload models from network packet traces. These models capture the effects of the full mix of applications using a given link. In order to validate and apply this approach in simulations, we also describe a novel tracedriven method for workload generation that scales to modeling any empirically determined application mix. It also provides the ability to “replay” the application workload from a real network in a simulation or laboratory network and “reproduce” critical properties of the packet-level traffic found on the real network. A fundamental requirement for replaying application workloads is that the inputs to the replay be layered over any transport protocol that operates as a closedloop mechanism (e.g., TCP). This is in contrast to an openloop approach in which packets are injected at the network or link layer according to some model of packet arrival processes. The open-loop approach ignores the essential role of feed-back mechanisms such as TCP congestion control in shaping packet-level traffic arrival processes [8]. The remainder of this paper is organized as follows. Section 2 describes our approach to modeling TCP application workloads. Section 3 describes a tool to generate TCP workloads in a laboratory network. Section 4 presents a series of validation experiments using traces from two networks. Section 5 discusses methods for resampling from the models to generate statistically valid randomized and rescaled variations. Section 6 summarizes the benefits and implications of applying the models in network experiments.
In: Proceedings of the Fourth IEEE International Conference on Broadband Communications, Networks, and Systems (BroadNets 2007), Raleigh, NC , September 2007.
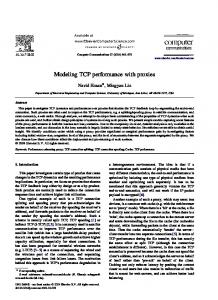
2. The a-b-t Model for TCP Application Workloads The workload model is constructed by analyzing packetheader traces from network links. A trace of TCP/IP headers is obtained and “reverse compiled” into a higher-level, abstract representation that captures the dynamics of both enduser interactions and application-level protocols above the socket layer. Each TCP/IP connection traced in the network is represented as a single a-b-t connection vector. The connection vector models how an application used that TCP connection for a series of data-unit exchanges between the TCP connection initiator (“a”) and the connection accepter (“b”). The data units we model are not packets or TCP segments but instead correspond to the objects (e.g., files) or protocol elements (e.g., HTTP GET requests or SMTP HELO messages) as defined by the application and the application protocol. The sizes of these application-data units (ADUs) depend only on the application protocol and the data objects used in the application and, therefore, are (largely) independent of the sizes of the network-dependent data units employed at the transport level and below. For example, HTTP requests and responses depend on the sizes of headers defined by the HTTP protocol and the sizes of files referenced but not on the sizes of TCP segments used at the transport layer. The data units that are exchanged may be separated by time intervals (t) that represent application processing times or user “think” times. A sequence of such exchanges constitutes the connection’s “vector.” A novel aspect of this approach is its ability to construct a model of how an application uses the network with no knowledge of the application’s identity or operation. For example, in a TCP connection between a web server and browser, we can represent their behavior over time with the simple diagram shown in Figure 1. A browser makes a request to a server which then responds with the requested object. Another common pattern for TCP connections arises from application protocols where there are multiple ADU exchanges between the endpoints of a logical connection (e.g., HTTP/1.1, SMTP, FTP-CONTROL, NNTP, etc.). This pattern is shown in Figure 2. In addition to the ADU sizes represented by the ai and bi, we also introduce a time variable, ti, that represents times between exchanges and that is likely to be independent of the network (e.g., human “think times” or application-dependent processing times). For comparison, a conversation of a mail client with an SMTP server would generate the pattern shown in Figure 3. More formally, we represent a pattern of ADU exchanges as a connection vector Ci = consisting of a set of epochs Ei = (ai, bi, ti) where ai is the size of the ith ADU sent from connection initiator to connection acceptor, bi is the size of the ith ADU sent from connection acceptor to connection initiator, and ti is the “think” or processing time between the receipt of the ith “response” ADU and the transmission of the (i + 1)st “request.”
WEB BROWSER
HTTP Request 341 bytes
TIME
WEB SERVER
2,555 bytes HTTP Response
Figure 1: The pattern of ADU exchange in an HTTP 1.0 connection.
BROWSER
HTTP Request 2 403 bytes
HTTP Request 1 329 bytes 403 bytes
SERVER
HTTP Request 3 356 bytes
25,821 bytes
1,198 bytes
HTTP Response 2
HTTP Response 1
TIME
3.12 secs
0.12 secs
HTTP Response 3
Document 1
Document 2
Figure 2: The pattern of ADU exchanges in an HTTP 1.1 connection. HELO 32 bytes
SMTP SENDER SMTP RECEIVER
MAIL 77 bytes
RCPT 75b
Email Message 22,568 bytes
DATA 6b
TIME
93 bytes
191 bytes
59b
38b
50b
44b
220 Host Info
250 Domain Info
250 Ok
250 Ok
250 Ok
250 Ok
Figure 3: The pattern of ADU exchanges in an SMTP connection.
For example, if this analysis is applied to a trace of the TCP/IP headers from the connection pictured in Figure 2, it would produce an a-b-t connection vector, Ci = with a start time, Ti. Abstractly we say that the connection vector consists of three epochs corresponding to the three HTTP request/response exchanges. This vector represents a TCP connection the browser initiated at Ti as a persistent HTTP connection where the browser sends three HTTP requests of 329, 403, and 356 bytes, respectively, and the server responds to each of them with HTTP responses (including object content) of 403, 25821, and 1198 bytes, respectively. The second request was sent 120 milliseconds after the last segment of the first response was received and the third request was sent 3120 milliseconds after the second response was received. For more details on additional features of the a-b-t model for modeling unidirectional and concurrent ADU flows, and for how packets traces are analyzed to create connection vectors, see [20, 16].
3. Workload Generation from a-b-t Traces Once the a-b-t trace T has been obtained, it may be used for workload modeling and generation in a variety of ways. One primary goal is to reproduce the traffic represented by a single packet trace simply by “replaying” T at the socket API with the same sequence of connection start times. This preserves both the order and initiation time of the TCP connections. This is the trace-driven approach we describe and validate in this paper. A workload generator driven by an a-b-t trace will initiate TCP connections at times taken from the Ti and, for each connection, send and receive data based on the Ci that models the application’s use of that connection. We assume that the environment in which the generator program runs has an interface to the transport layer (e.g., sockets) that can be
used to initiate the (real or simulated) transmission of application data. For example, in ns-2 [2], workload-generating code accesses the transport layer via the Full-TCP model [20]. Full TCP closely mirrors the implementation of stream sockets in actual operating systems. Workload-generating applications can send and receive data in much the same manner as they would with sockets. Workload generators in laboratory or testbed networks can use the socket interface in real operating systems to send streams of bytes. The results presented in this paper were obtained using a workload generating tool, tmix, which implements the trace replay method in a FreeBSD environment. Two instances of this program, each running on a machine at the edge of a network, can perform a replay by establishing one TCP connection for each connection vector Ci in a trace, with one instance of the program playing the role of the connection initiator and the other program the connection acceptor. The connection initiator performs socket writes to send the number of bytes specified in the first data unit a1. The other end point will read as many bytes as specified for the data unit a1. This first data unit, is also used to synchronize the two instances of tmix, by including a 32-bit connection-vector id in the first four bytes of the first data unit. With this id, the acceptor can uniquely identify the connection vector that it is expected to replay in this TCP connection. This approach guarantees that the tmix endpoints always remain properly synchronized (i.e., they agree on the Ci they replay within each TCP connection) even in the face of lost or reordered segments. For example, consider the replay of the connection vector, Ci = (329, 403, 0.12), (403, 25821, 3.12), and (356, 1198, �) that corresponds to the TCP connection in Figure 2. At time Ti the tmix connection initiator establishes a new TCP connection to the tmix connection acceptor. The initiator then writes 329 bytes to its socket and reads 403 bytes. Conversely, the connection acceptor reads 329 bytes from its socket and writes 403 bytes. After the initiator has read the 403 bytes, it sleeps for 120 milliseconds and then writes 403 bytes and reads 25,821 bytes. The acceptor reads 403 bytes and writes 25,821 bytes. After sleeping for 3,120 milliseconds, the third exchange of data units is handled in the same way, and the TCP connection is terminated. The sequential replay of connection vectors at prescribed start times raises a number of implementation issues and challenges. Scalability is particularly important for laboratory environments where a relatively small set of hosts (on the order of 100) is being used to generate traffic corresponding to a much larger number of active connections (on the order of 10,000-100,000). The first step in trace replay is to divide a complete trace into non-overlapping subtraces. During workload generation, the connections within a particular subtrace are implemented by a single host pair, so the number of subtraces is equal to the number of available host pairs. The detailed selection of the subtraces will depend on
the load balancing strategy, and the speed of the host machines. Our experience with the experiments reported in this paper showed that a simple round-robin assignment of connection vectors to machine pairs performed well.
4. Validation Experiments In this section we describe a number of experiments designed to validate our approach to workload modeling and generation. Our experimental procedure is based on the following steps: 1. Acquire a TCP/IP header trace from an Internet link and filter it to obtain all packets from TCP connections where (i) the SYN or SYN+ACK was present in the trace (so we can explicitly identify the connection initiator), and (ii) the connection was terminated by FIN or RST. This eliminates only those connections that were in progress when the packet trace began or ended. In the remainder of the paper phrases like “Abilene trace” will refer to the trace derived with this filtering method. We also refer to these traces as the “original” traces. 2. Derive a trace, T, of a-b-t connection vectors from the packet headers in the original trace. 3. Use T to generate the workload with the trace-driven generator tmix described in Section 3. 4. Capture a TCP/IP packet header trace of the resulting traffic on a laboratory link using tcpdump. In the remainder of this paper phrases like “Abilene replay” or just “replay” will refer to the packet traffic captured in the laboratory trace. 5. Compare various properties of the traffic in the original trace with the replay trace. We report the results from applying this approach to TCP/IP header traces from two Internet links: an OC-48 link in the Abilene backbone between Indianapolis and Cleveland, and a 1 Gbps Ethernet link connecting the campus of the University of North Carolina at Chapel Hill (UNC) with the router of its ISP. For Abilene we acquired a 2-hour trace from the NLANR repository.2 This is a bi-directional trace and was captured in August, 2002, using a DAG monitor [4]. The UNC access-link trace is a one-hour bi-directional trace taken during a peak traffic period (1 PM) in April 2003 using tcpdump on a high-end server-class machine. Table 1 gives summary statistics for the traces obtained after the filtering in the first step of the procedure above. All the replay results described in this section were obtained from the laboratory configuration shown in Figure 4. The network consists of approximately 50 Intel-processor machines running FreeBSD 4.5. Forty-four of these machines 2
We gratefully acknowledge the traces from the NLANR Measurement and Network Analysis Group (NLANR/MNA) which is supported by the National Science Foundation cooperative agreement nos. ANI-0129677 (2002) and ANI-9807479 (1998).
4.1 Validation against real link traffic
tcpdump Monitor Ethernet Switches
FreeBSD Router 1 Gbps
Ethernet Switches
1 Gbps
Tmix + dummynet endsystems
...
...
1 Gbps
100 Mbps
FreeBSD Router
100 Mbps
Tmix + dummynet endsystems
Figure 4: Experimental network setup (simplified).
Trace Clev->Ipls Ipls->Clev UNC->Inet Inet->UNC
Duration
Connections
120 mins.
2,442,548
60 mins.
1,313,072
Packets
Bytes
158.2M
128.5GB
160.5M
125.9GB
62.8M
66.4GB
54.6M
21.6GB
The most demanding validation experiment that we could devise was to use the workloads derived from the Abilene and UNC traces with the goal of reproducing certain essential characteristics of the original link traffic when the workloads are replayed at the socket API in the laboratory network. The question being explored is: to what extent can we reproduce the packet traffic found on a real network link in the laboratory by replaying application-level data units? Clearly reproduction would be straightforward if we simply used a tool such as tcpreplay [21] to replay the packet trace in an open-loop experiment. Instead, we created a closedloop simulation driven by the workload model at the socket API and show that the generated packet-level traffic has the essential properties of the original traces reproduced in it.
Table 1: Summary statistics.
Our metrics for evaluating the fidelity of the synthetic traffic that is reproduced from real, measured traffic include:
execute the trace-driven workload generator, tmix, as described in Section 3 (22 pairs, with one machine from the pair on each side of the configuration). The generating machines have 100 Mbps Ethernet interfaces and are attached to switched VLANs on Gigabit Ethernet switches.
• The link load or throughput — the number of bits per second (including protocol headers) transmitted on a link. Note that because we can replay the applications’ use of TCP connections at both endpoints, we are able to generate the packet-level traffic flowing in both directions of the link concurrently.
At the core of this network are two 1.4 GHz Intel-processor server-class machines (PCI-X busses) acting as routers (IPforwarding enabled) with drop-tail FIFO queues. The router machines have 1 Gbps interfaces to the Ethernet switches and a point-to-point Gigabit Ethernet between the routers.3 For all the experiments reported here, there is no congestion on any router or switch interface and no losses were recorded at these interfaces. We also verified that there were no CPU or other resource constraints on the generators. So that we can emulate TCP connections that traverse a longer network path than the one in our lab, we use a locally-modified version of dummynet [15] to configure inbound and out-bound packet delays on the workload generating machines. These delays emulate different round-trip times on each TCP connection (thus giving per-flow delays). This version of dummynet delays all packets from a TCP connection by the same amount — a delay that is randomly-chosen for that flow. In many of the experiments reported in this section, the distribution of RTT values across all TCP connections is an important parameter and the values used are described for each experiment. The version of TCP used in these experiments is newReno without SACK. Unless specified otherwise for certain experiments, TCP had an ssthresh of 4 MB, RFC 1323 was disabled, delayed ACKs (up to 100 milliseconds) were enabled, ECN was disabled, send space was 32K and the receiver maximum window was 17,520 bytes.
• The statistical properties of the time series of counts of arriving packets and bytes on a link in an interval of time (e.g., use of Hurst parameter estimates from wavelets to measure long-range dependence [3]). • The number of simultaneous active TCP connections over an interval of time (typically one second). This metric is important for experiments where per-flow state is maintained in a router. We define a connection as active from the time the initial SYN segment appears in the trace until the time of the last FIN or RST segment.4 To reproduce traffic from a real link in a laboratory network, we must consider a second set of factors that are network-dependent but are, to a first approximation, independent of the applications using the network. The primary network-dependent factors at the endpoints that we consider are the TCP sender and receiver window sizes and the maximum segment size (MSS). The network-dependent factor along the path between endpoints that we use is the distributions of per-flow round-trip times. We also consider per-flow packet loss rates in our validation study. Our purpose is only to get a sense of the impact of loss rates on our validation metrics, not to suggest that perflow packet loss rates should be used in simulations. Loss rates in a simulation should be the output of an experiment and not an input to it. Otherwise, closed-loop mechanisms 4
3
The peak load in any 10 millisecond interval of the Abilene OC48 trace was always well below 1 Gbps so it could be replayed in this lab configuration.
We tried a time threshold of 60 seconds without seeing a packet to terminate connections (similar to NetFlow) but found no substantial differences.
1
0.8
0.8
0.95
0.4
0.6
0.4
0.2
0.2 Original Approximation
0 0
10000
20000
30000
40000
50000
60000
0 0.01
70000
0.1 1 Round-Trip Time in Seconds
Receiver Window Size in Bytes
200
220
180
200
160 140 120 100 80 Original Baseline Win+RTT+Loss
60 40 0
20
40
60 Time in Minutes
80
100
160 140 120 100 80 Original Baseline Win+RTT+Loss
40
120
0
20
40
60 80 Time in Minutes
Abilene University 0
0.05
0.1
0.15
0.2
0.25
Probability of Segment Retransmission (Per Connection)
180
60
0.85
0.75
10
Figure 6: Empirical and replay RTT distributions. Throughput in Mbps (1-Minute Bins)
Throughput in Mbps (1-Minute Bins)
Figure 5: Abilene empirical and replay window size distributions.
0.9
0.8
Abilene Original Abilene Approximation University Original University Approximation
100
Figure 7: Number or retransmissions per TCP connection in Abilene and UNC traces. Number of Active Connections Per Second
0.6
Cumulative Probability
1
Cumulative Probability
Cumulative Probability (of Total Bytes)
1
120
4500 4000 3500 3000 2500 2000 1500 Original Baseline Win Win+RTT Win+RTT+Loss
1000 500 0 0
20
40
60
80
100
120
Time in Minutes
Figure 8: Abilene throughput with empirical Figure 9: Abilene throughput with empirical Figure 10: Abilene active connections with RTT, window sizes, and loss rates, RTT, window sizes, and loss rates, empirical RTT, window sizes and loss rates. Cleveland to Indianapolis. Indianapolis to Cleveland.
cannot be evaluated. All the network-dependent properties described above, RTTs, window size, MSS, etc., are either properties of a specific topology and path, or are end-system configuration parameters. We analyzed the original TCP/IP packet traces to determine the distributions of the receiver’s maximum window size per connection, and the minimum RTT per connection. The distribution of window sizes was determined from the values advertised on the SYN, SYN+ACK exchange. The replay experiments were conducted with the empirical distributions for the receiver’s maximum window size per TCP connection approximated by configuring the appropriate fraction of the lab machines to use certain window sizes. Figure 5 shows the distribution of receiver’s maximum window size per TCP connection (weighted by the percentage of total bytes flowing on TCP connections using that window size) in the original traces compared with the achieved replay distributions. There was clearly a good match between the receivers’ maximum window sizes in the real network and their approximation in the replay. An interesting observation is that over 68% of total bytes in the Abilene trace were carried on TCP connections that had maximum window sizes less than 20K bytes. In the UNC trace (not shown due to space limitations), 75% of total bytes were carried on TCP connections that had maximum window sizes less than 20K bytes. In both traces over 50% of the total bytes were carried on TCP connections where the receiver’s maximum window is less than 10K bytes.
We estimated a minimum RTT value for each TCP connection in our traces using the timestamps of the segments in the initial 3-way connection-initiation handshake. The replay experiments were conducted using the empirical distributions for the estimated RTT per TCP connection. We approximated this distribution in the replay by a mix of distributions used to set the per-flow delays by dummynet at the endpoint machines. Figure 6 shows the distribution of estimated RTT per flow in the original traces compared with the achieved replay RTT distribution (again estimated from the initial 3-way handshake). There was a good match between the RTTs in the real network and their approximation in the replay. Note that the UNC RTT distribution had a substantially lighter body than Abilene – 80% of connections had an estimated RTT of 100 milliseconds or less while only 50% of Abilene connections had estimated RTT values less than 100 milliseconds. In both cases, however, 90% of connections had an estimated RTT of 200 milliseconds or less. The UNC distribution had a slightly heavier tail. To get a sense of the impact of losses in our traces, we plot retransmissions rates for Abilene and UNC in Figure 7. Most connections did not experience any retransmissions, suggesting low loss rates. Loss rates for connections that suffer losses are directly related to the retransmission rates. Figures 8-10 explore the power of our modeling and traffic generation approach to reproduce real network traffic in the lab. The plots compare the original trace, a baseline replay and one or more tuned replays. The baseline replay uses some plausible values for the network-dependent properties
24 22
0.02 0.16 0.64 2.56 10.24 40.96 secs. Clev−>Ipls Original Baseline Win+RTT+Loss
20 log2 Variance(j)
that one might use in the absence of empirical data. In particular for the baseline, the distribution of roundtrip times was uniformly distributed between 10 and 150 milliseconds, maximum receiver windows were set to 17,520 bytes, and no extra random losses were added. The tuned replays make use of the network-dependent properties measured from the original traces as shown in Figures 5-7.
18 16
the Hurst parameter along with confidence intervals on the estimate can be obtained from the slope of this line (H=(slope+1)/2). For more information than this simplified summary, see [18].
Figure 11 shows the logscale diagram for one of the directions of the 12 Abilene trace. Both the original and 10 the replay show strong scaling start8 ing around 500 milliseconds, so the 6 replay substantially reproduces the 2 4 6 8 10 12 14 j = log2(scale) long-range dependence of the trafThe bytes transmitted on the fic. The strength of this scaling, as Abilene link in 1-minute intervals Figure 11: Abilene logscale diagram of packet estimated by the Hurst parameters are shown in Figures 8 and 9. For arrivals (Cleveland to Indianapolis). was H = 1.04 for the original (the the Cleveland to Indianapolis path, confidence interval was between 1.03 and 1.05), H = 1.17 the replay appears to track the fluctuations in load quite for the baseline replay (C.I. = [1.16, 1.18]) and H = 1.12 for closely, especially for the tuned replay, in which we used the tuned replay (C.I. = [1.11, 1.13]). These values are measured receiver window sizes (Win), round-trip time above 1.0, so the packet arrival process is to some extent (RTT) and loss rates (Loss). The baseline replay is signifinon-stationary and the Hurst parameter may be influenced cantly more bursty (note the sharp peaks in the first 30 minby this. Note the “ditch” at small time scales, which sugutes of the replay). The throughput plot for the other direcgests a lack of variance at type scales around 300 millisection shows a sustained burst between 35 and 45 minutes. onds corresponding to the 90% percentile of RTT. Thus Interestingly, the baseline replay reproduces this burst more most of the long-range dependence exists, as expected, at accurately than the tuned one. Our results for UNC (not time scales beyond the network RTTs. shown) are very comparable. 14
Figure 10 compares the number of active connection per second for Abilene. The baseline replay results in a number of active connections that is significantly smaller than the one in the original trace. As we tune the replay by adding more network-dependent properties, the number of active connection in the replays increases and becomes much more realistic. Similarly, the replay of UNC showed that networkdependent properties affect the number of active connection significantly. This shows that it is essential for experiments to combine source-dependent and network-properties to obtain a realistic workload. For evaluating how well we reproduced the long-range dependence in the packet- and byte-arrival time series, we used the methods (and software) developed by Abry and Veitch [18] to study the wavelet spectrum of the time series. The output of this tool is a log-scale diagram that provides a visualization of the scale-dependent variability in the data. Briefly, the logscale diagram plots the log2 of the (estimated) variance of the Daubechies wavelet coefficients for the time series (I) against the log2 of the scale (j) used in computing the coefficients. The wavelet coefficients are computed for scales up to 216. Since the scale effectively sets the time scale at which the wavelet analysis is applied, there is a direct relationship between scale and time intervals (see the top labels of Figure 11). For processes that exhibit long-range dependence, the logscale diagram will exhibit a region in which there is an approximately linear relationship with slope > 0 between j and I. An estimate of
Combined, these results show that it is possible to use workload models and reproduce the traffic from backbone links like Abilene or access links like UNC in a laboratory with a relatively small number of machines using network hardware with sufficient transmission speeds. This validates the workload modeling and generation approach.
5. Trace Resampling and Load Scaling The traffic generation method described above provides a method for reproducing, in a closed-loop manner, the characteristics of the TCP connections observed in network links. Conducting a complete experimental program using this method would involve obtaining a set of traces from a variety of network links and generating traffic according to them. However, it is often desirable to have more modeling flexibility. For other modeling approaches we can derive from the values recorded in T the distributions for the key random variables that characterize applications at the source level (e.g., distributions of ADU sizes, time values, number of epochs, etc.). These can be used to populate analytic or empirical models of the workload in much the same way as has been done for application-specific models (e.g., SURGE for web browsing [1]). If one wanted to model a “representative” workload for an entire network, traces from several links in the network could be processed to produce their a-b-t representations and these pooled into a “library” of TCP connec-
tion vectors. From this library, random samples could be drawn to create a new trace that would model the representative workload. To generate this workload in a simulation, one could assign start times for each TCP connection according to an analytic or empirical model of connection arrivals (perhaps derived from the original packet traces).
tended range of offered loads. Intuitively, the offered load of T´ will be higher than that of T when m > n and lower when m < n over the same time interval. We will demonstrate that the number of connections in T´ and the resulting offered load are only loosely correlated, so we propose to refine the resampling to make the load of the T´s more predictable.
Another form of modeling one could use is strongly related to the methods of semi-experiments introduced in [11] but applied at the application level instead of the packet level. For example, one could replace the recorded start times for TCP connections with start times randomly selected from a given distribution of inter-arrival times (e.g., Weibull [15]) in order to study the effects of changes in the connection arrival process on a simulation. Other interesting transforms to consider include replacing the recorded ADU sizes with sizes drawn from analytic distributions (e.g., LogNormal [14]) with different parameter settings. One might replace all multi-epoch connections with single-epoch connections where the new a and b values are the sums of the original a and b values and the t values are eliminated (this is similar to using NetFlow data to model TCP connections as is done in Harpoon [17]).
Our first resampling technique is Poisson resampling. The starting point of this method is the assumption that connections are independent of each other, and therefore naturally arrive according to Poisson arrivals. The analysis of the connection inter-arrival distributions shown in Figure 12 appears to support this assumption.5 As we can see, the bodies of the connection inter-arrival distributions are very well-approximated by exponential distributions with the same mean. The tails of the distributions shown in Figure 13 show a more substantial deviation from the exponential model, which would motivate the use of a two-parameter model such as Weibull.6 Note, however, that fitting a Weibull model is significantly more complicated, so we have chosen to use the simpler exponential model, which does very well for the vast majority of the distribution. The exponential nature of the inter-arrival distribution does not however prove that connection arrivals follow a Poisson arrival process — they must also be independent. Figure 14 shows the logscale diagrams of the connection arrival process in the same traces, and for one simulated Poisson arrival process with the mean of the Leipzig trace. The presence of linear regions with positive slope starting at octaves 5-6 reveals long-range dependence in the connection arrivals in these traces, while the flat curve for the Poisson arrivals is consistent with short-range dependence. Our first resampling method, which relies on Poisson connection arrivals, ignores this fact and derives start times from an exponential distribution without any dependencies. However, our second resampling method, described later in this section, makes use of an idea from statistical bootstrapping to assign start time to connections in T´ in a manner that preserves the observed long-range dependence.
All such transforms provide researchers with a powerful new tool to use in simulations for studying the effects of changing workload characteristics in networks. In practice, however, researchers most often want to introduce some (controlled) variability in their experiments and perform several repetitions with “similar” traffic (e.g., “traffic that looks like UNC at 1 PM”) to, for example, compute confidence intervals, or they want to scale link loads for a constant mix of applications. In this section, we consider another approach that is better suited to experimenters’ needs to randomize experimental inputs or to scale network loads. In order to generate traffic that is “similar” to that found in a measured trace, we create a new trace by randomly sampling from the connection vectors in the original trace. The idea is to construct a new trace T´ = {(Ti, Ci, Ni) | i = 1,…, m} by resampling the connections in a measured trace T = {(Ti, Ci, Ni) | i = 1,…, n}, so for each connection vector in T´ there exists another connection vector in T with the same source-level (Ci) and network-level (Ni) characteristics. This leaves the problem of assigning start times (Ti) to the connections in T´. We propose and analyze two solutions, Poisson resampling and block resampling. In addition to creating randomizations of input traces, resampling provides a means to satisfy another common need of experimentalists: generating traffic with a range of offered loads. For example, active queue management mechanisms have very different performance depending on the level of saturation of the output link, so researchers generally explore a range of values between 50% and 120% of the link bandwidth. Rather than trying to find or collect traces with the exact range of loads needed, we can use a collection of resampled traces with the in-
Given a target duration d´ for T´, our basic Poisson resampling method proceeds by iteratively sampling connection vectors from T with replacement (so that T´ can be longer than T, i.e., so that d´ > d), and assigning them a start time T´i = T´i–1 + �i until T´i > d´. The �i are independent and identically distributed according to an exponential distribution. Given the light tail of the exponential distribution, the final number m of connections in T´ is always very close to d´/�, where � is the mean of the exponential distribution.
5 For our resampling results we include a second NLANR trace: a 2003 trace from a Gigabit Ethernet link between the University of Leipzig, Germany, and the rest of the Internet. 6 Weibull was proposed by Feldmann [16]. Note that the fit of the exponential bodies is far better for our data, and that [16] does not show the tail of the distribution.
1
1
0.7 0.6 0.5 0.4 0.3 UNC 1 PM Exponential (Mean=1,700 usecs.) Abilene-I Exponential (Mean=3,075 usecs.) Leipzig-II Exponential (Mean=5,230 usecs.)
0.2 0.1 0 0
2000
4000
6000
0.1
7
0.01
0.001
0.0001
0.16
0.64
2.56
10.24
40.96
secs.
UNC 1 PM Abilene−I Leipzig−II Exponential (Mean=5,230 usecs.)
8
2
Cumulative Probability
0.8
0.04
9
UNC 1 PM Exponential (Mean=1,700 usecs.) Abilene-I Exponential (Mean=3,075 usecs.) Leipzig-II Exponential (Mean=5,230 usecs.)
log Variance(j)
Complementary Cumulative Probability
0.9
6 5 4 3
1e-05
2 1
1e-06 0
8000 10000 12000 14000 16000 18000 20000
10000 20000 30000 40000 50000 60000 70000 80000 90000 100000 Connection Inter-arrival Time in Microseconds
Connection Inter-arrival Time in Microseconds
0
2
4
6 8 10 12 j = log (scale) −− Connection Arrivals
14
2
Figure 12: Bodies of the distr. of connection inter-arrivals and their exponential fits.
Figure 13: Tails of the distr. of connection Figure 14: Wavelet spectra for the connection arrival time-series and one Poisson fit. inter-arrivals and their exponential fits.
185
Average Offered Load in Mbps
180 175 170 165 160 155 150 Basic Poisson Byte-Driven Poisson Target Offered Load
145 140 1.25
1.3
1.35 1.4 1.45 1.5 1.55 Number of Connection Vectors (in Millions)
1.6
1.65
Figure 15: Scatterplot of results of 2,000 trace resamplings.
Figure 16: Histogram of the average offered Figure 17: Histogram of the average loads in loads in 1,000 basic Poisson resamplings. 1,000 byte-driven Poisson resamplings.
Using this fact, we may consider that modifying the load offered by T´ can be achieved by simply changing the value of �. However, this method is unstable with respect to load as Figure 15 illustrates. In order to be able to study a very large number of trace resamplings (1,000 in the plot) without running in the testbed, the average offered load of the UNC outbound link is computed using the formula l ´ = s´/d´, where s´ is the total ADU size, given by s� =
�
�aj +
c �initiators j
�
�b j .
(1)
c �acceptors j
Figure 15 shows a “+” symbol for each of the 1,000 trace resamplings, which are all clustered around 1.41 millions of connection vectors. The important observation, also illustrated with the histogram in Figure 16, is that, despite the very similar number of connection vectors in each resample, because of the heavy tails in the ADU size distributions, the range of offered load is very wide. This makes the basic Poisson resampling approach unreliable for scaling the offered load in a predictable manner. A researcher that wished to explore a range of workloads would be forced to repeat the resampling over and over until the desired load is achieved. In order to address this problem, we propose bytedriven Poisson resampling. Here the resampling has two steps: (1) construct a sample of connections by randomly choosing connections from T until s´ is equal to the intended duration d´ times the intended offered load l ´, and (2) assign start times by iteratively sampling
pling an exponential with mean d´/m where m is the number of connections in the sample constructed in the first step. This approach results in a T´ with connection that arrive according to Poisson arrival, but the offered load is far more predictable, as Figures 15 and 17 demonstrate. Figure 18 shows results from 12 testbed experiments in which 1-hour resampled traces (T´s) were replayed. The achieved offered loads, which include both payloads and packet header overhead, were very close to the intended values, demonstrating the benefits of our byte-driven Poisson resampling method. The goal of our second resampling method, Block resampling, is to preserve the observed long-range dependence in connection arrivals shown in Figure 14. The key idea is to sample blocks of time rather than individual connections, as performed in the Moving Block Bootstrap method [6]. Given a trace T = {(Ti, Ci, Ni)}, we divide it in blocks of duration �, so the first block B1 groups together connections started in [0, �), the second block B2 those in [�, 2�), and so on. The resampled trace is obtained by concatenating randomly chosen blocks, and adjusting the start time of connections by the offset of the new block location. For example, if the random selection put block B2 as the first block of T´, the start of the connection vectors in this block are set to Ti – �. Choosing the block duration � can be a difficult problem [6]. In our case, we found a clear trade-off between the amount of long-range dependence preserved by the block resample and the block duration. The shorter the block duration, the larger the number of trace resamplings
intended load is not a multiple of the load in T, T´ is constructed in two steps. First, we put a superposition of blocks in T´ with as many blocks as possible without exceeding the target load. Second, we combine this trace with another block-resampled trace that has been thinned in such a manner that the combined load of the two traces matches the intended load. We can therefore achieve any intended load with this resampling method, so it is as flexible as our first resampling technique. As in the case of Poisson resampling, we could try to perform thinning by assuming a good correlation between the number of connections and the offered load, but the variance would be too high (the lesson illustrated in Figures 15-17). Consequently, we propose to drive the thinning using Eq. 1, so our final resampling technique is byte-driven block resampling. Figure 21 shows the result of several testbed experiments with block-resampled traces. The achieve loads are very good approximations of the intended target offered loads.
that can be performed from the same trace. However, if the duration of the blocks is too small, the resampled process of connection arrivals exhibits a scaling structure that does not resemble that of the original trace. Figure 19 shows the logscale diagrams of the connection arrivals of the UNC 1 PM trace and five block-resamples where the block duration was 1 second. There is a clear and consistent flat region after octave 8, which shows that blocks of 1 second are inadequate for preserving the long-range dependence of the connection arrival process. Our systematic exploration of the block duration revealed that durations above 30 seconds perform very well. This is illustrated in Figure 20 where the resamplings were performed with blocks of duration equal to 1 minute. Block resampling makes it possible to construct a T´of arbitrary duration but it does not provide a method for adjusting the load precisely. In order to perform this task, we can rely on thinning the blocks when the offered load of T is above our intended offered load, and on thickening when the offered load is below our intended offered load. Thinning involves randomly removing connections from T´. Theoretical work has shown that thinning of a long-range dependent process does not change the scaling of the process [10], and our own experimentation is consistent with this result. Thickening is performed by superimposing more than one block from T. If the intended offered load is two times the original load, a superposition of pairs of randomly-chosen blocks from T is required to make T´ reach that load. If the 180
150
130
110
2.56
10.24
40.96
secs.
0.04
9
7
5
0.16
0.64
2.56
10.24
40.96
secs.
UNC 1 PM Conn. Arrivals 1−Minute Block Resample 1 1−Minute Block Resample 2 1−Minute Block Resample 3 1−Minute Block Resample 4 1−Minute Block Resample 5
8
6
2
120
0.64
log2 Variance(j)
7
140
0.16
UNC 1 PM Conn. Arrivals 1−Second Block Resample 1 1−Second Block Resample 2 1−Second Block Resample 3 1−Second Block Resample 4 1−Second Block Resample 5
8
160
log Variance(j)
Achieved Offered Load in Mbps
0.04
9
Testbed Experiments Byte-Driven Poisson Resampling Target Scaling Curve
170
One interesting question is whether the effort to preserve the scaling of the connection arrival process has any effect on the generated traffic aggregate. The logscale diagrams of packet arrivals from several testbed experiments with resampled traces are compared to that of UNC 1 PM in Figures 22 and 23. Both resampling methods achieve very close approximations of the packet scaling found in the original trace. In other words, for long-range dependence in the packet arrival process, the simpler Poisson resampling method performs as well as the more elaborate block resam-
6
5
4
4
3
3
100 90 90
100
110
120
130
140
150
160
170
180
Target Offered Load in Mbps
2
2
Figure 18: Average offered loads in the testbed replay of 12 Poisson resamplings. 180
24 22
0.04 0.16 0.64 UNC 1 PM Block Resampling 1 Block Resampling 2
2.56
10.24
40.96
secs.
22
20
18 16
2
130 120
14
0.04 0.16 0.64 UNC 1 PM Poisson Resampling 1 Poisson Resampling 2 Poisson Resampling 3
2.56
10.24
40.96
secs.
18
log2 Variance(j)
140
4 6 8 10 12 j = log2(scale) −− Connection Arrivals
Figure 20: Wavelet spectra of connection arrivals in 5 block resamplings (� = 1 m.).
20
150
2
14
160
log Variance(j)
Achieved Offered Load in Mbps
4 6 8 10 12 j = log2(scale) −− Connection Arrivals
Figure 19: Wavelet spectra of connection arrivals in 5 block resamplings (� = 1 s.).
Testbed Experiments Byte-Driven Block Resampling Target Scaling Curve
170
2
14
110
16
14
12
12 100
10
10
90 90
100
110
120 130 140 150 Target Offered Load in Mbps
160
170
180
Figure 21: Average offered loads in the testbed replay of 8 block resamplings.
8
2
4 6 8 10 12 j = log2(scale) −− Packet Arrivals
14
Figure 22: Wavelet spectra of packet arrivals in the outbound direction.
8
2
4 6 8 10 12 j = log (scale) −− Packet Arrivals
14
2
Figure 23: Wavelet spectra of packet arrivals in the outbound direction.
pling method. This is a confirmation, using a closed-loop traffic generation approach, of the result in [11] obtained using open-loop semi-experiments. Other metrics (and experimental results) may, however, be influenced by the long-range dependence in the arrival of connections (e.g., arrival of flow state or cache misses at a router). This longrange dependence of connection arrivals is preserved for precisely scaled loads only by using the byte-driven block resampling method.
6. Summary The quality of an experiment is only as good as the quality of its inputs. A key issue is the problem of generating realistic synthetic workloads to drive a simulation or a laboratory/testbed experiment. We have developed an empiricallybased approach to workload generation. Starting from a trace of TCP/IP headers on a production network, a model is constructed for all the TCP connections observed in the network. The model, a set of a-b-t connection vectors, can be used in workload generators (such as tmix) to replay the connections and reproduce the application-level and packetlevel behaviors observed on the original network. There are four fundamental requirements that are satisfied jointly by this approach: • Closed-loop mechanisms (e.g., TCP with ECN) can be evaluated because workload inputs occur at the application layer and all end-to-end effects can be in play during an experiment. • The complete mix of applications using a network can be represented in an experiment. • Empirically determined network-dependent parameters (e.g., per-flow RTTs) can be combined with application workloads to create high-fidelity reproductions of linklevel packet traffic. • Workload randomizations and packet load scaling can be accomplished with proven statistical properties. For these reasons, we believe this work holds the potential to improve the level of realism in network simulations and laboratory or testbed experiments.
7. Acknowledgements This work was supported in parts by the National Science Foundation (grants CCR-0208924, EIA-0303590, and ANI0323648), Cisco Systems Inc., and the IBM Corporation.
8. References [1] P. Barford, M. E. Crovella, A Performance Evaluation of HyperText Transfer Protocols, ACM SIGMETRICS ’99. [2] L. Breslau, D. Estrin, K. Fall, S. Floyd, J. Heidemann, A. Helmy, P. Huang, S. McCanne, K. Varadhan, Y. Xu, and H. Yu, Advances in Network Simulation, IEEE Computer, 33(5): 59-67, May 2000. [3] M. Crovella, and A. Bestavros, Self-Similarity in World Wide Web Traffic: Evidence and Possible Causes, IEEE/ACM ToN, 5(6): 835�46, Dec. 1997. [4] The DAG Project, http://dag.cs.waikato. ac.nz. [5] P. Danzig, S. Jamin, R. Caceres, D. Mitzel, and D. Estrin, An Empirical Workload Model for Driving Wide-Area TCP/IP Network Simulations, Internetworking: Research and Experience, 3(1): 1�26. [6] B. Efron and R. Tibshirani, An Introduction to the Bootstrap. Chapman & Hall, 1993. [7] Feldmann, P. Huang, A.C. Gilbert, and W. Willinger, Dynamics of IP traffic: A study of the role of variability and the impact of control, Proc. ACM SIGCOMM 1999. [8] S. Floyd, and V. Paxson, Difficulties in Simulating the Internet, IEEE/ACM ToN, vol. 9, no. 4, August 2001, pp. 392�403. [9] D. Heyman, and T.V. Lakshman, Source Models for VBR Broadcast Video Traffic, In IEEE/ACM ToN, vol. 4, no 1, pp. 37�46, Feb. 1996. [10] N. Hohn, D. Veitch, Inverting sampled traffic, Proceedings of ACM SIGCOMM IMC 2003 [11] N. Hohn, D. Veitch, and P. Abry, Does fractal scaling at the IP level depend on TCP flow arrival processes?, Proc. ACM SIGCOMM IMW 2002 [12] B. Mah, An Empirical Model of HTTP Network Traffic, Proc. IEEE INFOCOM ‘97. [13] M. Mena, and J. Heidemann, An Empirical Study of Real Audio Traffic, Proc. IEEE INFOCOM 2000. [14] V. Paxson. Empirically Derived Analytic Models of WideArea TCP Connections, IEEE/ACM ToN, 2 (4) 316-36, August 1994. [15] L. Rizzo, Dummynet: A simple approach to the evaluation of network protocols, ACM CCR, Vol. 27, No. 1, January 1997, pp. 31-41. [16] F.D. Smith, F. Hernández-Campos, and K. Jeffay. What TCP/IP Protocol Headers Can Tell Us About the Web, Proc. ACM SIGMETRICS ’01, pp. 245-256. [17] J. Sommers and P. Barford, Self-Configuring Network Traffic Generation, Proceedings of ACM SIGCOMM IMC 2004, pp. 68-81. [18] D. Veitch, Code for the Estimation of Scaling Exponents, http://www.emulab.ee.mu.oz.au/ ~darryl. [19] K.V. Vishwanath, A. Vahdat, Realistic and Responsive Network Traffic Generation, ACM SIGCOMM ’06, pp. 111-122. [20] M. C. Weigle, P. Adurthi, F. Hernández-Campos, K. Jeffay, F. D. Smith, “Tmix: a tool for generating realistic TCP application workloads in ns-2”, ACM SIGCOMM Computer Communication Review, Vol. 36, No. 3, July 2006, pp. 65-76 [21] http://tcpreplay.sourceforge.net/