Journal of Advances in Mathematics and Computer Science 24(2): 1-14, 2017; Article no.JAMCS.34591 Previously known as British Journal of Mathematics & Computer Science ISSN: 2231-0851
Modeling and Simulation of the Population Dynamics of Biomphalaria tenagophila, Snails in Tres Palmeras, Salta, Argentina ∗
Juan Carlos Rosales1,2 and Dora A. Davies3 1 Department of Mathematic, Faculty of Exact Sciences, National University of Salta, Argentina. 2 EPIFISMA, Epidemiolog´ıa e Fisiolog´ıa Matem´ atica, IMECC, UNICAMP, Brasil. 3 School of Biology for Studies of the Diversity of Invertebrates, Faculty of Natural Sciences,
National University of Salta, Argentina. Authors’ contributions This work was carried out in collaboration by both authors. Author JCR designed the mathematical study, performing statistical analysis, writing algorithms and writing the first draft of the manuscript. Author DAD designed the biological study, collecting samples, disecting specimens in the laboratory and making biological observations. Authors JCR and DAD analyzed results and agreed in the final version version of the manuscript. Article Information DOI: 10.9734/JAMCS/2017/34591 Editor(s): (1) Mohd Zuki Salleh, Universiti Malaysia Pahang, Malaysia. (2) Paul Bracken, Department of Mathematics, The University of Texas-Pan American Edinburg, TX 78539, USA. Reviewers: (1) Weiming Wang, Huaiyin Normal University, China. (2) Pinar Okyay, Adnan Menderes University, Turkey. (3) E. J. Allen, Texas Tech University, United States. Complete Peer review History: http://www.sciencedomain.org/review-history/20673
Received: 1st June 2017 Accepted: 17th August 2017
Original Research Article
Published: 25th August 2017
Abstract Aims/ objectives: We have analyzed the parasitic infections, and the population dynamics of Biomphalaria tenagophila snails. The population under study lives in water bodies formed by tributaries of the river Arias in the Tres Palmeras zone in Salta, Argentina. Study Design: Longitudinal and Cross-sectional studies. Place and Duration of Study: Department of Mathematic and School of Biology for Studies of the Diversity of Invertebrates. National University of Salta, Argentina, from January 2005 to December 2007.
*Corresponding author: E-mail:
[email protected];
Rosales and Davies; JAMCS, 24(2): 1-14, 2017; Article no.JAMCS.34591
Methodology: Samples were collected at least twice per season in the period under study, and taken to the laboratory for further analysis. Snails were observed daily during 7 days to detect emergence of cercariae. In negative cases, snails were dissected to search for hidden infections. Data was analyzed using the techniques of power spectrum, exploratory analysis, and estimation of parameters by linear fit for a logistic model. Simulation tests were also carried out in order to qualitatively describe the present dynamic model. Results: The highest prevalence corresponded to Echinostomatidae gen sp. III (2.99%), followed by Australapatemon magnacetabulum (1.44 %), while no infections by Schistosoma mansoni were found. Data showed that the most important infection frequencies were detected in the following order: 12, 18 and 3 months. Density-dependent parameters for the net growth rate were estimated as r ≈ 0.32, s ≈ 2.07. The corresponding carrying capacity was K ≈ 1069 for the annual case. Conclusion: The most important frequency being at 12 months was the parameter that best described the situation observed in the field. This frequency could explain the annual variation, and the opportunistic growth pattern of the species. The function corresponding to density-dependent net growth rate provides an estimation of the growth coefficient and so-called “crowding coefficient”. However, data showed oscillations in the fit curve. The same pattern was observed in the simulations that would be explained with the generalized logistic model. Another possible explanation for the oscillations would be a sinusoidally-variable carrying capacity. Moreover, simulations described qualitatively the annual population dynamics. Keywords: Models theoretical; simulation; helminthology; snail; Biomphalaria tenagophila; prevention; control.
&
2010 Mathematics Subject Classification: 62P10, 92B05, 92D30, 92D25.
1
Introduction
Snails species Biomphalaria tenagophila (d’Orb., 1835) from Argentina are potential vectors of schisto-somiasis. This species is susceptible to Schistosoma mansoni infection, according to studies performed with populations of B. tenagophila from the Argentinean province Corrientes, and in Brazil with strains SJ2 of S. mansoni. Moreover, B. tenagophila has a wide distribution, from southern Brazil and Argentinean Mesopotamia to the area of the present study [1][2][3][4][5][6][7]. From all the vector-borne diseases, schistosomiasis has the broadest distribution. It is associated with poor nutritional status, and poor school performance. Intestinal schistosomiasis can cause abdominal pain, diarrhea, blood in stools, liver and spleen enlargement, fluid in the peritoneal cavity and hypertension in the abdominal blood vessels [8].
1.1
Situation in South America and local situation
From the five species of schistosome that affect humans, only S. mansoni is endemic in South America, being recorded in Brazil, Suriname and Venezuela [9]. In Brazil there are endemic foci in the southern states of Parana and Santa Catarina, which are also bordering with Argentina, and Paraguay. However, in Argentina, Uruguay and Paraguay epidemiological surveys carried out until 2007 showed that there was no active transmission, nor have been reported any recent human cases [5][10]. Snails of B. tenagophila are distributed in the Province of Salta (PS), Argentina, and so far they have not been found infected with S. mansoni in surveys carried out in the area known as Tres Palmeras (TP) [6][7]. This area is located in the southwest of Salta city, where two tributary streams flow into the river Arias. These rivers and streams flood periodically, and form water bodies where snails were collected. TP site is easily accessible for residents of the surrounding areas; therefore, human activities influence the dynamics of biotic and abiotic components of the ecosystem. TP represents
2
Rosales and Davies; JAMCS, 24(2): 1-14, 2017; Article no.JAMCS.34591
an area of risk to human health, because human populations living nearby show low socioeconomic status, and lacks adequate health infrastructure [11]. In summary, new environmental conditions caused by climate change, added to absence of adequate sanitary control in susceptible areas, and regular migration between countries could favor transmission of vector-borne diseases, particulary schistosomiasis.
1.2
Scope and objectives
The key concept in designing parasite control strategies is that the populations involved are dynamic [12]. Since B. tenagophila is an intermediary host of several parasites, one of which is of interest to human health, it is necessary to increase knowledge about population dynamics of this particular snail. To that aim we tried to determine parameters that can be useful for mathematical tools, and models. Also determine and improve knowledge of macroparasites that employ B. tenagophila as vector in TP zone. In this work, we investigated the prevalence of infection of different parasites in B. tenagophila snails collected monthly in TP from 2005 to 2007, focusing on their temporal variation. Results provided elements and parameters for modeling, and simulating seasonal dynamics. The number of cumulative snails allowed us to estimate the total population of snails in their habitat throughout a year. In turn, this figure enabled an estimation of the growth rate and overcrowding of these populations per year, based on the three years of sampling. Freshwater snails survive drought periods by burying themselves in the substrate, retracting into their shell and entering quiescence [13]. In the laboratory we have estimated that the snails survived 18 months on average (unpublished data), so for a typical year this could be considered a very low mortality rate. Therefore, we propose the hypothesis that during the months in which the lowest number of snails was collected most of the snails of the previous months remained buried in the mud. The curve fits obtained are considered models that allow a qualitative description of population dynamics of B. tenagophila in TP. These results provide the ground from which estimation of parameters to describe these populations and their parasites can be improved. Ultimately, the models and mathematical tools presented here can set the basis to implement control and prevention measures for residents of areas with high risk of snail-borne diseases.
2 2.1
Materials and Methods Sampling site
Tres Palmeras (24◦ 47’ 33” S, 65◦ 28’ 14” W) SW of Salta city, is located in Lerma Valley, Province of Salta, between the Sub-Andean mountains and the eastern saws, about 1,200 meters above sea level. The area is furrowed by San Lorenzo River, and some streams that are tributaries of Arias River. Its climate is subtropical with a dry season from May to October, maximum rainfall in summer at an average of 805 mm per year, measured in the nearby town of Las Costas (period 2000-2002). The annual average temperatures range between 11.2 ◦ C and 24 ◦ C.
2.2
Samplings and procedures
Samples were taken from TP at least twice per season from January 2005 to December 2007, employing hand nets ( mesh 1 mm ) during one hour. Collected snails were packaged in containers with wet paper, and transported to the laboratory where they were placed in receptacles with 5 ml of unchlorinated water. Snails were observed daily for 7 days to detect emergence of cercariae and, in negative cases, the snails were dissected to detect hidden infections. Snails were collected under permission N◦ 280 (2007) from Departament of Environmental and Sustainable Development of Salta Province (Secretar´ıa de Medio Ambiente y Desarrollo Sustentable de la Provincia de Salta).
3
Rosales and Davies; JAMCS, 24(2): 1-14, 2017; Article no.JAMCS.34591
2.3
Mathematical modeling
Population behavior studies can be carried out by using a time-series technique called spectral analysis. This analysis determines the presence of cycles by splitting the variance of series into different parts. Each part is a measure of its contribution of specific frequency of occurrence to the whole pattern. An important consequence is that the sum of these measures over all possible was frequencies is equal to the variance of series [14]. Estimation of cycles frequencies, ω = 2π T performed using the technique of the power spectrum. Contributions of specific frequencies that determine the cycles were assessed, allowing characterization of seasonality. In addition, tools data exploratory analysis allowed some descriptions thereof. The empirical distribution of cumulative frequency was obtained. We will not discuss here the associated probabilistic space, (Ω, A, P), to the random experiment ε, however we precise the sample space and the random variable corresponding in the following definition. Definition: Let (Ω, A, P) a probabilistic space associated to random experiment ε, with Ω = {ωi | i = 1, 2, ..., 12; ω1 = January , ..., ω12 = December}, January = “ monthly average of snails collected in water bodies of TP in the month of January ”, ..., December = “monthly average snails collected in water bodies of TP in the month of December” and let X a discrete random variable defined by X : Ω → R, ωi 7→ X(ωi ) = i, i number corresponding to month of year in that occurred the event ωi . Carrying capacity K was estimated by the Ford-Walford method [15][16]. Other parameters were estimated by linear fit for logistic model, a solution of the differential equation { dSc = f (Sc )Sc dt (2.1) Sc (0) = Sc0 where Sc , represents the number of accumulated snails collected in each sampling, the function f represents the net growth rate, density dependent. If f (Sc ) = r = constant > 0, the exponential model or Malthus’s model is recovered, r denote the intrinsic rate of natural increase for growth with unlimited resources. If f (Sc ) = r − sSc , with s > 0, we have the Verhulst-Pearl model known as the logistic equation [14][17]. The parameters are then obtained for the stochastic version based on the methodology developed for general birth-death processes in reference [14]. The logistic fit for the empirical cumulative distribution for the number of snails collected, provides rates that can be used to simulate a stochastic process, type birth - death (see methods in reference [14]), in order to qualitatively describe the population dynamics of snails collected in TP. Following Renshaw [14], in general, birth-death process has a general equation that is dSc = B(Sc ) − D(Sc ) dt
(2.2)
where B(Sc ) and D(Sc ) are a general birth rate, and general death rate, respectively. Under logistic growth B(Sc ) should decrease and D(Sc ) should increase: as Sc increase, so B(Sc ) = (a1 − b1 Sc )Sc and D(Sc ) = (a2 + b2 Sc )Sc , with a1 , a2 , b1 , b2 ∈ R+ , then (2.2) result in dSc = [(a1 − a2 ) − (b1 + b2 )Sc ] Sc = f (Sc )Sc (2.3) dt by direct comparison of equation (2.1) and equation (2.3), with f (Sc ) = (r − sSc ), we have to r = a1 − a2
(2.4)
s = b1 + b2
(2.5)
and so the carrying capacity K=
a1 − a2 r = s b1 + b2
(2.6)
4
Rosales and Davies; JAMCS, 24(2): 1-14, 2017; Article no.JAMCS.34591
For a small time increment ∆t, the equation (2.1) provides the following approach Sc (t + ∆t) − Sc (t) ≃ (r − sSc )Sc ∆t
(2.7)
To turn this into a stochastic equation, consider that the random population change in ∆t result X(t + ∆t) − X(t) = [r − sX(t)] X(t)∆t + ∆Z
(2.8)
where ∆Z represents the noise component, with E(∆Z) = 0, [14][18][19]. If {X(t)} is centered around the mean value x, then taking expectations in (2.8) [
] rE(X(t)) − sE(X 2 (t)) ∆t = 0
(2.9)
as V arX(t) = E(X 2 (t)) − (E(X(t)))2 , then s (E(X(t))2 = rE(X(t)) − sV arX(t)
(2.10)
from where E(X(t) =
V arX(t) r − s E(X(t))
(2.11)
As E(X(t)) ≃ rs , then from this last expression an improved estimation could be obtained for the mean value b = r − s V arX(t) x s r
(2.12)
Renshaw [14], shows that an extension of this argument provides the approach V arX(t) ≃
s(a1 + a2 ) − r(b1 − b2 ) 2s2
(2.13)
The expressions, (2.4), (2.5),(2.6), (2.12) and (2.13) allow the estimations of the parameters for the rates B(Sc ) and D(Sc ), according to the different situations that could arise. This rates are used for the simulations. Implementations of methods and algorithms for the simulations, Monte Carlo type, were similar to those developed by Rosales et. al. [20]. In order to describe the seasonality observed in the period under study, results obtained with the simulation were modulated by type functions P (a, ω, α, t) = a + sin(ωt − α)
(2.14)
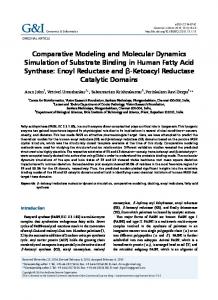
with a , ω, α the parameters to be estimated. The parameter a corresponds to the monthly average of snails collected in the samples, ω correspond to one of the frequencies estimated as indicated above. The parameter α describes the phase shifting, corresponding to 1, 2, 3, 4, 5 and 6 months, in turn estimated from the samples data by simulation, based on the best qualitative descriptions obtained. Finally t represents the time variable whose unit of measure is month. Finally, two numerical examples were incorporated in order to show how a Sine wave of a certain period was merged with the simulation. In fact, Fig. 1 is nothing more than a Sine wave multiplied by a function X(t); similar to the technique widely used in modulation of amplitude of signals and wavelets [21].
5
Rosales and Davies; JAMCS, 24(2): 1-14, 2017; Article no.JAMCS.34591
X(t)
X(t)
1.5
20 15
1
10 0.5 0
5 0
0.5
1
1.5
2
0
0
0.5
P(t) 1.4
1.2
1.2
1
1
0.8
0.8 0.5
1
1.5
2
1.5
2
1.5
2
P(t)
1.4
0
1
1.5
2
0
0.5
X(t) . P(t)
1 X(t) . P(t)
1.5
20 15
1
10 0.5 0
5 0
0.5
1
1.5
2
0
0
0.5
1
Fig. 1. Examples of the effect of the waves P (t) over the functions X(t)
3
Results
Table 1 shows the infection prevalence of different parasites found in B. tenagophila. Among the most prominent were Echinostomatidae gen sp. III (2.99%), and Australapatemon magnacetabulum (1.44%). No infections by Schistosoma were found. Table 1. Prevalence of taxa of digeneans parasitizing Biomphalaria tenagophila in Tres Palmeras during 2005, 2006 and 2007 years. N: Number of hosts examined
1 2 3 4 5 6 7 8 9 10
Prevalence Year Digeneans N Australapatemon magnacetabulum Trichobilharzia sp. Zygocotyle lunata Clinostomum sp. Magnivitellinum simplex Xiphidiocercaria sp. II Strigea sp. Echinocercaria sp. I Echinostomatidae gen. sp. III Echinostomatidae gen. sp. I∗ *: only metacercarial stage
2005 1046 1.72 0.19 0.09 0.38 0.09 0 0.19 0.09 6.79 0.86
2006 1066 1.97 0.28 0.47 0.56 0.28 0.47 0 0 1.97 0.84
2007 970 0.62 0.21 0.21 1.13 0.31 0.72 0 0 0.21 0
6
Rosales and Davies; JAMCS, 24(2): 1-14, 2017; Article no.JAMCS.34591
Number of snails
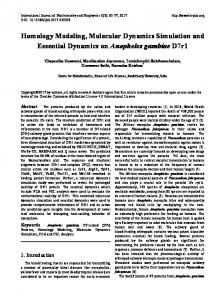
Fig. 2 top, shows the maximum and minimum number of snails collected in TP throughout the period of study on a monthly base. In 2005, the main maximum values were from samples taken in August and February, while the lowest were from July and September. In 2006 the maximum values occurred in June and December, with minimum in September and October. Finally, in 2007 the highest number of snails were recorded in April and March, and lowest numbers in August and September. In Fig. 2, middle, shows the periodogram of the samplings data and in the bottom of the same Fig. 2 illustrates the power spectrum with the more significant periods in order of importance: in this case being 11.66, 17.50 and 3.18. In turn, the 36 data points allowed the frequencies 2, 3, 4, 6, 9, 12 and 18, from which -based on the periods obtained previously- frequencies 12, 18 and 3 were chosen to be the most representative ones.
Monthly samples of snails Biomphalaria tenagophila, Tres Palmeras, Salta, Argentina. Period 2005−2007 400 200 0 2005
2006
2007 years Periodogram for monthly samples of Biomphalaria tenagophila
5
Power
15
x 10
2008
10 5 0
0
0.05 5
15
x 10
0.1
0.15
0.2
0.25 0.3 0.35 0.4 0.45 cycles/months Seasonals cycles from monthly samples of snails Biomphalaria tenagophila
0.5
Power
Period = 11.6667 10 5 0
0
5
10
15 20 Period (Months/Cycles)
25
30
35
Fig. 2. Top: Time series of Biomphalaria tenagophila specimens monthly sampled during 2005-2007 in the Tres Palmeras, Salta, Argentina. Middle: Periodogram of monthly samples. Bottom: Power spectrum
The box plot corresponding in Fig. 3, left, evidence that highest recorded value (312) was an outlier of the samples, since the highest admissible number of snails was 191. The interquartile range was [40 151.5], the parameters mean, median, were 98 and 96 respectively. In Fig. 3, right, depicts monthly data average throughout the studied period; and with maximum and minimum values corresponding to May and September respectively. Fig. 4 shows a periodic fit to the monthly average number of B. tenagophila. All data numbers from the studied period were used to model a typical year” that describes the observed pattern of )−(0.2122e+ population dynamics. This periodic fit, p(t) = (0.9891e+002)+(0.5762e+002) sin( 2πt 12 002) cos( 2πt ), could be used in the modulation of simulations, being helpful to clarify the problem 12 of constructing an appropriate model for the analyzed situation.
7
Rosales and Davies; JAMCS, 24(2): 1-14, 2017; Article no.JAMCS.34591
350 2005 2006 2007 Average
300 300 250 250
Number of Snails
Values
200
150
200
150
100 100 50 50
0 0
1 Column Number
2
4
6 8 Months
10
12
Fig. 3. Left: Boxplot of Biomphalaria tenagophila monthly samplings in Tres Palmeras. Right: Dynamics of the amount of snails throughout in three years of samplings, displaying the monthly data average Monthly average of snails Biomphalaria tenagophila and a periodic fit 200
180
Monthly average of snails 2005−2007 period
160
140
120
100
80
60
40
20
0
1
2
3
4
5
6 7 time (month)
8
9
10
11
12
Fig. 4. Monthly average of Biomphalaria tenagophila in Tres Palmeras (blue), and a periodic fit (red) for the situation analyzed
8
Rosales and Davies; JAMCS, 24(2): 1-14, 2017; Article no.JAMCS.34591
The coefficients of the function f (Sc ), were obtained from the monthly average fit of snail populations described above. In this case, coefficients resulted (r, s) ≈ (0.32, 2.07) and their carrying capacity 1.0687e + 003, from which K ≈ 1069 was estimated. Based on raw data average from samplings, the deterministic model for the cumulative frequencies of snails collected in the TP is Sc (t) =
1069 1 + e2.07 e−0.32 t
(3.1)
Fig. 5 Left: shows the model and the cumulative frequencies corresponding to the monthly average during the three years of sampling. Although the fit describes the situation for some months, in a more acceptable way than others, it provides qualitative descriptions of B. tenagophila growth rate as well as possible scenarios of carrying capacity. In turn, TP carrying capacity seems to be related to the variability of water volume in its water bodies where the specimens of snails were collected. This case corresponds to cross-study. Fig. 5 Right: shows simulations of the stochastic logistic version obtained from a particular random seed, Sc0 ∈ [140, 180]. The simulations were obtained with estimations of B(Sc ) and D(Sc ), general birth rate and general death rate respectively, according to B(Sc ) = ((3.2041e − 001) − (0.2070e + 001)Sc )Sc and D(Sc ) = ((4.1e − 004) + (1.0e − 006)Sc )Sc . Logistic model for Sc of snails B. tenagophila in Tres Palmeras
Simulations
1200
1200
1000
1000
800
800
600
600
400
400
200
200
0
5
10
15
20
0
5
10
15
20
Fig. 5. Left: The model (3.1) and the cumulative frequencies corresponding to the monthly data average during the three years of samplings. Right: Simulations of the logistic model (stochastic version) Fig. 6 shows simulations of the full period analyzed from a particular random seed, Sc0 ∈ [246, 250], of the stochastic logistic version. This case describe the longitudinal-study. The qualitative behavior is similar to that found in the deterministic case. In this case, estimates were not specified, showing only the qualitative descriptions obtained from the implemented algorithms (see discussion).
9
Rosales and Davies; JAMCS, 24(2): 1-14, 2017; Article no.JAMCS.34591
Fig. 7 shows eight simulated situations to qualitatively describe the annual dynamic displayed by the monthly data average, modulated by sinusoidal function a + sin(2 Tπ t) or a + sin( 2π t − π3 ), with T T = 12 and ω = 2π main frequency estimated by the power of the spectrum and a represents the T monthly average of snails. Simulations (blue lines) describe in some sense the stochastic component present in the monthly average throughout the year. These simulations follow qualitatively the pattern of the samplings, also accompanying the maximum and minimum values of monthly data averages (red line). Simulation
A Zoom In
4000
2700
3500 2650 3000 2600 2500
2000
2550
1500 2500 1000 2450 500
0
0
10
20
30
40
50
2400 22
23
24
25
Fig. 6. Simulations for the monthly samplings of snails collected in water bodies of the Tres Palmeras during 2005-2007 400
400
200
200
0
0 2
4
6
8
10
12
400
400
200
200
0
2
4
6
8
10
12
2
4
6
8
10
12
2
4
6
8
10
12
2
4
6
8
10
12
0 2
4
6
8
10
12
400
400
200
200
0
0 2
4
6
8
10
12
400
400
200
200
0
0 2
4
6
8
10
12
Fig. 7. Monthly average of snails population dynamics during the year based on data
10
Rosales and Davies; JAMCS, 24(2): 1-14, 2017; Article no.JAMCS.34591
collected for three years (2005-2007 in Tres Palmeras, period (Red line), accompanied by simulated realizations The obtained simulations described the annual pattern occurring in the area of study. It means that dynamics in the rainy season, during the months of completion of the dry season, and start of the rainy season are described acceptably. In the latter case, it was observed that the stochastic realizations were closely fit to the monthly average values of the raw data average.
4
Discussion
Fig. 2: above, showed that year 2005 was different from 2006 and 2007, which were more similar in their dynamics. The periodogram, and the power spectrum (Fig. 2 middle and below respectively) showed that the main frequency corresponds to a period of 12 months. The observed fluctuations corroborated the annual seasonality with period T = 12, which was evident in the samples’ dynamics when data from the three years was analyzed. The box plot, in Fig. 3 left, illustrated that the highest value of snails collected was an outlier; however, the slight bias towards higher values is in agreement with the opportunistic pattern of B. tenagophila population growth. The monthly data average depicted in Fig. 3 right, evidenced that B. tenagophila achieves its maximum population at the end of the rainy season (May), and its minimum at the end of dry season (September). Model (3.1) and its graph in Fig. 5, left, the stochastic model, Fig. 5 right, and Fig. 6, suggested that - based on the analysis made by Banks [17] of the logistic equation in its general form the most appropriate setting corresponds to a carrying capacity of sinusoidal type. Results in the present work points towards an oscillatory carrying capacity, because the water volume in the water bodies changes during dry and rainy seasons. The function of net growth rate, dependent density, f (Sc ) = 0.32 − 2.07Sc and the main frequencies ω1 = 2π/12 and ω1 = 2π/18, are estimates of importance to design models that attempt to describe the dynamics of infection in populations of B. tenagophila. This function may also help to discover the mechanisms that produce cyclic patterns or multiple stable states at the infection level in a host population, as pointed out by May and Anderson [22]. These parameters can be used to incorporate realism in mathematical models of interactions between hosts and parasites. In particular, these parameters are useful in models that show the presence of an infection that preserves and promotes diversity in such multispecies systems, as in the case presented by Preddy et. al. [23]. They can also be used in models with parameters to confirm that snail populations are regulated by nonlinear density-dependent mechanisms as suggested by Mangal et. al. [24]. Fig. 6 suggested that if sample frequencies were increased, the estimation of parameters could improve. From the biological point of view, this qualitative description (Fig. 6) possibly requires the incorporation of other hypotheses, reason why we did not specify the estimates (obtained). Simulations exemplified in Fig. 7, can be proposed as qualitative descriptions of stochastic, annual seasonality thus helping to describe B. tenagophila population dynamics during the three-year period under study. Results obtained for simulations of the annual case were better adjusted to raw data than simulations for the whole sampling period. However, they adjusted reasonably well only at the highest population densities, at the end of rainy season - which occurs every year. The importance of this type of numerical-computational analysis, as noted by Cornell [25], is that it allows to model events such as different stochastic processes; manipulating seeds, birth rates, mortality and varying relationships and / or ratios among them. In simulation models many other factors can easily be integrated, as indicated for example, in Keeling [26] and Hess [27]. These results could be complemented by studying the effect of seasonal rainfall and other environmental variables like temperature patterns, population density, and infection rate in order to verify whether there are inversely proportional relationships between them, such as in the study developed by OdongoAginya et. al. [28].
11
Rosales and Davies; JAMCS, 24(2): 1-14, 2017; Article no.JAMCS.34591
The population dynamics of B. tenagophila in Northwest Argentina was analyzed for the first time in the present work. In addition, no infection by S. mansoni was detected in the studied specimens. Next step of preventive actions, it could be the updating of existing data, and measuring the compatibility between Schistosoma and these intermediate hosts, as suggests by Borda and collaborators [29]. These authors obtained the Frandsen index to classify susceptibility of snails to different S. mansoni strains in three classes. We currently maintains B. tenagophila populations in our laboratory in order to assess mortality, oviposition, and to recreate some transmission cycles in snails parasitized by, for example Australapatemom magnacetabulum. Some results and detailed descriptions can be found in the references [7][30]. Barbosa et. al. [31] pointed out that Biomphalaria populations can satisfactorily be maintained under semi-natural conditions for at least 220 weeks. This method, they conclude, opens perspectives for other types of studies such as snail ecology, genetics and related subjects that are also important to estimate parameters for mathematical modeling and simulation.
5
Conclusions
In this work we have analyzed the population dynamics of B. tenagophila snails in Tres Palmeras. Among the most remarkable parasites infecting the snails were Australapatemon magnacetabulum (1.44%) and Echinostomatidae gen sp. III (2.99%), while no infections by Schistosoma mansoni were found. During the period under study (2005-2007), maximum and minimum population were registered in May and September respectively. Results showed that the most important frequency was at the 12 months. This frequency provided the best description of the situation, justifying the observed annual seasonal variation. The function f (Sc ) = r − sSc corresponding to net growth rate, density dependent, provided a good estimation of the growth coefficient r ≈ 0.32 and so-called “crowding coefficient” s ≈ 2.07. However, the data showed oscillations in the fit curve, which also appeared in the simulations. We propose that both can be explained with the generalized logistic model. Another possible explanation for the oscillations would be a sinusoidally-variable carrying capacity. Finally, its necessary to update B. tenagophila distribution to design actions and initiate adequate epidemiological surveillance for schistosomiasis in Salta Province. Our results highlight the need of designing actions to initiate adequate epidemiological surveillance in Salta province for snail-borne diseases. These actions should include annual sampling of snail populations to monitor for appearance of schistosomes, and avoid sewage efflux from nearby human dwellings into Tres Palmeras zone.
Acknowledgement We would like to thank to Dra. Carolina Davies for her help with English language. To reviewers for helpful comments on the manuscript. This work has been partially supported by CIUNSa Councils of Investigation of National University of Salta, Argentina.
Competing Interests Authors have declared that no competing interests exist.
References [1]
Borda CE, Rea MJF. Distribuci´ on geogr´ afica de Biomphalaria potencialmente transmisoras de la esquistosomiasis en las cuencas de los r´ıos Paran´ a y Uruguay. In: Programa e Resumos, II Congresso Latinoamericano de Malacologia. Porto Alegre: Epec´e Gr´ afica, Brasil; 1995.
[2]
Borda CE, Rea MJF. Susceptibilidad de Biomphalaria tenagophila de las cuencas de los r´ıos Paran´ a y Uruguay a Schistosoma mansoni. Revista Panamericana de Salud P´ ublica/Panamerican American Journal Public Health. 1997;1(3):167-173.
12
Rosales and Davies; JAMCS, 24(2): 1-14, 2017; Article no.JAMCS.34591
[3]
Borda CE, Rea MJF. Intermediate and definitive hosts of Schistosoma mansoni in Corrientes province, Argentina. Memorias del Instituto Oswaldo Cruz. 2006;101(1):233-234.
[4]
Borda CE, Rea MJF. Biomphalaria tenagophila potential vector of Schistosoma mansoni in the Paran´ a River basin (Argentina and Paraguay). Memorias del Instituto Oswaldo Cruz. 2007;102(2):191-195.
[5]
Borda CE, Rea MJF. Susceptibility and compatibility of Biomphalaria tenagophila from the R´ıo de la Plata basin with Schistosoma mansoni from Brazil. Memorias del Instituto Oswaldo Cruz. 2010;105(4):496-498.
[6]
Rumi A, Guti´errez Gregoric DE, N´ un ˜ez V, Darrigran GA. Moluscos de agua dulce de Argentina. Revista de Biolog´ıa Tropical; 2008;56(1):77-111.
[7]
Davies DA. Digenea (Trematoda, Plathelminthes) par´ asitos deBiomphalaria spp., en el Valle de Lerma, provincia de Salta. Universidad Nacional de Salta, Salta, Argentina Ph. D thesis; 2014.
[8]
World Health Organization (WHO). A global brief on vector-borne diseases. 2014. Document number: WHO/DCO/WHD/2014.1. (Last accessed on 07 July 2016). Available: www.who.int.
[9]
Utroska JA, Chan MG, Dixon E, Yoon, et. al. An estimate of global needs for praziquantel within schistosomiasis control programmes. Geneva: World Health Organization, Division of Control of Tropical Diseases. 1989;92.
[10] Paraense WL. Distribu¸cao dos caramujos no Brasil. En: Reis F-A. Faria I-I. Katz N. Modernos conhecimentos sobre esquistossomose mansˆ onica, Belo Horizonte. Academia Mineira de Medicina. (Suplemento, Anais da Academia Mineira de Medicina, 1983-1984). 1986;1:117-128. [11] Pellegrino J, Borda CE, Valetti JA, Dibetto J. Observa¸coes sobre provas imuno-serol´ ogicas para esquistossomose mansoni realizadas em habitantes das provincias de Corrientes y Misiones, Argentina. Revista del Instituto de Medicina Tropical S˜ ao Paulo. 2008;10:277-286. [12] Medley GF. Parasitic and infectious diseases. Epidemiology and Ecology. Chapter 12, Chemoterapy. Academic Press; 1994. [13] Strachan SR, Chester ET, Robson BJ. Freshwater invertebrate life history strategies for surviving desiccation. Springer Science Reviews. 2015;3(1):57-75. [14] Renshaw E. Modelling Biological populations in space and time. Cambridge University Express; 1991. [15] Walford LA. A new graphic method of describing the growth of animals. Biology Bulletin. 1946;90:141-147. [16] Leveque C, Pointier JP. Study of the growth of Biomphalaria glabrata (Say) and other Planorbidae in Guadeloupe (West Indies). Annals Tropical Medicine and Parasitology. 1976;70(2):199-204. [17] Banks RB. Growth and diffusion phenomena. Mathematical Frameworks and Aplications. Texts in Applied Mathematics. Springer-Verlag; 1994. [18] Chatfield C. The analysis of time series. An Introduction. Edition. Chapman& Hall CRC; 1995. [19] Brockwell PJ, Davies RA. Introduction to time series and forescasting. Second Edition. Springer-Verlag; 2002.
13
Rosales and Davies; JAMCS, 24(2): 1-14, 2017; Article no.JAMCS.34591
[20] Rosales JC, Avila Blas OJ, Yang HM. Monte Carlo simulation of American Tegumentary Leishmaniasis epidemic. The case in Or´ an, Salta, Argentina. 1985-2007. Applied Mathematical Sciences. 2017;11:1-14. Doi: 10.12988/ams.2017.610255 [21] Torrence C, Compo GP. A practical guide to wavelet analysis. Bulletin American Meteorology Society. 1998;79(1):61-78. [22] May RM, Anderson RM. Population biology of infectious diseases: 1979;280:455-461.
Part II. Nature.
[23] Preedy KF, Schofield PG, Chaplain MAJ, Hubbard SF. Disease induced dynamics in hostparasitoid systems: chaos and coexistence. Journal of Royal Society Interface. 2007;4:463-471. Doi: 10.1098/rsif.2006.0184 [24] Mangal T-D, Paterson S, Fento A. . Effects of snail density on growth, reproduction and survival of Biomphalaria alexandrina exposed to Schistosoma mansoni. Journal Parasitology Research. 2010;6. Article ID 186792, 6. Doi:10.1155/2010/186792 [25] Cornell SJ. Modelling stochastic transmission processes in helminth infections. Lande Biosciences. 2010;Charpter 5. [26] Keeling MJ. The effects of local spatial structure on epidemiological invasions. Proccedings Royal Society London B. 1999;266:859-867. [27] Hess G. Disease in metapopulation models: 1996;77:1617-1632.
Implications for conservation. Ecology.
[28] Odongo-Aginya EI, Kironde FK, Kabatereine NB, Kategere P, Kazibwe F. Effect of seasonal rainfall and other environmental changes, on snail density and infection rates with Schistosoma mansoni fifteen years after the last snails’ study in Kigungu, Entebbe, Uganda. East African Medicine Journal. 2008;85(11):556-63. [29] Borda CE, Rea MJF, Mosqueda LA, Ben´ıtez OD. Compatibilidad de poblaciones de Biomphalaria tenagophila, de la cuenca del R´ıo Paran´ a a la cepa SJ2 de Schistosoma mansoni del Brasil. In: Comunicaciones Cient´ıficas y Tecnol´ ogicas, M-077. Universidad Nacional del Nordeste, Argentina; 2003. [30] Rosales JC, Davies DA, Yang HM, Ostrowski de N´ un ˜ez M. Efectos de variaciones de la tasa de infecci´ on en la prevalencia de Australapatemon sp en Biomphalaria tenagophila en la zona Tres Palmeras, Salta, Argentina. Actas Academia Nacional de Ciencias. 2008;XIV:135-142. ISSN 0325-7533 [31] Barbosa FS, Sanches O, Barbosa CS, Arruda F. Dynamics of snail populations of Biomphalaria glabrata and B. straminea under Semi-Natural Conditions. Cadernos de Sa´ ude P´ ublica. 1997;8(2):157-167. ——————————————————————————————————————————————– c 2017 Rosales and Davies; This is an Open Access article distributed under the terms of the Creative ⃝ Commons Attribution License (http://creativecommons.org/licenses/by/4.0), which permits unrestricted use, distribution, and reproduction in any medium, provided the original work is properly cited.
Peer-review history: The peer review history for this paper can be accessed here (Please copy paste the total link in your browser address bar) http://sciencedomain.org/review-history/20673
14