International Journal of Multidisciplinary Engineering in Current Research Volume 1, Issue 1, September 2016, http://ijmec.com/
Modeling of Flow/Sediment Input at Delta Head of Rivers in Odisha, India Siba Prasad Mishra Dept of Civil Engineering, Centurion University and Technology and Management, Management Jatani, Bhubaneswar,Odisha, India: PinPin 752050, (Mob-9438668332) 9438668332)
[email protected] Abstract: Odisha, a state in the East coast of India, allows six east flowing major river systems, i.e. the Subarnarekha,the Budhabalanga, the Baitarani, the Bramhani, the Mahanadi and the Rushikulya debouching into the Bay of Bengal .The Mahanadi being ng the largest river have reduced average annual flow of 47.97 Bcum from 66.88 Bcum and average annual suspended sediment load 11.34MMT from 27.07MMT at its delta head, Naraj. The statistical study of the trend analysis of flow and sediment of the six rivers has been tried in the present paper. The regression analysis of the flow data (25 25 years) years and sediment data (20 years) have been conducted. The fitting of polynomial, peak, sinusoidal, waveform, power and rational functionsto functions the data series was tried forr the best curve fitting considering the highest coefficient of determination (R2). ). It is observed that 63% of flows of rivers in Odisha follow rational functions. The common Gumbel and Log-Pearson Pearson Type III probability distribution functions have been used to estimate annual flow and accompanying suspended sediment load at the delta head of the rivers along Odisha coast. The statistically estimated annual flow and sediment were calculated at various return periods and compared. It is found that at lower return urn periods the Gumbel methods are suitable and for higher recurrence periods Log Pearson Type III methods give better result. Sustenance measures to reduce flood havoc have been worked out to rejuvenate the sink of the deltas
fed by Southwest monsoon during June to October. The average precipitation of the state is 1450mm in average 78rainy days. The average Monthly evapo-transpiration evapo of the basin is 40mm in winter and 300mm 30 in summer. The basins in north Odisha were of pre-Cambrian pre origin. They were originateddue to volcanic, tectonic activities. The rivers flow along the easterly slope. The rocks in the area are formations of Archean to recent. The consolidated rocks are ar igneous and crystalline, semi-consolidatedformations semi of Archean to recent. They are upland, the river valleys and subdued Plateaus. The 75m contour line delimits the coastal deltaic range from the middle mountainous region. The consolidated rocks are igneous ign and crystalline, semiconsolidated. They are formations of old and recent of both Gondwana and alluvium. Geographically the state has five physiographic units i.e. the coastal Plains, the middle mountainous country, the rollingclastic sediments of Eastern Indian Tectonic Zone (EITZ), North Singhbhum Mobile Belt (NSMB), and eastern fringe of Chhotanagpur Genesis (CGC).They (CGC) have formed the basin of the rivers from Subarnarekha to southern fringe of Mahanadi delta. The southern part of the Mahanadi and Rushikulya basins resembles the traits of Eastern Ghats Hills and 850 ridges with a shallow shore. Nayak et al (2012)[1], (2012) Mishra et al (2015)[2].
Key words: Mahanadi, Discharge, arge, Sediment, PDF Functions, Odisha Rivers, Trend analysis, Statistical Modeling
1.
INTRODUCTION
Odisha, (170 27’ to 220 34’ N lat. and 81027'E 81 to 87029'E long.) is a peninsular state lies in the northern part of east coast of India. It has an area of 155707sqkm, 55707sqkm, coastline of 480km and a demographic population 0f 0.42 Billion. Odisha is the land of east flowing Hexa deltaic rivers i.e. theSubarnarekha, the Budhabalanga,, the Baitarani, the Bramhani, the Mahanadi and the Rushikulya(Fig Rushikulya 1). The first five rivers ivers originate from the ChhottanagpurPlateau Chhottanagpur and the last one from EGB hills. They are of different size, shape, length and form various types of deltas. (Table 1) The other small east flowing rivers draining to Bay of Bengal (BOB) are contributing negligible ible amount of the total flow and sediment. The rivers originating in Odisha but join the BOB along Andhra Pradesh coast are the Bahuda, the MahendraTanaya, Mahendra the Vansadhara and the Nagavali. The state is in a tropical climate having maximum temperature of 450 C and minimum 200C. C. All the rivers are ephemeral and
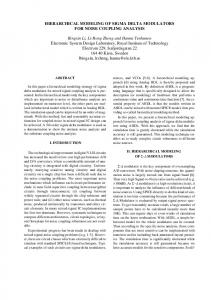
Fig 1: The six river basins in Odisha: Source: Bhuvan, NRSC, Hyd.
Fig 1: Index map of the study area showing rivers (source Bhuaban)
19
International Journal of Multidisciplinary Engineering in Current Research Volume 1, Issue 1, September 2016, http://ijmec.com/ 2.
A.N. 1953[4]Khosla A.N. 1953[4]reported that the concentration of sediment were 90% of the total annual sediment loadflow downstream retaining only 10%in the upper catchment. The suspended load at Sambalpur before construction of Hirakud Dam (1947-51) (1947 was 0.081%.
REVIEW OF LITERATURE
Audin J. B.,(1950)[3], stated that 76% of suspended sediment (SS) in Mahanadii river in the year 1947 was fine (0.2 mm). Khosla Dams (major, medium and minor) and BWA’s (barrages, weirs and anicuts) in Odisha along these rivers are 180 and 43 respectively (Water Resources Dept., Odisha). The ground water potential of the state to a tune of 381251Ham has been explored for irrigation purposes. The annual average 2 sediment yield of the catchment was 200-400MT/km 200 /year [5] (Mohanty et al 2006) Nnaji et al 2014[6], reported Gumbel and Log Pearson Type III (LPT III) and Weibull distributions can reasonably predict of flow frequency. LPT III distribution can be used and are more appropriate. Rechard A. Vogel , (1993)[7] reported LPT III method of flood flow modeling was recommended by United states as flood frequency guide lines.Olofintoye lines. et al (2009)[8] reported LPT III methods are adoptable for many Nigerian rivers of Africa. Al-Awadi Awadi (2016)[9] reported that LPT III method is prioritized overr log normal, Gumbel and simple average methods.[10] 3.
The prediction for these parameters can be done statistically, stically, using soft computing methods and Fuzy logic and machine computing. In the present study the prediction of flow and sediment of rivers at their delta head has been done by using common statistical methods (Gumbel and LPT III) by statistical tools and packages. A comparison was done for the obtained results and their suitability was assessed. 4.
FLUVIAL SOURCES:
Basin flow, the reservoir discharges and run off from the basin are the main sources of water. The amount of precipitations received by the basin is 75 to 80% during SW monsoon. The total catchment area/drainage area in Odisha is 150460sqkm/143729 sqkm and annual flow is 99.876 Mcum, Patiet. al.(2010)[17]. The ground water potential is 2.1Mha. The yields from the wells are @10-35 @10 cum/hr in granite strata, @5-18cum/hr 18cum/hr in crystalline genesis and @20-115cum/hr @20 in semi consolidated rocks CGWB, MoEF (2015)[18]. In 21stcentury the statistics of climate have changed the statistics due to erratic monsoon, geo-tectonics geo and sun earth geometry[Fig-2].
METHODS
Presently the deltas of rivers are sinking, shrinking and subsiding due to anthropogenic interventions like dams and BWA’s basing on sediment study for large rivers like Ganges, Mahanadi, Godavari, ari, Krishna etc., etc Syvitski et al., (2009)[10] and (2011)[11], Gamage et. al.(2009)[12], Gupta et al (2012)[13], Dandekar (2014)[14]. Less research works are done on the sediment flows of small river basins basin in Odisha. This paper is an attempt to study the influx of sediment and flow in six major rivers in Odisha and their impact on the deltaic system. Annual discharge of monsoon/non-monsoon monsoon flow and sediment (colloidal argillaceous matter) were collected from Integrated hydrological data book (non-classifie classified basins), 2005, 2006, 2009, 2012 and 2015[15]. The data were compiled to a time series. The statistical analysis of the time series of flow/sediment for the major six rivers in Odisha falling in BoB was done in the present study. A time series is a data filethat ilethat represents continuous physical data with a fixed specified time interval. interval It is aimed at to find a trend in the phenomenon and used to predict future values of the time series. Trend analysis is done by smoothening and fitting a function or a curve cur to the series of data. Multiple regression models (both linear and nonlinear) were applied to the time series annual flow and corresponding sediment data of the rivers at 95% confidence limits. The coefficient of determination R2 values was used to determine rmine the % rate of fitting to the observed data. The types of fitted curve, the probability distribution functions, the parameters of the best fit equation and coefficient of determination were found.
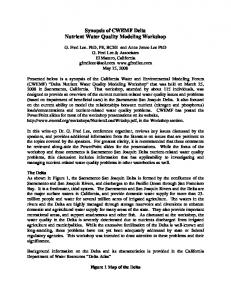
Figg 2: Geomorphologic map Coastal Odisha (Source: Thematic maps Bhuban)
The sources for sediment are from classic gullies, infrastructural development sites, urban storm water, agricultural field excesses, flood plains etc. The links between runoffs and sediments are through ravines. The soil discharge rate (T) of the he state is varying in different physiographic zones of Odisha from 2.5mg/ha/yr. yr. to 12.5g/ha/yr. The inland reaches of EGB hills and upper Mahanadi basin have a soil erosion rate is less (T