132
Conference on Data Mining | DMIN'06 |
Modeling of the counter-examples and association rules interestingness measures behavior Benoˆıt Vaillant and St´ephane Lallich and Philippe Lenca Abstract— Association rules discovery is one of the most important tasks in Knowledge Discovery in Data Bases. Since the initial APRIORI algorithm, many efforts have been done in order to develop efficient algorithms. It is well known that APRIORI-like algorithms within the (unsatisfying) support/confidence framework may produce huge amounts of rules and thus one of the most important steps in association rules discovery is nowadays the evaluation and interpretation of their interestingness. Thus there has been substantial works that addressed the problem of association rules interestingness and many interestingness measures have been defined and used in order to find the best rules in a post-processing step. Measures provide numerical information on the quality of a rule and a rule A → B is said “of quality” if its evaluation by a measure is greater than a user defined threshold. These measures can be studied as functions of the number of counter-examples of rules. In this paper we present three modelings of counter-examples and examine the consequences of such modelizations on two important desired properties of association rules interestingness measures, that are the decrease with the number of counterexamples and the tolerance to the apparition of the first counterexamples. We here present results for ten well known measures.
I. I NTRODUCTION Association rule discovery is one of the most important tasks in Knowledge Discovery in Data Bases. Since the initial work presented in [1] and the APRIORI algorithm, many efforts have been done in order to develop efficient algorithms, as in [2], [3], [4], [5] and [6] for example. It is well known that APRIORI-like algorithms may produce huge amounts of rules and thus an essential step in association rules discovery is nowadays the evaluation and interpretation of their interestingness ([7], [8], [9]). Initially, when discovering associations with algorithms such as APRIORI, the interestingness of a rule was measured through its support and its confidence. Unfortunately, measuring the interestingness of rules only within the support and confidence framework is not satisfying [10], [11], [12]. Thus there has been substantial works that addressed the problem of association rules interestingness and many interestingness measures have been defined and used in order to find the best rules in a post-processing step [13], [14], [15], [16], [17], [18], [19], [20], [21], [22], [23], [24], [25] and [26], for example. Benoˆıt Vaillant is with the IUT de Vannes, Universit´e de Bretagne Sud, VALORIA, 8, rue Montaigne, BP 561, 56017 Vannes, France (email:
[email protected]). St´ephane Lallich is with the Universit´e Lyon 2, Laboratoire ERIC, 5 avenue Pierre Mend`es-France, 69676 Bron Cedex, France (email:
[email protected]) Philippe Lenca is with the GET/ENST Bretagne, TAMCIC UMR CNRS 2872, Technopˆole de Brest Iroise, CS 83818, 29238 Brest Cedex, France (email:
[email protected])
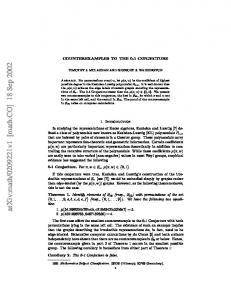
Measures provide numerical information on the quality of a rule, and a rule A → B is said “of quality” if its evaluation by a measure is greater than a user defined threshold. In this paper we focus on objective measures [27]. Such measures only take into account the rules cardinalities (see table I and figure 1): • • •
•
pa , the proportion of transactions (or cases) in the database matching the condition of the rule, pb , the proportion of transactions matching the conclusion of the rule, pab the proportion of transactions matching the condition and the conclusion of the rule (i.e. examples to the rule: cases of A ∩ B, also written AB), n = |E| the total number of transactions.
For such given quantities, all cells of table I are known since the contingency table has only three degrees of freedom. In particular, pa¯b the proportion of transactions matching the condition but not the conclusion of the rule (i.e. cases of ¯, also to be seen as the counter-examples of the rule) can AB be deduced using the following expression: pa¯b = pa − pab . Similar expressions can be used to fill in the entire table. For example, pa¯ = 1 − pa and pa¯¯b = pa¯ − pa¯b = p¯b − pa¯b . TABLE I R ELATIVE CHARACTERISTICS OF A → B A\B
0
1
total
0
pa¯¯b
pa¯b
pa¯
1
pa¯b
pab
pa
total
p¯b
pb
1
E A
key: pa pb p ab p ab
Fig. 1.
B
Relative characteristics of A → B
The different works mentioned above mainly focused on desired properties of measures. In [28], [29] we studied measures that are decreasing functions of the number of counter-examples of the rule. Our studies were based on eight other formal contextual properties of the measures, and an
Conference on Data Mining | DMIN'06 | eligibility property. Among these properties, two of them are strongly related to the number of counter-examples: •
•
Property P1 , eligibility: association rules interestingness measures should be decreasing functions of the number of counter-examples of the rules. This is an eligibility property [20], based on the assumption that adding counter-examples to a rule should result in a worse evaluation by interestingness measures. Property P2 , curve form with the apparition of few counter-examples: the user may tolerate or not the apparition of few counter-examples without significant loss of rule interest. This property imposes a constraint on the shape of the curve of a measure when the first counter-examples appear [30]. Measures are then classified between concave, linear or convex ones. Through the analysis of this property, we intend to give better hints to the user towards which measure should fit his needs or not.
In common studies, the behavior of interestingness measures is assessed using constant marginal frequency counts. The number of cases matching either the condition or the conclusion of a rule is fixed, and only the inner cells of the contingency table I are altered. This means that adding counter-examples to a rule can be seen as less overlapping sets in figure 1, each set A and B being of constant size. As a consequence, by adding counter-examples to a rule (i.e. increasing the value of pa¯b ), we also alter the three other values of the inner cells of the contingency table. The added counter-examples are taken from the examples, not from any of the other potential sets. This is imposed by the relation pa¯b = pa − pab . This is what we will refer to as the first modeling. It seems reasonable to think that a rule may be altered through the correction of errors in the database, or the addition of new cases. In such cases, there is no reason why such modifications should result in only moving examples towards or from counter-examples, for fixed values of pa and pb . On the contrary, counter-examples may be generated in various ways. We will hence investigate the impact of such an addition of counter-examples with respect to different modelings, each of them being based on the selection of a possible source of new counter-examples, and see that the properties previously defined may reveal different aspects, depending on the modeling considered. Our proposal will be illustrated with some classical association rule interestingness measures. The paper is organized as follows. After a brief presentation of the interestingness measures on which we will focus, we list the three different modelings we shall study, as well as others that could have been considered but seeming of lesser pertinence in our context. This being listed, we then study the measures with respect to each of the three modelings retained, and summarize our results. Finally, we conclude and present the new perspectives that arise.
133 II. M EASURES A. Measures We studied the following well known interestingness measures: confidence (C ONF), conviction (C ONV), the rate of examples and counter-examples (ECR), Jaccard (JAC), least contradiction (LC), lift (L IFT), the information gain (IG), Loevinger (L OE), Piatetsky-Shapiro (PS) and support (S UP). This set of measures well shows the various situations which appear according to the modeling that will be used. Table II presents the relative definition of these measures. TABLE II I NTERESTINGNESS M EASURES
C ONF C ONV ECR
Relative definitions
References
pb/a
[1]
pa p¯ b pa¯ b p 1 − pa¯b ab
[4]
pab pa +pb −pab pab −pa¯ b pb pb/a pb
[31]
[34]
L OE
log ppab a pb pb/a −pb 1−pb
[35]
PS
n(pab − pa pb )
[7]
S UP
pab
[1]
JAC LC L IFT IG
[32] [33]
The behavior of the measures with respect to counterexamples is studied by expressing their first and second order derivatives. By knowing the sign of the first derivative, we can hence evaluate the measures on property P1 . The sign of the second derivative is then used to evaluate property P2 . The measures being defined as functions of the various quantities presented in table I, which is a three degrees of freedom contingency table, we need to clearly identify the source from which counter-examples are taken in order to compute the derivatives. In order to specify this, we propose various modelings, presented in the next session. III. C OUNTER - EXAMPLES MODELINGS Various modelings of the variations of counter-examples can be proposed. Amongst these, three appear as relevant in the context of association rule evaluation. For each of them, we specify the provenance of counter-examples, thus identifying which quantities remain constant and which one are not in the contingency table. For clarity reasons, we denote by x the proportion of counter-examples (i.e. the cell ¯), and express the various and changing corresponding to AB quantities with respect to this variable for each modeling. A. Modeling 1: pa and pb are fixed In the usual modeling (which we will refer to as M1 ), pa and pb are considered as fixed. This is the classical approach when considering property P1 [20], [28], [30].
134
Conference on Data Mining | DMIN'06 |
This modeling was also used by [36] in order to study the effect of noisy data in rule extraction systems, by [37] in order to study the reference to indetermination, and by [23] in order to study the reference to independence. In M1 , all the inner cell frequencies depend on x. This situation is summarized in table III and figure 2.
E A
key: pa pb p ab p ab
B
TABLE III C ONTINGENCY TABLE FOR M ODELING 1 A\B
0
1
total
0
p¯b − x
pa¯ − p¯b + x
pa¯
1
x
pa − x
pa
total
p¯b
pb
1
Fig. 3.
Modeling 2
C. Modeling 3 : new counter-examples come from ¯ A¯ B
E
In modeling 3 (M3 ), new counter-examples come from the cases not matching neither the condition nor the conclusion of the rule, i.e. from the set ¯ A¯ B. Here, the situation is reversed as this time pb is fixed, and pa depends on x. This situation is summarized in table V and figure 4.
A
key:
TABLE V C ONTINGENCY TABLE FOR M ODELING 3
pa pb p ab p ab
B
Fig. 2.
Modeling 1
When considering this first modeling: • all the studied measures are decreasing functions of the number of counter-examples (since property P1 is a requirement [20]), • results for property P2 are presented in table XVI, and are developed in [38] for 20 classical measures, including those studied in this paper. B. Modeling 2 : new counter-examples come from the examples AB In [39], we assessed the issue of evaluating the maximal proportion of counter-examples that a rule may lose, while remaining of quality (i.e. still being evaluated by a given quality measure above a user defined threshold). In this previous work, we introduced an alternate modeling, in which counter-examples are taken from the examples, which we will refer to as modeling 2 (M2 ). This modeling differs from the previous one since here only pa is fixed, whereas pb is not. This situation is summarized in table IV and figure 3. TABLE IV C ONTINGENCY TABLE FOR M ODELING 2 A\B
0
1
total
0
pa¯¯b
pa¯b
pa¯
1
x
pa − x
pa
total
pa¯¯b + x
pa¯b + pa − x
1
A\B
0
1
total
0
p¯b − x
pa¯b
p¯b + pa¯b − x
1
x
pab
pab + x
total
p¯b
pb
1
E A
key: pa pb p ab p ab
B
Fig. 4.
Modeling 3
D. Other Modelings Other modelings could be investigated: • new counter-examples come from ¯ AB: in this modeling, both pa and pb shall vary, since modifications affect A and B, by increasing the first set while decreasing the second, and retaining their intersection constant. • new counter-examples come from new cases and thus n is changed, this time. As a result, both pa and pb will once again vary. Similarly to the previous modeling, the set A will be increased. The set B will be kept constant. Still, since we are adding new cases, the proportion pb will decrease. We believe these modelings are less realistic than the three initial ones, and will hence not develop them in this paper.
Conference on Data Mining | DMIN'06 |
135
TABLE VI
TABLE IX
C ONFIDENCE CASE
JACCARD CASE
modeling 2
modeling 3
modeling 2
modeling 3
µ
pa −x pa
pab x+pab
pa −x pa ¯ b +pa
pab x+pb
µ0
− p1
µ00
0
µ µ0 µ00
a
pab − (x+p
ab )
µ µ0
2
2pab (x+pab )3
−p
µ00
1 a ¯ b +pa
pab − (x+p )2
0
b
2pab (x+pb )3
TABLE VII
TABLE X
C ONVICTION CASE
L EAST C ONTRADICTION CASE
modeling 2
modeling 3
pa (x+pa ¯¯ b) x p p − ax2a¯¯b p p 2 ax3a¯¯b
p¯ b (pab +x) x p p¯ b − ab x2 pab p¯ 2 x3 b
IV. R ESULTS For each measure listed in table II, we have expressed the first and second order derivatives, for the two new modelings considered, results for the first modeling being classical and summarized in [38]. These results are presented in tables VI to XV, and summarized for all three modelings with regard to P2 in table XVI. For the information gain, the logarithmic constant is not of interest in order to study the derivative of the measure. For clarity reasons, we hence present results for IG × ln(10) in table XII, the conclusions being equivalent in both cases. First of all, apart from the S UP, all measures have a negative derivative, for any of the considered modeling. These measures hence respect the eligibility property P1 , corresponding to the common belief that the more counterexamples of a rule there are, the worse its quality should be. Still, results differ when considering the second property P2 . Some measures do not behave in the same manner when counter-examples are added: the origin of the counterexamples will have an impact on the decrease of the measure, in some cases being initially slow, or not. In the usual modeling, C ONF is linear with respect to pa¯b , which is also the case in the second modeling. In the third modeling, it is not the case anymore, since C ONF becomes an hyperbolic convex function of the counter-examples. JAC is linear for modeling 2 and convex for modeling 3.
µ
x pa −x
µ
1−
µ0
a − (p p−x) 2 a
µ00
a −2 (p p−x) 3 a
1− −p
1 ab
0
pa −2x pa ¯ b +pa −x
pab −x pb
pa +pa ¯b 2 a ¯ b +pa −x)
− (p
µ00
−2 (p
− p1
b
pa +pa ¯b 3 a ¯ b +pa −x)
0
The L IFT is the most interesting measure of this study. Indeed, it is seen as linear in the usual modeling. However, when considering the second modeling, it turns out to be a concave homographic function, and an hyperbolic convex function with respect to the third modeling. As previously said, all measures are decreasing functions of pa¯b for all modelings, save the S UP whose value is not affected by the introduction of counter-examples in the third modeling. This adds up to the already known poor interest in using S UP when assessing the quality of a rule. Yet S UP remains a heavily used measure, since its antimonotonicity property plays a major role, simplifying the exploration of a lattice, in the A PRIORI-like algorithms [1], [40]. It also is a straightforward measure: its value is easy to grasp. As reported in table XVI, it is interesting to note that most measures behave differently, depending on the model, the most fluctuating one being the L IFT. Only C ONV (convex) and PS (linear) behave in a similar manner for the three modelings. When considering the use of a interestingness TABLE XI L IFT CASE
µ
modeling 2
modeling 3
pa −x pa (pa ¯ b +pa −x)
pab pb x+pb pab
µ0
−p
pa ¯b 2 a (pa ¯ b +pa −x)
µ00
−p
2pa ¯b 3 a (pa ¯ b +pa −x)
−p
pab 2 b (x+pab )
2pab pb (x+pab )3
TABLE XII I NFORMATION GAIN CASE
modeling 3 x pab
modeling 3
µ0
TABLE VIII R ATE OF EXAMPLES AND COUNTER - EXAMPLES CASE modeling 2
modeling 2
modeling 2
modeling 3
µ × ln(10)
−x ln( p (p pa+p ) a ab a −x)
µ0 × ln(10)
−pab (pab +pa −x)(pa −x)
−1 (x+pab )
µ00 × ln(10)
−pab (pab +2(pa −x)) (pa −x)2 (pab +pa −x)2
1 (x+pab )2
ln( p
pab b (x+pab )
)
136
Conference on Data Mining | DMIN'06 |
µ µ0 µ00
TABLE XIII
TABLE XVI
L OEVINGER CASE
S YNTHETIC R ESULTS FOR P ROPERTY P2
modeling 2
modeling 3
p a pa ¯x ¯¯ b −pa p a pa ¯¯ b +pa x p − p (p a¯¯b+x)2 a a ¯¯ b p 2 p (p a¯¯b+x)3 a a ¯¯ b
pab p¯ b −pb x pab p¯ bx b +p¯ pab − p (x+p 2 ¯ ab ) b pab 2 p (x+p 3 ¯ ab ) b
M1
M2
M3
C ONF
linear
linear
convex
C ONV
convex
convex
convex
ECR
concave
concave
linear
JAC
convex
linear
convex
LC
linear
concave
linear
L IFT
linear
concave
convex
IG
concave
concave
convex
TABLE XIV PS CASE modeling 2
modeling 3
µ
n(pa pa¯¯b ) + nx(pa − 1)
npab p¯b − npb x
L OE
linear
convex
convex
µ0
n(pa − 1)
−npb
PS
linear
linear
linear
µ00
0
0
S UP
linear
linear
not affected
TABLE XV S UPPORT CASE modeling 2
modeling 3
µ
pa − x
pab
µ0
−1
0
µ00
0
0
measure, knowing which kind of counter-examples are the worst ones in an applicative context, such a study may then hint towards which measure will fit best a user’s needs. V. C ONCLUSIONS In this paper, we have defined three alternate modelings of the addition of counter-examples to a rule, in the context of the evaluation of the quality of association rules. For each of these modelings, through the study of derivatives, we have analyzed the behavior of ten interestingness measures. The results show that measures globally do not behave similarly, depending on the modeling chosen. It is then of high importance that the final end user should take some time considering the probable counter-examples which he/she will face, and the ways they should be taken into account when assessing the quality of a rule. By doing so, the synthetic table we propose may guide his/her choice of interestingness measure retained in order to evaluate the quality of extracted rules, depending on the tolerance he/she has towards the different kind of counter-examples. R EFERENCES [1] R. Agrawal, T. Imielinski, and A. Swami, “Mining association rules between sets of items in large databases,” in ACM SIGMOD International Conference on Management of Data, P. Buneman and S. Jajodia, Eds., Washington, D.C., USA, 1993, pp. 207–216. [2] R. Agrawal and R. Srikant, “Fast algorithms for mining association rules,” in The 20th International Conference on Very Large Data Bases, J. B. Bocca, M. Jarke, and C. Zaniolo, Eds. Santiago de Chile, Chile: Morgan Kaufmann, 1994, pp. 487–499.
[3] H. Toivonen, “Sampling large databases for association rules,” in The 22th International Conference on Very Large Data Bases, T. M. Vijayaraman, A. P. Buchmann, C. Mohan, and N. L. Sarda, Eds. Mumbai, India: Morgan Kaufman, 1996, pp. 134–145. [4] S. Brin, R. Motwani, J. D. Ullman, and S. Tsur, “Dynamic itemset counting and implication rules for market basket data,” in ACM SIGMOD International Conference on Management of Data, J. Peckham, Ed. Tucson, Arizona, USA: ACM Press, 1997, pp. 255–264. [5] D.-I. Lin and Z. M. Kedem, “Pincer Search: A new algorithm for discovering the maximum frequent set,” in The 6th International Conference on Extending Database Technology, ser. Lecture Notes in Computer Science, H.-J. Schek, F. Saltor, I. Ramos, and G. Alonso, Eds., vol. 1377. Springer-Verlag, 1998, pp. 105–119. [6] N. Pasquier, Y. Bastide, R. Taouil, and L. Lakhal, “Discovering frequent closed itemsets for association rules,” in The 7th International Conference on Database Theory, ser. Lecture Notes in Computer Science, C. Beeri and P. Buneman, Eds., vol. 1540. Jerusalem, Israel: Springer, 1999, pp. 398–416. [7] G. Piatetsky-Shapiro, “Discovery, analysis and presentation of strong rules,” in Knowledge Discovery in Databases, G. Piatetsky-Shapiro and W. Frawley, Eds. AAAI/MIT Press, 1991, pp. 229–248. [8] A. Silberschatz and A. Tuzhilin, “What makes patterns interesting in knowledge discovery systems,” IEEE Transactions On Knowledge And Data Engineering, vol. 8, no. 6, pp. 970–974, 1996. [9] R. Hilderman and H. Hamilton, “Measuring the interestingness of discovered knowledge: A principled approach,” Intelligent Data Analysis, vol. 7, no. 4, pp. 347–382, 2003. [10] A. Freitas, “On rule interestingness measures,” Knowledge-Based Systems, vol. 12, no. 5-6, pp. 309–315, 1999. [11] T. Brijs, K. Vanhoof, and G. Wets, “Defining interestingness for association rules,” International journal of information theories and applications, vol. 10, no. 4, pp. 370–376, 2003. [12] B. Padmanabhan, “The interestingness paradox in pattern discovery,” Journal of Applied Statistics, vol. 31, no. 8, pp. 1019–1035, 2004. [13] R. J. Bayardo and R. Agrawal, “Mining the most interesting rules,” in ACM SIGKDD International Conference on Knowledge Discovery and Data Mining, 1999, pp. 145–154. [14] N. Lavrac, P. Flach, and B. Zupan, “Rule evaluation measures: A unifying view,” in Ninth International Workshop on Inductive Logic Programming, ser. Lecture Notes in Computer Science, S. Dzeroski and P. Flach, Eds., vol. 1634. Springer-Verlag, 1999, pp. 174–185. [15] P.-N. Tan and V. Kumar, “Interestingness measures for association patterns: A perspective,” University of Minnesota, Department of Computer Science, Tech. Rep. TR00-036, 2000. [16] R. Hilderman and H. Hamilton, “Evaluation of interestingness measures for ranking discovered knowledge,” in The 5th Pacific-Asia Conference on Advances Knowledge Discovery and Data Mining, ser. Lecture Notes in Computer Science, D. Cheung, G. Williams, and
Conference on Data Mining | DMIN'06 |
[17] [18] [19]
[20]
[21]
[22] [23]
[24]
[25]
[26]
[27]
Q. Li, Eds., vol. 2035. Hong Kong, China: Springer Verlag, 2001, pp. 247–259. R. J. Hilderman and H. J. Hamilton, Knowledge Discovery and Measures of Interest. Kluwer Academic Publishers, 2001. S. Lallich, “Mesure et validation en extraction des connaissances a` partir des donn´ees,” Habilitation a` Diriger des Recherches – Universit´e Lyon 2, 2002. F. Hussain, H. Liu, E. Suzuki, and H. Lu, “Exception rule mining with a relative interestingness measure,” in The Fourth Pacific-Asia Conference on Knowledge Discovery and Data Mining, ser. Lecture Notes in Artificial Intelligence, T. Terano, H. Liu, and A. Chen, Eds., vol. 1805. Kyoto, Japan: Springer-Verlag, 2000, pp. 86–97. P. Lenca, P. Meyer, P. Picouet, B. Vaillant, and S. Lallich, “Crit`eres d’´evaluation des mesures de qualit´e en ECD,” Revue des Nouvelles Technologies de l’Information (Entreposage et Fouille de Donn´ees), no. 1, pp. 123–134, 2003. ´ S. Lallich and O. Teytaud, “Evaluation et validation de l’int´erˆet des r`egles d’association,” Revue des Nouvelles Technologies de l’Information (Mesures de Qualit´e pour la Fouille de Donn´ees), no. RNTI-E-1, pp. 193–217, 2004. K. McGarry, “A survey of interestingness measures for knowledge discovery,” Knowledge Engineering Review Journal, vol. 20, no. 1, pp. 39–61, 2005. S. Lallich, B. Vaillant, and P. Lenca, “Parametrised measures for the evaluation of association rule interestingness,” in The XIth International Symposium on Applied Stochastic Models and Data Analysis, J. Janssen and P. Lenca, Eds., Brest, France, 2005, pp. 220–229. J. Blanchard, F. Guillet, R. Gras, and H. Briand, “Using informationtheoretic measures to assess association rule interestingness,” in 5th IEEE International Conference on Data Mining. Houston, USA: IEEE Computer Society Press, 2005, pp. 66–73. X.-H. Huynh, F. Guillet, and H. Briand, “Extracting representative measures for the post-processing of association rules,” in Fourth IEEE International Conference on Computer Sciences dedicated to Research, Innovation and Vision for the Future. Ho Chi Minh, Vietnam: IEEE Computer Society Press, 2006, pp. 99–106. J. P. Barth´elemy, A. Legrain, P. Lenca, and B. Vaillant, “Aggregation of valued relations applied to association rule interestingness measures,” in Modeling Decisions for Artificial Intelligence, ser. Lecture Notes in Computer Science, V. Torra, Y. Narukawa, A. Valls, and J. DomingoFerrer, Eds., vol. 3885. Tarragona, Catalonia, Spain: Springer-Verlag, 2006, pp. 203–214. R. Hilderman and H. Hamilton, “Applying objective interestingness measures in data mining systems,” in The Fourth European Symposium on Principles of Data Mining and Knowledge Discovery, ser. Lecture Notes in Computer Science, D. Zighed, J. Komorowski, and J. Zytkow, Eds., vol. 1910. Lyon, France: Springer Verlag, 2000, pp. 432–439.
137 [28] P. Lenca, P. Meyer, B. Vaillant, and S. Lallich, “A multicriteria decision aid for interestingness measure selection,” GET/ENST Bretagne, D´epartement LUSSI, Tech. Rep. LUSSI-TR-2004-01-EN, 2004. ´ [29] P. Lenca, P. Meyer, B. Vaillant, P. Picouet, and S. Lallich, “Evaluation et analyse multicrit`ere des mesures de qualit´e des r`egles d’association,” Revue des Nouvelles Technologies de l’Information (Mesures de Qualit´e pour la Fouille de Donn´ees), no. RNTI-E-1, pp. 219–246, 2004. [30] R. Gras, R. Couturier, J. Blanchard, H. Briand, P. Kuntz, and P. Peter, “Quelques crit`eres pour une mesure de qualit´e de r`egles d’association,” Revue des Nouvelles Technologies de l’Information (Mesures de Qualit´e pour la Fouille de Donn´ees), no. RNTI-E-1, pp. 3–31, 2004. [31] P. Jaccard, “Nouvelles recherches sur la distribution florale,” Bulletin Society Vaud Science National, no. 44, pp. 223–270, 1908. [32] J. Az´e and Y. Kodratoff, “Evaluation de la r´esistance au bruit de quelques mesures d’extraction de r`egles d’assocation,” in Extraction et gestion des connaissances, ser. Extraction des connaissances et apprentissage, D. H´erin and D. Zighed, Eds., vol. 1, no. 4. Montpellier, France: Lavoisier, 2002, pp. 143–154. [33] S. Brin, R. Motwani, and C. Silverstein, “Beyond market baskets: generalizing association rules to correlations,” in ACM SIGMOD International Conference on Management of Data, J. Peckham, Ed. Tucson, Arizona, USA: ACM Press, 1997, pp. 265–276. [34] K. W. Church and P. Hanks, “Word association norms, mutual information an lexicography,” Computational Linguistics, vol. 16, no. 1, pp. 22–29, 1990. [35] J. Loevinger, “A systemic approach to the construction and evaluation of tests of ability,” Psychological monographs, vol. 61, no. 4, 1947. [36] J. Az´e and Y. Kodratoff, “A study of the effect of noisy data in rule extraction systems,” in The Sixteenth European Meeting on Cybernetics and Systems Research, vol. 2, 2002, pp. 781–786. [37] J. Blanchard, F. Guillet, H. Briand, and R. Gras, “Assessing the interestingness of rules with a probabilistic measure of deviation from equilibrium,” in The XIth International Symposium on Applied Stochastic Models and Data Analysis, J. Janssen and P. Lenca, Eds., Brest, France, 2005, pp. 191–200. [38] P. Lenca, B. Vaillant, P. Meyer, and S. Lallich, Quality Measures in Data Mining, ser. Studies in Computational Intelligence, Guillet, F. and Hamilton, H.J., Eds. Springer, 2006, ch. Association rule interestingness measures: experimental and theoretical studies. [39] P. Lenca, S. Lallich, and B. Vaillant, “On the robustness of association rules,” in The IEEE International Conference on Cybernetics and Intelligent Systems, Bangkok, Thailand, 2006. [40] N. Pasquier, “Data mining : Algorithmes d’extraction et de r´eduction des r`egles d’association dans les bases de donn´ees,” Ph.D. dissertation, Universit´e Blaise Pascal - Clermont-Ferrand II, 2000.