1470
JOURNAL OF APPLIED METEOROLOGY
VOLUME 36
Modeling Raindrop Size Distribution and Z(R) Relations in the Western Mediterranean Area CARLOS CERRO, BERNAT CODINA, JOAN BECH,
AND
JERONI LORENTE
Department of Astronomy and Meteorology, University of Barcelona, Barcelona, Spain (Manuscript received 24 April 1996, in final form 27 March 1997) ABSTRACT This study shows the results of the modeling of drop size distributions (DSD) observed during a 2-yr study in Barcelona. Thirty-second individual sample collections of drop sizes and velocities were measured with an optical disdrometer and grouped into different classes according to their rain rate. Using the moments method, the entire experimental dataset was fitted to three standard distribution functions: exponential, gamma, and lognormal. Relationships were found between rain rate R and other moments of the DSD, such as optical attenuation S, liquid water content W, and reflectivity Z. Although gamma distribution generally reproduced experimental measurements more accurately, the Z(R) relationship, which is particularly relevant in radar meteorology, yielded the best results when calculated from fitted exponential distribution.
1. Introduction Interest in raindrop size distribution studies is twofold. On the one hand, they contribute to a better understanding of microphysical and dynamic cloud processes involved in the generation of precipitation particles; on the other hand, they have applications in the remote measurement of rain rate and in microwave attenuation estimations, soil erosion, and wash-out processes. Since the pioneer studies of Marshall and Palmer (1948), extensive research has been devoted to modeling raindrop size distributions (Ulbrich 1983; Feingold and Levin 1986) and to the determination of empirical relations between integral magnitudes for different rainfall conditions (Battan 1973; Joss and Gori 1978; Austin 1987). One method for obtaining drop size distribution (DSD) functions requires previous normalization of both measured drop diameters and concentrations. This normalization, proposed by Sekhon and Srivastava (1971, 1978), and later by Willis (1984), was meant to comprise the entire dataset, thus achieving a universal distribution function independent of observation site or rain type. An alternative method is based on previous grouping of rain registers in different rain-rate classes to obtain mean size distributions. These distributions can then be
Corresponding author address: Dr. Jeroni Lorente, Department of Astronomy and Meteorology, University of Barcelona, Auguda Diagonal, 647 E-08028 Barcelona, Spain. E-mail:
[email protected]
q 1997 American Meteorological Society
fitted to theoretical models whose parameters will depend on the rain rate, usually through a power law. The moments method (Waldvogel 1974; Ulbrich 1983) is based on the determination of a theoretical distribution that shares a given number of moments or integral magnitudes with the experimental distribution. This number is equal to the number of parameters of the size distribution function chosen. Still another group of studies aims at providing a set of relationships between integral magnitudes such as rain rate R, reflectivity Z, and water content W. These relationships are not generally derived from DSD but from fits of field measurements of the integral magnitudes involved. Following this line of research, Battan (1973) presented expressions that related Z with R and W with R, Atlas (1953) examined the relation of attenuation to rain rate S(R), and Laws and Parsons (1943) and Brandt (1989) reported the dependence of mean volumetric diameter on rain rate Do(R). One common feature of DSDs is their strong sensitivity to rain rate. Thus, DSD fittings improve when the range of rain rate considered is narrow. However, in the western Mediterranean area a wide range of intensities are frequently observed. Convective precipitation, associated with rain rates higher than 50 mm h21 (Rice and Holmberg 1973), constitutes a significant part of the total yearly rainfall in Barcelona, which averages 600 mm. Vilar and Burguen˜o (1995) studied a 49-yr rain-rate series recorded at the Fabra Observatory (Barcelona) and found that 37% of the total precipitation fell in events that at no time surpassed the threshold value of 50 mm h21, while 18% corresponded to events with intensities above that value. Data collected at the
NOVEMBER 1997
same site over 60 yr, shows return periods of only 1-yr for 5-min average rain rates above 100 mm h21 (Lorente and Redan˜o 1990). Here, we will discuss the dependence of DSD on R by classifying the complete set of measurements according to their rain rate and using the moments method. The wide range of applications of DSD has increased the number of different functions used in DSD modeling. Because of their simplicity and wide utilization we focused on three functions: exponential, gamma, and lognormal. We used these three functions to fit data obtained in Barcelona, thus complementing the description of the rain in that area. Some empirical relationships between rain rate and different moments of the distribution such as reflectivity, liquid water content, and attenuation are also deduced from the modeled distributions. They are compared in order to find which DSD model is most suitable to compute each moment in the different rain-rate intervals considered. 2. Instrumental device and data acquisition Data were collected with an optical disdrometer. Its measurements are based upon the optical attenuation of an infrared light beam caused by falling raindrops. The source of the parallel light beam and the receiver of the attenuated response are located on opposite sides of the instrument. The duration and amplitude of the attenuation allows for the determination of size and velocity of the falling drop intercepting the beam. A more detailed description of the instrument, measurement accuracy, and calibration method is given by Hauser et al. (1984). During each precipitation episode, the disdrometer generated a temporal sequence of raindrop-size and velocity distributions with a sampling time of 30 s. Drop diameters and fall velocities were divided into 16 classes, with diameters up to 5 mm and maximum velocities of 10 m s21. According to this classification, distributions were stored as square arrays of 256 elements, each element representing the total number of drops for each class of diameters and velocities. To avoid the effect of unwanted splashing droplets, an interval of confidence was generated around the theoretical values predicted for drops of that size by the empirical relationship proposed by Uplinger (1981):
y (D) 5 4.874D exp(20.195D),
1471
CERRO ET AL.
(1)
where y (D) is expressed in meters per second and D is in millimeters. Measurements whose velocities differed by more than 50% of the value predicted for their size were assumed to be caused by splashing droplets. To process these spurious droplets without modifying either the total water content for each collection or its rain rate, a velocity generated by (1) was associated with these measurements. More than 7000 individual sample collections were
TABLE 1. Rain-rate intervals of each intensity class. Range (mm h21)
Intensity classes 0A 0B 1 2 3 4 5 6 7 8 9 10 11 12 13 14 15
0.0–2.5 2.5–5.0 5.0–15.0 15.0–25.0 25.0–35.0 35.0–45.0 45.0–55.0 55.0–65.0 65.0–75.0 75.0–85.0 85.0–95.0 95.0–105.0 105.0–115.0 115.0–125.0 125.0–135.0 135.0–145.0 145.0–155.0
analyzed, totaling more than 60 h of precipitation during the biennium 1994–95. The collections were classified according to intensity (Table 1). Some 30% showed rain rates below 2.5 mm h21, 61% showed rain rates below 5.0 mm h21, and 5% showed rain rates above 25 mm h21. 3. Integral magnitudes The integral magnitudes used in our study are moments of order 0–6. Moments of order n are defined by the general expression: Mn 5 cn
E
`
N(D)D n dD,
(2)
0
where cn are constants defined for each moment, D is the raindrop diameter, and N(D) dD is the number of drops per unit volume with diameters between D and D 1 dD. Moments of order 0, 2, 3, and 6 correspond to total concentration of rain drops NT, optical attenuation S, water content W, and reflectivity Z, respectively. The integral magnitude rain rate R, expressed in millimeters per hour is given as R5
6p 10 4
E
`
N(D)y (D)D 3 dD,
(3)
0
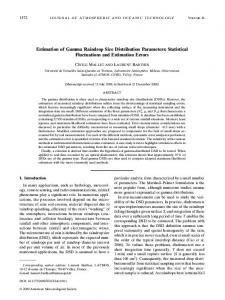
where N(D) is expressed in inverse cubic meters per millimeter. Empirical power relations can be found among the above integral magnitudes and, particularly, between these and the rain rate. Two different procedures were used to obtain Mn–R relationships. The first involved calculating, through least squares analysis, linear relationships between the logarithms of Mn and R. The values of these integral magnitudes were obtained using discrete versions of (2) and (3), following the calculations described by Hauser et al. (1984) (Table 2 and
1472
JOURNAL OF APPLIED METEOROLOGY
TABLE 2. Power laws obtained using a least squares fit between integral magnitudes and rain rate R. NT M1 S W M4 M5 Z
5 5 5 5 5 5 5
263R0.32; 148R0.50; 0.188R0.70; 0.0626R0.91; 139R1.12; 183R1.33; 262R1.55;
r2 r2 r2 r2 r2 r2 r2
5 5 5 5 5 5 5
0.40 0.69 0.90 0.99 0.99 0.95 0.90
Fig. 1). The second procedure was based on the DSD modeling using the moments method.
VOLUME 36
4. Modeling DSD using the moments method To develop a DSD model using the moments method, we must find a function that shares the values of a fixed number of moments—the same number as parameters in the function fitted—with the experimental DSD. To do this, first we grouped the samples according to their rain rate (Table 1). Next, a mean DSD was found for each class and from this several moments or integral magnitudes were computed. The moments chosen were optical attenuation, liquid water content, and reflectivity. By substituting the three different DSD models employed (exponential, gamma, and lognormal) in Eqs. (2)
FIG. 1. Power laws found between the rain rate and other integral magnitudes: (a) total concentration of drops NT, (b) first-order moment M1, (c) optical attenuation S, (d) liquid water content W, (e) fourth-order moment M4, (f) fifth-order moment M5, and (g) reflectivity Z. The dots represent the measurements.
NOVEMBER 1997
1473
CERRO ET AL.
FIG. 1. (Continued)
and (3), a set of expressions for the integral magnitudes was derived as a function of the characteristic DSD parameters for each case. From these relationships, the whole set of parameters that define the DSD model was expressed as a function of the integral magnitudes. Finally, the calculated parameters were expressed as a function of the rain rate. Table 3 and Figs. 2–4 show the dependence of these parameters on the rain rate, mostly as a power function. The first and most frequently used DSD model, pro-
posed by Marshall and Palmer (1948), applies an exponential function dependent on one parameter: N(D) 5 N0 exp(2LD),
where N0 is a constant (8000 m23 mm21) and L is a function dependent on rain rate R according to L 5 4.1R20.21 (where L is expressed in inverse meters and R in millimeters per hour). A better agreement with the observations is achieved with two-parameter exponential functions; in this case, N0 is a function of rain rate.
TABLE 3. Parameters of exponential, gamma, and lognormal fitted distributions. Exponential No 5 2.32 3 10 R r2 5 0.61 L 5 3.32R20.18 r2 5 0.95 3
Gamma 0.22
(4)
Lognormal
No 5 8.80 3 10 R r2 5 0.27 a 5 1.27R0.19 r2 5 0.74 L 5 4.05R20.11 r2 5 0.72 3
20.13
Nr 5 194R0.30 r2 5 0.83 Dg 5 0.630R0.23 r2 5 0.97 s2 5 0.191–1.1 3 1022 ln R r2 5 0.72
1474
JOURNAL OF APPLIED METEOROLOGY
VOLUME 36
N(D) 5 N0Da exp(2LD),
(5)
where L is expressed in mm21, N0 in m23 mm212a, and a is dimensionless. A physical interpretation of the parameters of the gamma distribution can be found by relating them to the effective diameter Deff, and the effective variance yeff. Hansen and Travis (1974) defined these two magnitudes as
D eff 5
E E E
`
D 3 N(D) dD
0
.
`
(6)
D 2 N(D) dD
0
y eff 5
`
(D 2 D eff ) 2 D 2 N(D) dD
0
2 D eff
E
.
`
(7)
D 2 N(D) dD
0
Chy´lek et al. (1992) showed that the parameter a could be related with the effective variance as
y eff 5
1 , 31a
(8)
while the effective diameter can be written as D eff 5
2 . Ly eff
(9)
A third model, used by Levin (1971), Bradley and Stow (1974), Markowitz (1976), Ajayi and Olsen (1985), and Feingold and Levin (1986) is the threeparameter lognormal distribution model, which reflects the observed behavior of small drops.
N(D) 5 FIG. 2. Dependence of the exponential distribution parameters: (a) N0 and (b) L on rain rate. The solid circles represent the mean values found for each intensity class.
Despite its improvement over the Marshall–Palmer model, the two-parameter exponential distribution still has some limitations. The capture of small drops by larger ones leads to the fall in raindrop concentration (Fujiwara 1965; Cataneo and Stout 1968; Brazier-Smith et al. 1973; List and Gillespie 1976; Gillespie and List 1979). The exponential model is unable to reflect this fall, overestimating the number of both very large and very small drops (Waldvogel 1974; Joss and Gori 1978). Discrepancies observed between the DSD measurements and the exponential models have led some authors to use other distributions such as the gamma function of three parameters (Ulbrich 1983; Willis 1984).
NT Ï2p sD
F 1 2G
exp 2
1 2
1 2
D ln Dg
2
.
(10)
s
The characteristic parameters of this distribution have a direct physical meaning: NT (m23) is the total number of drops per unit volume, Dg (mm) is the mean diameter of drops, and ln(s) is the standard geometric deviation of ln(D). An alternative method for finding power functions for moments is based upon the dependence of DSD on rain rate. By substituting distributions (4), (5), and (10) and the rain-rate dependencies shown in Table 3, in the integral expressions of the moments in (3), the desired functions are obtained (Table 4). 5. Results and discussion In the previous sections four sets of equations relating each moment Mn and R (Mn–R) have been obtained. The
NOVEMBER 1997
CERRO ET AL.
1475
FIG. 3. Dependence of the gamma distribution parameters: (a) N0, (b) a, and (c) L on rain rate. The solid circles represent the mean values found for each intensity class.
first set is made up of power functions that fit Mn and R through least squares. The other three sets of equations— also power functions—are commonly used to obtain Mn from R, except in the case of the Z–R relation, where R is calculated from the reflectivity measurements of meteorological radars. To find which Mn–R relation best estimates the observations, we established a comparison between two computations of R. For the first computation we used the rain-rate value obtained for the size and velocity histograms measured by the disdrometer. For the second we used the value from the same histograms of each moment and the relationships between these and the rain rate. Relative differences between these two rain rates are shown in Tables 5, 6, 7, and 8. The greatest relative global differences are those produced by the total concentration of rain drops N T, which is extremely large for the exponential distri-
bution. From the variation of the relative differences with rain rate shown in Table 6, it can be concluded that for low-order moments the relationships derived from exponential distribution underestimate the rain rate. In fact, this distribution produces the worst results, especially for low-order moments. This can be explained by the coincidence of two factors: overestimation of the number of small drops, and the similar contribution of both large and small drops to loworder moments. For moments of higher order, on the other hand, the greater number of large drops masks the lack of accuracy in the representation of the small drops hence the error in the determination of the moment is lower. However, for low-order moments, the sum of these two factors generates an overestimation of the moments, which, consequently, become higher as the order of the moment decreases.
1476
JOURNAL OF APPLIED METEOROLOGY
VOLUME 36
FIG. 4. Dependence of the lognormal distribution parameters: (a) NT, (b) Dg, and (c) s2 on rain rate. The solid circles represent the mean values found for each intensity class.
The gamma distribution generates the smallest differences for medium- and low-order (0–4) moments. The good results of this distribution can be attributed to its ability to reproduce raindrop size and velocity distributions over the whole range of drop diameters, TABLE 4. Power laws derived from exponential, gamma, and lognormal fitted distributions. Exponential NT M1 S W M4 M5 Z
5 5 5 5 5 5 5
699R0.40 211R0.58 0.199R0.75 0.0601R0.93 138R1.11 208R1.29 376R1.46
Gamma NT M1 S W M4 M5 Z
5 5 5 5 5 5 5
272R0.26 148R0.50 0.183R0.72 0.0624R0.92 151R1.10 229R1.27 402R1.44
Lognormal NT M1 S W M4 M5 Z
5 5 5 5 5 5 5
194R0.30 134R0.52 0.177R0.73 0.0600R0.93 141R1.12 210R1.30 377R1.46
including small drops, which are not properly represented by an exponential distribution. On the other hand, the Z–R and Mn–R relationships obtained with the gamma distribution do not provide as good results as those produced by the relations obtained with the lognormal and exponential distributions. Although several studies confirm that the exponential distribution underestimates the number of smallest and largest raindrops (Willis 1984; Joss and Gori 1978), this inaccuracy is nevertheless balanced by its much better estimation of drops in the range that contributes most to reflectivity. The relationship between reflectivity and rain rate is especially relevant for its application in radar meteorology—though not without some problems that are beyond the scope of this paper. It is important to note that the threshold of 50 mm
NOVEMBER 1997
1477
CERRO ET AL.
TABLE 5. Relative differences (%) in the computation of R from the Mn–R relations obtained using the least squares fit shown in Table 2. R Class
NT
M1
S
W
M4
M5
Z
OA OB 1 2 3 4 5 6 7 8 9 10 11 12 13 14 15 Global
2113.7 8.2 0.1 22.0 1.0 25.5 214.8 23.3 0.0 24.8 22.9 6.9 22.9 1.0 20.3 18.4 20.8 230.3
253.0 3.0 1.2 22.3 21.8 23.7 26.4 22.5 0.7 0.6 1.1 9.0 3.6 6.0 7.3 13.0 6.9 214.2
220.0 0.9 0.8 21.1 21.4 22.0 23.0 21.3 0.5 0.7 1.0 5.3 2.8 3.8 4.6 6.4 5.2 25.4
4.6 20.0 20.0 20.2 20.1 20.1 20.5 0.2 1.0 1.0 1.0 2.2 1.7 1.6 1.6 2.3 2.4 21.3
24.7 20.4 20.8 0.4 1.1 1.5 1.3 1.4 1.5 1.4 1.1 0.2 0.9 0.3 20.2 0.2 0.0 6.9
41.1 20.5 21.3 0.7 2.0 2.5 2.5 2.1 1.8 1.7 1.0 21.2 0.2 20.7 21.3 21.0 22.0 11.5
53.9 20.5 21.6 0.9 2.5 3.1 3.1 2.3 1.6 1.5 0.6 22.4 20.6 21.6 22.0 22.0 23.7 15.1
h21, sometimes used to distinguish convective precipitation, is not especially significant in this analysis of rain-rate classes. In fact, no appreciable differences between rain rates higher and lower than 50 mm h21 can be inferred from these results. The Z–R relationships obtained using exponential and lognormal distributions globally improve the results derived from the gamma distribution. However, this is not the case for all intensity classes. For intensity class 10, 12, 13, 14, and 15 the differences associated with the gamma distribution are less significant than those associated with lognormal distribution. Taking this into account, a new Z–R relation might be considered by selecting the most accurate approach in each rain-rate interval. Because the improvement attained with such a new Z–R relation would be insignificant, a single Z– R function for the entire rain-rate interval seems to be
the most appropriate; in this case, the relation was obtained using the exponential distribution. Z(R) 5 376R1.46.
(11)
Other Z(R) relationships have been found for intense convective precipitation: Z 5 500R1.5 (Joss et al. 1970) and Z 5 400R1.3 (Austin 1987). Because high rain rates associated with these rainfall regimes are similar to those observed in Barcelona, these two relations seem to be the most appropriate to compare with the Z–R relation obtained here. Reflectivity values given by (7) fall within those calculated with the Joss and Austin functions: the former slightly higher and the latter slightly lower. In both cases the differences for the whole range of intensities were less than 6%. Austin obtained other relationships for different conditions: Z 5 230R1.2 for moderately convective events
TABLE 6. Relative differences (%) in the computation of R from the Mn–R relations obtained using the exponential distribution shown in Table 3. R Class
NT
M1
S
W
M4
M5
Oa Ob 1 2 3 4 5 6 7 8 9 10 11 12 13 14 15 Global
21042.4 2213.6 2141.4 2106.3 293.1 291.6 295.3 283.2 278.6 280.6 277.9 268.4 275.3 271.2 271.0 256.0 270.0 2419.1
2288.8 259.4 241.7 235.6 232.5 232.6 234.0 229.8 226.6 226.3 225.5 218.2 222.7 220.4 218.9 213.9 218.9 2117.6
255.4 212.5 210.0 210.6 210.5 210.9 211.7 210.0 28.3 28.1 27.7 23.7 26.0 25.0 24.3 22.6 23.6 223.9
19.4 1.4 20.1 20.9 21.0 21.1 21.6 20.9 20.2 20.2 20.3 0.9 0.3 0.3 0.2 1.0 1.0 5.9
29.2 1.4 0.8 1.8 2.5 2.9 2.7 2.8 2.9 2.8 2.5 1.5 2.2 1.6 1.1 1.6 1.3 9.3
7.7 25.1 22.7 0.9 2.7 3.6 3.6 3.4 3.1 3.1 2.5 0.2 1.7 0.8 0.3 0.6 20.4 0.1
Z 231.5 215.0 28.2 21.8 0.9 2.2 2.6 2.0 1.6 1.6 0.8 22.2 20.2 21.2 21.5 21.4 23.2 216.2
1478
JOURNAL OF APPLIED METEOROLOGY
VOLUME 36
TABLE 7. Relative differences (%) in the computation of R from the Mn–R relations obtained using the gamma distribution shown in Table 3. R Class
NT
M1
S
W
M4
M5
Z
OA OB 1 2 3 4 5 6 7 8 9 10 11 12 13 14 15 Global
2163.6 23.4 17.3 16.6 20.8 13.2 1.9 16.2 20.4 14.6 17.0 29.1 17.0 21.9 20.3 43.4 19.8 232.9
251.5 3.0 1.0 22.5 22.0 23.9 26.6 22.7 0.5 0.3 0.8 8.7 3.3 5.7 7.0 12.7 6.6 213.9
27.3 1.5 0.2 22.2 22.7 23.4 24.4 22.8 21.0 20.9 20.6 3.5 1.1 2.0 2.8 4.6 3.4 21.8
5.3 20.4 20.5 20.7 20.6 20.6 21.0 20.3 0.5 0.5 0.5 1.6 1.1 1.0 1.0 1.8 1.8 1.2
20.7 24.4 22.4 20.1 1.0 1.6 1.5 1.7 1.9 1.8 1.5 0.6 1.3 0.8 0.3 0.8 0.6 22.2
219.1 210.1 25.3 20.6 1.5 2.6 2.8 2.6 2.4 2.5 1.9 20.4 1.2 0.3 20.2 0.1 20.8 210.1
247.5 217.3 28.9 21.7 1.3 2.7 3.1 2.6 2.2 2.3 1.5 21.6 0.5 20.5 20.8 20.7 22.4 221.7
associated with cold or stationary fronts and Z 5 100R1.4 for rainfall caused by warm fronts. After comparing (7) with these two relations, the differences increase to 15%. According to this, reflectivities calculated with (7) are closer to the results produced by the Z–R relations obtained for intense convective precipitation than for other rainfall conditions. Acknowledgments. This work was partly supported by the Spanish Direccio´n General de Ciencia y Tecnologı´a (Project AMB94-0948) and the European Commission (Contract EV5V-CT92-0168). We are also indebted to an anonymous reviewer whose comments and suggestions significantly improved some aspects of this paper, and to Frances Luttikhuizen for editing the final draft.
REFERENCES Ajayi, G. O., and R. L. Olsen, 1985: Modeling of a tropical raindrop size distribution for microwave and millimeter wave applications. Radio Sci., 20, 193–202. Atlas, D., 1953: Optical extinction by rainfall. J. Meteor., 10, 486– 488. Austin, P. M., 1987: Relation between measured radar reflectivity and surface rainfall. Mon. Wea. Rev., 115, 1053–1070. Battan, L. J., 1973: Radar Observations of the Atmosphere. The University of Chicago Press, 324 pp. Blanchard, D. C., and A. Theodore Spencer, 1973: Experiments on the generation of raindrop size distributions by drop breakup. J. Atmos. Sci., 27, 101–108. Bradley, S. G., and C. D. Stow, 1974: The measurement of charge and size of rain drops: Part II. Results and analysis at ground level. J. Appl. Meteor., 13, 131–147. Brandt, C. J., 1989: The size distribution of throughfall drops under vegetation canopies. Catena, 16, 507–524.
TABLE 8. Relative differences (%) in the computation of R from the Mn–R relations obtained using the lognormal distribution shown in Table 3. R Class
NT
M1
S
W
M4
M5
Z
OA OB 1 2 3 4 5 6 7 8 9 10 11 12 13 14 15 Global
274.0 97.6 56.2 38.7 37.3 27.7 16.4 27.2 29.9 24.1 25.6 35.2 24.4 28.2 26.3 46.0 25.2 129.8
18.4 14.9 6.9 0.7 0.3 22.1 24.9 21.4 1.5 1.2 1.7 9.1 3.8 6.1 7.2 12.7 6.8 12.0
6.8 3.1 0.5 22.5 23.1 23.9 25.0 23.4 21.8 21.7 21.4 2.6 0.2 1.1 1.8 3.6 2.4 2.8
19.6 1.4 20.1 20.9 21.0 21.1 21.6 21.0 20.2 20.3 20.3 0.8 0.3 0.2 0.2 0.9 1.0 6.0
21.4 21.0 21.1 0.2 1.0 1.4 1.2 1.3 1.4 1.4 1.0 0.1 0.8 0.2 20.3 0.2 20.1 5.6
4.8 26.3 23.8 20.1 1.6 2.5 2.6 2.3 2.1 2.1 1.5 20.8 0.7 20.2 20.7 20.4 21.3 21.6
232.2 215.1 28.3 21.9 0.9 2.2 2.6 2.0 1.6 1.6 0.8 22.2 20.3 21.2 21.5 21.4 23.2 216.4
NOVEMBER 1997
CERRO ET AL.
Cataneo, R., and G. E. Stout, 1968: Raindrop-size distribution in humid continental climates, and associated rainfall rate–radar reflectivity relationships. J. Appl. Meteor., 7, 901–907. Chy´lek, P., P. Damiano, and E. P. Shettle, 1992: Infrared emittance of water clouds. J. Atmos. Sci., 49, 1459–1472. Feingold, G., and Z. Levin, 1986: The lognormal fit to raindrop spectra from frontal convective clouds in Israel. J. Climate Appl. Meteor., 25, 1346–1363. Fujiwara, M., 1965: Raindrop size distributions from individual storms. J. Atmos. Sci., 22, 585–591. Gillespie, J. R., and R. List, 1979: Effects of collision induced breakup on drop size distributions in steady state rainshafts. Pure Appl. Geophys., 117, 599–626. Hansen, J. E., and L. D. Travis, 1974: Light scattering in planetary atmospheres. Space Sci. Rev., 16, 527–610. Hauser, D., P. Amayenc, B. Nutten, and P. Waldteufel, 1984: A new optical instrument for simultaneous measurement of raindrop diameter and fall speed distributions. J. Atmos. Oceanic Technol., 1, 256–269. Joss, J., and E. G. Gori, 1978: Shapes of raindrop size distributions. J. Appl. Meteor., 17, 1054–1061. , K. Schram, J. C. Thams, and A. Waldvogel, 1970: On the quantitative determination of precipitation by radar. Wissenschaftliche Mitteilung Nr. 63, Zurich: Eidgeno¨ssische Kommission zum Studium der Hagelbildung und der Hagelabwehr. Laws, J. O., and D. A. Parsons, 1943: The relation of raindrop-size to intensity. Trans. Amer. Geophys. Union, 24, 452–460. Levin, Z., 1971: Charge separation by splashing of naturally falling raindrops. J. Atmos. Sci., 28, 543–548.
1479
List, R., and J. R. Gillespie, 1976: Evolution of raindrop spectra with collision induced breakup. J. Atmos. Sci., 33, 2007–2013. Lorente, J., and A. Redan˜o, 1990: Rainfall rate distribution in a local scale: The case of Barcelona city. Theor. Appl. Climatol., 41, 23–32. Markowitz, A. H., 1976: Raindrop size distribution expressions. J. Appl. Meteor., 15, 1029–1031. Marshall, J. S., and W. McK. Palmer, 1948: The distributions of raindrop with size. J. Meteor., 5, 165–166. Rice, P. L., and N. R. Holmberg, 1973: Cumulative statistics of surface point rainfall rates. IEEE Trans Comm., 21(10), 1131–1136. Sekhon, R. S., and R. C. Srivastava, 1970: Snow size spectra and radar reflectivity. J. Atmos. Sci., 27, 299–307. , and , 1971: Doppler observations of drop size distributions in a thunderstorm. J. Atmos. Sci., 28, 983–994. Ulbrich, C. W., 1983: Natural variations in the analytical form of the raindrop size distribution. J. Climate Appl. Meteor., 22, 1764– 1775. , and D. Atlas, 1978: The rain parameter diagram: Methods and applications. J. Geophys. Res., 83, 1319–1325. Uplinger, C. W., 1981: A new formula for raindrop terminal velocity. Preprints, 20th Conf. on Radar Meteorology, Boston, MA, Amer. Meteor. Soc., 389–391. Vilar, E., and A. Burguen˜o, 1995: Statistical properties of 49 years of rainfall rate events. Theor. Appl. Climatol., 50, 213–225. Waldvogel, A., 1974: The No jump of raindrop spectra. J. Atmos. Sci., 31, 1067–1078. Willis, P. T., 1984: Functional fits to some observed drop size distributions and parameterization of rain. J. Atmos. Sci., 41, 1648– 1661.