Mathematical Sciences,. Queen Mary, University of London, London E1 4NS, UK ... closed-loop algorithm (TCP) is used to define packet trans- fer. We compare long ..... son, On the Self-Similar Nature of Ethernet Traffic. Proc. ACM SIGCOMM ...
MODELLING OF TCP PACKET TRAFFIC IN A LARGE INTERACTIVE GROWTH NETWORK D.K. Arrowsmith and M.Woolf Mathematical Sciences, Queen Mary, University of London, London E1 4NS, UK ABSTRACT We simulate packet traffic on a large interactive growth network designed to reflect the topology of the real internet. A closed-loop algorithm (TCP) is used to define packet transfer. We compare long range dependent and Poisson sources, and the response of the network to changes in routing queue service rate. By limiting queue length we simulate the effects of packet loss. We vary the pattern of hosts in the network and compare results from different networks generated using the same parameters. The two source types produced very different results highlighting the importance of LRD source models. Results also showed robustness with respect to changes in network and host pattern. This demonstrates the validity of the interactive growth method for characterising real scale-free networks. 1. INTRODUCTION Simulation of packet traffic is a very useful tool in understanding the behaviour of networks. In this paper we attempt to move closer to simulation of real networks without going to the lengths of nearly exact simulation offered by network simulators such as NS [1] and Opnet [2]. These are limited in the size of network they can handle, and the complexity of their models makes extraction of useful information more difficult. Previously we simulated packet traffic in regular networks [3, 4] and compared long range dependent (LRD) [5] sources with Poisson sources. These were open-loop simulations. In the internet transmission control protocol (TCP) dominates. This is a closed-loop protocol. Erramilli et al [6] showed that TCP feedback modifies self-similarity in offered traffic without creating or removing the self similarity itself. For these reasons we have moved to simulations that model in a slightly simplified manner the most commonly used version of TCP. A further aspect of our original simulations was that regular networks were modelled (Manhattan, hexagonal and triangular networks). Clearly this is not close to the real situation. For this paper we have changed to scale-free graphs that match the topology of the internet as closely as possible. Studies of the topology of the internet [7, 8] have shown that it is a scale-free network (Barabasi). Faloutsos et al [9] found that the topology has a power law probability distribution, P (k) ∼ Ck −2.22 , where k is the node connectivity. The interactive growth (IG) networks [10] are created by
mirroring the way in which the internet is generated in reality. Shi and Mondragon [11] have shown that these graphs model both the degree distribution of the actual network and the tier structure. An important feature is the ’richclub’ phenomenon in which important (’rich’) nodes preferentially attach to one another and are also more likely to be connected to by new nodes. The move away from regular networks brought up the problem that some nodes were very highly connected and using the same service rate for each node was no longer appropriate. For this reason we have arranged for the service rate to be linked to the connectivity of each node. 2. NETWORK TRAFFIC MODEL The network topology used was a 1024 node IG network with a power law index of 2.22. Each node is designated as either a host or a router. Routers have a single routing queue that receives packets in transit across the network, and releases them back onto the network at a rate governed by the connectivity of the node. The simulation is of the fixed-increment time advance type rather than next-event time advance [12]. This allows the routing queue service rate to be set as 0.25na packets per time tick of the simulation, where n is the degree. The index a has been chosen to be between 1 and 2 in this paper. Hosts have identical routing queues and function in the same way, but additionally act as sources. They have transmit buffers that hold packets generated by LRD and Poisson traffic sources until they have been acknowledged. The exact mechanism for this is described below. We decided to use a simplified version of TCP Reno [13] as the network protocol. This is the predominate protocol used on the internet at present. This version is derived from that described in Erramilli et al [6]. It concentrates on the slow start mechanism because in real networks this both affects all connections, and is the dominant effect for most connections. It also has a more marked effect on dynamics than congestion avoidance. As in our previous work, a double intermittency map [14] is used as the basis for each LRD traffic source; a uniform random number generator for each Poisson source. However, they are used in a slightly different way. One sojourn period in the ’on’ side represents a whole file which is then windowed using the TCP slow start algorithm: at the start of the file the window size is set to 1. Only a single packet is sent at that time tick. When a packet reaches its destination an acknowledgement is returned to the source:
once this packet has been acknowledged, the window size is doubled and the next two packets are sent. When both these packets have been acknowledged, the window size is doubled again and a new window of packets is sent. The doubling process is repeated until the end of the file or the maximum window size is reached which is constant until the end of the file is reached. (Congestion avoidance is not modelled for the reason given above.) Thus the dynamics now involves not only a dynamical packet traffic mechanism but also window size dynamics. We use the family of Erramilli interval maps, [14], f = f(m1 ,m2 ,d) : I → I, where ( x + (1 − d) (x/d)m1 , x ∈ [0, d], f (x) = (1) x − d ((1 − x)/(1 − d))m2 , x ∈ (d, 1], Here d ∈ (0, 1), and the parameters m1 , m2 ∈ [3/2, 2] induce map intermittency. The map f is used to produce an orbit of real numbers xn ∈ [0, 1] which is converted to binary sequence by associating the symbols ‘0’ or ‘1’ to the intervals [0, d], (d, 1] respectively. It is this binary output that is seen to represent the packets output of a host. This dynamical output is augmented by a window variable on the same time base. At a given node i of the network, and time t = n, there is a current state xi (n), and also a current window size, wi (n), for the number of packets that can be sent at time t = n. There is also a residual file size si (n), at node i which is given by the number of iterates of f such that f si (n) (xi (n)) > d, and f si (n)+1 (xi (n)) < d. The source will send pi (n) = min{wi (n), si (n)} packets. The full dynamics therefore takes the form, see [6]: xi (n) < d, i.e. no packet mode - wi (n + 1) = 0, and xi (n + 1) = f (xi (n)). For xi (n) > d, i.e. packet mode ( 1, if xi (n − 1) < d, wi (n + 1) = min{2wi (n), wmax }, otherwise, (2) and xi (n + 1) = f pi (n) (xi (n)). The above assumes all packets in a window are acknowledged within the retransmission timeout (RTO). If not so the window is sent again with the RTO doubled and window size reset to 1. During the ’off’ periods of the map the window size is set to zero and no packets are sent. The initial RTO size is calculated using the standard exponential average method [15]. The chosen routing algorithm is similar to that used previously for regular networks [3]and [4] Before the simulation starts an all-pairs shortest path algorithm is used to calculate shortest paths between all pairs of hosts in the network (all links between nodes are assumed to have unit length). This is read in as a look-up table and consulted whenever a packet is to be moved from a node. At each time step packets are forwarded from the head of each routing queue. Any acknowledgements reaching their destination trigger the release of the next window of packets from that host. The number forwarded is governed by the service rate formula [1]. The rules for forwarding packets are as follows: A neighbouring node with the shortest path to the destination is always selected. Often more than one neighbour shares this minimum distance, in which case the link that
� ! " � � � � � � � �
� � � � ����� ��������� ����� �� � ��������� �� � � ��������������� �#��$��������� ����� � �
� � � ������ ����� ������ �����
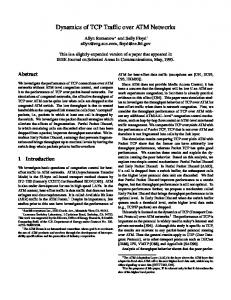
Figure 1. Comparisons between the open-loop simulations of [3] and the new closed-loop simulations on scale-free IG networks of the same size and host density.
has had fewest packets forwarded across it is selected. If these counts are equal a random selection is made. If the selected neighbour has reached is routing queue length limit the packet is dropped. 3. SIMULATION RESULTS This work is an extension of previous work with regular lattices and open-loop traffic, see [3] and [4]. For our network we chose a 1024 node IG network. For more realism, we took all nodes with a degree 1 or 2 to be hosts, the rest were chosen to be routers. In Fig. 1 hosts were selected randomly. Clearly the IG networks with TCP become congested much more rapidly and have much lower throughputs. The reason for this becomes clear when you consider the TCP. The requirement that packets be acknowledged before the next window is sent is quite conservative. It means that hosts cannot send new windows more frequently than the round trip times. Any congestion is reacted to immediately because this increases RTT’s and effectively backs off the sources. Since file sizes are not that big and window sizes are often reset to 1 because of the RTO limit, throughput can never be that high. The IG network with TCP therefore has much lower capacity than the open loop networks. In fact if TCP were used with a regular network this would perform even more poorly because of the longer average path length in the network. For this reason more detailed comparisons between these simulations and our earlier work are not possible. Note that average lifetimes includes the waiting time in transmit buffers. Real systems would not include this. In addition loads quoted are those offered to the transmit buffers, rather than the load exiting theses buffers. We have done this to allow the end users experience to be modelled. In fig. 2 we compare different sources and routing queue service rates. As before a 1024 node IG network is used. All nodes with degree 1 or 2 (589 out of the 1024) are set as hosts, the rest as routers. There is a marked differ-
����� �/ 0 1 / 0 1 � � � � � � � � � � � � � � � � � � � � � � � � � ���� 2 � � � � � � � � � � �
�
� � �
� 3���45 ��� 3���������45 2 � � � � � � � � ��� � � � ) * , ��" %��# �&' � � � �����!" #�$" �!� �( �+ � � �.#������ ������ -
Figure 2. The number of packets that can be served at each time instant is increased according to a power law na , where n is the degree of the node and a = 1, 1.1, 1.5, 2.
Figure 3. Queue lengths for host nodes of an IG network are shown as load increases, for both Poisson and LRD sources.
ence between LRD sources and Poisson sources. Comparing throughputs for the two source types at the lower server index values of 1 and 1.1, behaviour is similar. Throughput matches load up to a threshold, and then levels out. However, this threshold is more than 50% higher for Poisson sources. For a = 1.5, throughputs are similar, with no discernable threshold. For the highest server strength the situation is reversed and the network with LRD sources has a higher throughput, able to handle the maximum load applied to it without becoming overloaded. Average lifetimes behave similarly to open loop simulations in that, for low loads lifetimes for Poisson sources are much less than for LRD. In Poisson sources we see the same transition seen in the open-loop case from free to congested. As the service rate is increased this transition becomes less and less sharp. This is because the increasing network capacity slows the onset of congestion. Fig. 3 illustrates the behaviour of transmit queue lengths and routing queue lengths. Transmit queue lengths reflect
���� �������������� � � � � � � � � � � � � � � ��! � � � � � � � � � � � � �
� �
� �
� � � ��"# ! ��"# ��������������� � �.5 �.?� / ��+,-./ �3 �) �,�'&?��� �0 �@ / $ %&'() %* 1 6 .%5 : ; 4 4 = > : 8 (4 () (%) 0 &���3 / +'9�&(3 &+/ ,) 0 < ,��3 +/ ) 2 7��&,+08 2 2
Figure 4. Effect of varying queue length limit on average packet lifetime and throughput for LRD and Poisson sources.
the behaviour seen in the average lifetimes for both types of source. At low loads they are very small, as loads increase they rise rapidly. As routing queue service rates increase maximum queue lengths do not change greatly, but the number of long queues reduces. The reason for this is a subject for further investigation. Routing queues are much shorter than transmit queues. For the LRD sources there is no well defined pattern to the queues, except that they all occur in the higher degree half of the plots (plots are arranged in order of degree). The behaviour for Poisson sources is a bit different. Queue lengths are much shorter. There is a clear progression in size as the load increases, and the same nodes produce queues at different loads. The fact that certain nodes become congested whatever the load suggests that the distribution of nodes is important. At higher server strengths the most highly connected nodes become dominant (and produce the longest queues). The much longer queues seen in the transmit buffers show that these queues are the dominant factor contributing to average lifetimes. In real networks packets are dropped. We simulated this by limiting the length of the routing queues. Fig. 5 shows data for the same network and host pattern for four different queue limits. The server index value is 1. It should be noted that we have simulated very severe packet loss here - this does not equate to the level of packet loss in real networks. In the LRD case decreasing the queue limit reduces the average lifetime considerably. With a queue limit packets get dropped at the routers and are therefore re-sent more frequently, resulting in shorter waits in the transmit buffer. The effect is more pronounced for the very low queue length limit. Average lifetimes for Poisson sources behave quite differently. For lifetimes peak at a load of 0.3 for the queue limit of 5. As the queue limit is raised this peak shifts to higher load values. With an infinite queue the lifetime curve has the familiar ’s’ shape. Throughputs for LRD sources are greatly reduced when a queue limit is imposed. For the smaller queue limits throughput is very low indeed.
��"� � �� � �!���������" � � � � � � � � � � ���# � � � � � � �
�
�
� � � � � � �
� � � �
�
� � � � � � � � �
���� ��
��� �!���������# ��*21+. � ' $%& ,1��+. 2 3 ' ( ) *+,-��' ./0 -4 -��� ���� � �����
Figure 5. Average lifetime and throughput characteristics for different topological spreads of hosts in an IG network.
For Poisson sources throughput is similar for the queue limit of 100, but again greatly reduced for the smaller queue limits. Even so, these throughputs are still much greater than for the LRD sources. This is linked to the shorter queues for Poisson sources. Most are less than a 100 so this limit has little effect. Fig. 4 shows results from the same IG network, but with the host pattern changed so that hosts are selected randomly, but with the same density (589 out of 1024). Results are similar, but the network with randomly placed hosts always performs better than the one with hosts placed at the low degree hosts. Average lifetimes are lower and throughput slightly higher. All results have been repeated with different random selections of host, and different IG networks with the same parameters. These results have been very similar, showing a high degree of robustness in our results. 4.
CONCLUSION
We have extended our earlier work with regular lattices and open-loop packet traffic algorithms. The use of large IG networks and the TCP protocol have brought us much closer to simulating the internet and other scale-free networks. The robustness of the results with respect to changes in IG network, and changes in host pattern validate the IG method as a way of characterising real scale-free networks such as the internet. They also show the same kind of repeatability seen in our previous work. Scale-free networks clearly have very different properties to regular networks. The fact that a small number of nodes have very high degree is probably the major point of difference. For this reason we have only made rough comparisons between the two types of graph. The most outstanding differences are found when comparing throughput for LRD and Poisson sources. Clearly the bursty property of LRD sources can have a very pronounced effect in terms of queue build up when several highly connected nodes are adjacent to one another. Very high server rates can overcome the problems caused by LRD
sources, and even improve throughput over Poisson sources in extreme cases. We have simulated very severe packet loss. This has a dramatic effect on throughput, but should not be equated with the real world situation. Our results show what the user experiences when the network is presented with a much higher load than it can easily handle. At very low loads the TCP mechanism would prevent the network ever getting congested. TCP is a very effective control mechanism in this sense. We have used large networks, but studies of larger ones are preferable which may be possible in future work. 5. REFERENCES [1] The Network Simulator 2, ns2 http://www.isi.edu/nsnam/ns/. [2] Opnet, Opnet Tech. Inc.-http://www.opnet.com. [3] M. Woolf, D.K. Arrowsmith, R.J. Mondragon, J.M. Pitts, Optimization and phase transitions in chaotic model of data traffic, Phys. Rev E, 66, 046106 (2002). [4] D.K. Arrowsmith, R.J. Mondragon, J.M. Pitts, M. Woolf, Internet packet traffic congestion, Proc Int. Sym. Cir. and Sys., 2003, ISCAS ’03., 3, 2003, 746 -749. [5] W.E. Leland, M.S. Taqqu, W. Willinger and D.V. Wilson, On the Self-Similar Nature of Ethernet Traffic. Proc. ACM SIGCOMM 93, 1993. [6] A. Erramilli, M. Roughan, D. Veitch and W. Willinger, Self-Similar Traffic and Network Dynamics, Proc. IEEE, 90, 2002, 800-819. [7] R.Albert and A-L Barbasi, Statistical Mechanics of Complex Networks, Rev. Mod. Phys. 74, 47 (2002). [8] L. Subramanian, S. Agarwal, J. Rexford and R. H. Katz, Characterizing the Internet Hierarchy from Multiple Vantage Points, Proc. of INFOCOM 2002, June, 2002. [9] M. Faloutsos, P. Faloutsos, and C. Faloutsos, On Power-Law Relationships of the Internet Topology, Proc. ACM/SIGCOMM, Comput. Commun. Rev., 29, 251-262, 1999. [10] S. Zhou and R. J. Mondragon, Towards modelling the Internet topology - the Interactive Growth model, Proc. of the 18th Int. Teletraffic Cong., ITC18, Berlin, 2003. [11] S. Zhou and R. J. Mondragon, The rich-club phenomenon in the Internet topology, to appear IEEE Communications Letters , 2003. [12] A.M. Law and W.D. Kelton, Simulation Modeling and Analysis, 3rd Edition, McGraw-Hill, 2000. [13] W. R. Stevens, TCP/IP Illustrated, Volume 1: The Protocols, Addison-Wesley, 1994. [14] A Erramilli, R.P. Singh and P.Pruthi, Proc. of the 14th Int. Teletraffic Conf. 1994, edited by James W. Roberts (Elsevier, Amsterdam, 1994), 329-38. [15] W. Stallings, Data and Communications, Prentice Hall Int. Inc.,2000.