78
Int. J. Data Mining and Bioinformatics, Vol. 7, No. 1, 2013
Modelling splice sites with locality-sensitive sequence features Sing-Wu Liou Graduate School of Engineering Science and Technology, National Yunlin University of Science and Technology, 123 University Road, Section 3, Touliu, Yunlin, Taiwan 640, ROC Fax: 886-5-531-2063 E-mail:
[email protected]
Yin-Fu Huang* Department of Computer Science and Information Engineering, National Yunlin University of Science and Technology, 123 University Road, Section 3, Touliu, Yunlin, Taiwan 640, ROC Fax: 886-5-531-2063 E-mail:
[email protected] *Corresponding author Abstract: The splice sites are essential for pre-mRNA maturation and crucial for Splice Site Modelling (SSM); however, there are gaps between the splicing signals and the computationally identified sequence features. In this paper, the Locality Sensitive Features (LSFs) are proposed to reduce the gaps by homogenising their contexts. Under the skewness-kurtosis based statistics and data analysis, SSM attributed with LSFs is fulfilled by double-boundary outlier filters. The LSF-based SSM had been applied to six model organisms of diverse species; by the accuracy and Receiver Operating Characteristic (ROC) analysis, the promising results show the proposed methodology is versatile and robust for the splice-site classification. It is prospective the LSF-based SSM can serve as a new infrastructure for developing effective splice-site prediction methods and have the potential to be applied to other sequence prediction problems. Keywords: splice sites; modelling splice sites; splice site classification; locality-sensitive sequence features; splicing signals. Reference to this paper should be made as follows: Liou, S-W. and Huang, Y-F. (2013) ‘Modelling splice sites with locality-sensitive sequence features’, Int. J. Data Mining and Bioinformatics, Vol. 7, No. 1, pp.78–102. Biographical notes: Sing-Wu Liou received his BS Degree in Engineering Science from the National Cheng-Kung University, Tainan, Taiwan in 1998. He is now a PhD student of Engineering Science and Technology at the National Yunlin University of Science and Technology, His research interests focus on bioinformatics, especially in predicting regulatory sites in gene expression pathway including splice sites, transcription factor binding sites and microRNA target sites.
Copyright © 2013 Inderscience Enterprises Ltd.
Modelling splice sites with locality-sensitive sequence features
79
Yin-Fu Huang received the BS Degree in Computer Science from National Chiao-Tung University in 1979, and the MS and PhD Degrees in Computer Science from National Tsing-Hua University in 1984 and 1988, respectively. He is currently a Professor in the Department of Computer Science and Information Engineering, National Yunlin University of Science and Technology. Between July 1988 and July 1992, he was with Chung Shan Institute of Science and Technology as an Assistant Researcher. His research interests include database systems, multimedia systems, data mining, mobile computing, and bioinformatics.
1
Introduction
Splice sites are the boundaries of adjacent exons and introns in primary transcripts, which are essential for determining the structures and functions of genes (Crick, 1979). There exist some cis-acting elements in close proximity of splice sites, such as the consensus sequences of 5′ and 3′ splice sites (5′ss, 3′ss) (Sharp, 1987), the Poly-Pyrimidine Tract (PPT) in 3′ss intronic flanking regions (Coolidge et al., 1997) and exonic/intronic splicing enhancers (Wu et al., 2005; Venables, 2007), which are crucial for the spliceosome to recognise the splice sites; these well-known splicing signals form the infrastructures defining the splice sites in vivo (Crick, 1979; Hastings and Krainer, 2001; Schellenberg et al., 2008). From the perspective of pre-mRNA maturation, there are core and auxiliary splicing signals fundamental to the splicing events. The 5′ss/3′ss consensus sequences are clearly the core signals that specify the locations of removing introns and joining exons; the 5′ss/3′ss are usually represented by 5′-GTRAGT-3′ and 5′-NYAG-3′ (Patel and Steitz, 2003) (where Y is C or T and R is A or G; the GT in 5′ss consensus and AG in 3′ss consensus are the invariant dinucleotides specifying the splice sites); another core signal is the PPT, which is a C/T rich region (Coolidge et al., 1997). As for the auxiliary splicing signals, e.g., the G-triplet splicing enhancers (McCullough and Berget, 1997), tandem triplet repeats (Zhuo et al., 2007) and pyrimidine-/purine-rich motifs (Dixon et al., 2007), they serve to recruit trans-acting factors to facilitate the splicing process. Splice sites are powerful signals used by gene prediction programs, and Splice Site Modelling (SSM) is crucial in searching themselves with high accuracy (Brent and Guigo, 2004). However, the well-known splicing signals are not ready-to-use sources for SSM (Chasin, 2007); the obstacles mainly exist in their in vivo conceptual and ambiguous definitions. Therefore, in the stage of SSM while developing a splice site prediction method, most of existing works devoted to discovering computational sequence features, such as the complicated base dependencies (Burge and Karlin, 1997; Degroeve et al., 2002; Saeys et al., 2003) and discriminative sequence motifs (Nakata et al., 1985; Mengeritsky and Smith, 1989; Claverie et al., 1990; Solovyev et al., 1994). By having an insight into the contexts of core and auxiliary splicing signals, it is found that almost all of them are located within specific positions or ranges around the flanking regions of splice sites. For example, the G-triplets splicing enhancers are found in 5′ss intronic flanking regions (McCullough and Berget, 1997), the PPT is located within 14 to 26 nucleotide region at the upstream of 3′ss (Reed, 1989), the exonic splicing enhancers have increased density at exon ends (Dewey et al., 2006) and so on. Observing that the
80
S-W. Liou and Y-F. Huang
core signals are position-specific and the auxiliary signals are range-specific, thereby, they are defined as Locality Sensitive Features (LSFs) in this study. The LSFs are further divided into two categories: the Pervasively-Observable Sequence Features (POSFs) and the Locally-Recurrent Sequence Features (LRSFs), where POSFs/LRSFs are the observable sequence patterns after performing the global/local sequence alignment. In other words, the LSF-mining processes consider both global and local information in sequences; such an idea had been shown to effectively promote the performance in RNA classification (Wang and Wu, 2006). Accordingly, the 5′ss and 3′ss consensus sequences are POSFs; the auxiliary sequence features, such as PPT and splicing enhancers, are LRSFs; all of these critical sequence features for splicing had been recruited in the LSF splice site models. The LSF splice site models comprise POSFs and LRSFs, which are concretised based on the Multifaceted Sequence Patterns (MSPs) (Liou et al., 2009). By modifying and extending the MSP-mining methodology, SSMs attributed with the LSFs are then applied to six model organisms including Human, Mouse, Rat, C. elegans, Arabidopsis and Drosophila. The general applicability and usefulness of the LSF-based splice site models are rigorously examined in terms of accuracy/sensitivity/specificity and Receiver Operating Characteristic (ROC) analysis. The average accuracies in 5′ss and 3′ss classification of the six organisms are 0.90 and 0.84, respectively; moreover, the average value of AUC-ROC (the area under the ROC curve) is 0.95 for 5′ss experiments and 0.90 for 3′ss. The promising results demonstrate the LSF-based SSMs are versatile and robust. The remaining of this paper is organised as follows: Related work is firstly reviewed; next, the procedures of mining LSFs are described in Methods; then, the performances of LSF-based splice site models are shown in Results; finally, Discussion and Conclusions provide insights into the experimental results and reviews of the important issues about this work.
2
Related work
Sequence features used to characterise splice sites can be divided into two categories: Position-Dependent Features (PDFs) and Composition-Discriminant Features (CDFs); PDFs focus on the dependencies of adjacent positions near splice sites, while CDFs aim at the discriminative sequence motifs between the authentic and pseudo sites. The Positional Frequency Matrix (PFM), Positional Weight Matrix (PWM) (Staden, 1984) and Weight Array Matrix (WAM) (Zhang and Marr, 1993) are the most popular PDFs, which model the dependencies between adjacent base positions. Some other PDFs focus on the dependencies of correlated positions, such as the Maximal Dependence Decomposition (MDD) (Burge and Karlin, 1997) identifying the most significant relationships between base positions; the estimation of distribution (EDA) (Saeys et al., 2003), the Backward Feature Elimination (BFE) (Degroeve et al., 2002) and the Univariate Marginal Distribution Algorithm (UMDA) (Saeys et al., 2004) find the correlated positions by eliminating the least relevant positions. As for CDFs, they try to find the statistically significant sequence motifs; e.g., the Discriminant Index (DI) (Claverie and Bougueleret, 1986) identifies the k-tuple reference profiles; the Increment of Diversity combined with Quadratic Discriminant analysis (IDQD) (Mengeritsky and Smith, 1989) compares the compositional features between exons and introns; the octa-nucleotides in the intronic and coding regions were
Modelling splice sites with locality-sensitive sequence features
81
found to be useful in characterising the splice sites (Staden, 1984). Identification of PDFs usually resorts to mathematical and statistical analysis and identifying CDFs is mainly based on the expertise of splicing-related signals; in other words, the PDFs are computation-based features, while CDFs are knowledge-based features. As for the proposed LSF model, it compromises the advantages of PDFs and CDFs by selecting features using statistics with the support of a priori domain knowledge. Briefly, the LSFs are biologically motivated feature sets, similar idea had also been proposed for detecting the protein homology (Huang and Pavlovic, 2008).
3
Methods
3.1 Feature mining for LSFs 3.1.1 Feature granularity escalation POSFs and LRSFs are frame-based sequence features, where one frame is a 5-mer sequence segment as defined in the Frame-Relayed Pattern Model (FRPM) (Liou and Huang, 2008). The frame size of 5 base pairs is decided by the minimum length needed to simulate the ±1 reading-frame shift for a trinucleotide, which is suitable to perform the local three-codon measuring (Jiang and Yan, 2008). The contents of a LSF model consist of strong features (PO1 and PO2) and weak features {LR1 and LR2) by searching from beginning to end of the splice-site sequences. The granularities of PO features are escalated from mono-nucleotide to trinucleotide within a single 5-mer frame, which correspond to the significant positional mononucleotides (denoted by PO1) and well-aligned trinucleotides within a single frame (denoted by PO2), respectively. The granularities of LR features are escalated from uni-frame (denoted by LR1) to multi-frame (denoted by LR2), where LR1 represents the trinucleotides distributed evenly in one frame and LR2 represents the trinucleotides clustered within multiple adjacent frames. Under the processes of feature granularity escalation, the strength of features decreases as the granularity increases.
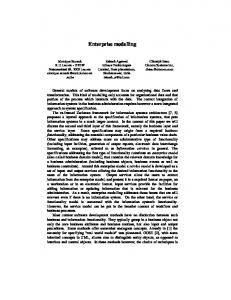
3.1.2 Procedures of LSF-mining The procedures for mining LSFs are shown in Figure 1, and mainly consist of three processes: firstly, the data reduction and transformation, then the statistics and data analysis, and finally the outlier detection. Detailed descriptions and explanations are given in the following sections.
3.2 Data reduction and transformation 3.2.1 Formulating the LSFs The true 5′ss/3′ss sequences are firstly reduced to PFMs, which are then used to build a 3-periodic Hidden Markov Model (HMM) to estimate the frequencies of positional trinucleotides. The actual frequencies of positional trinucleotides are in fact unknown and unavailable (i.e., they are hidden states); therefore, instead of simply counting the frequencies of the 64 possible trinucleotides from the data sets, a simple 3-period HMM with one ‘match’ state for each position is used to estimate the frequencies of
82
S-W. Liou and Y-F. Huang
positional trinucleotides, where consecutive match states are separated by transitions of probability 1 (i.e., the probabilities of ‘insert’ and ‘delete’ states are set to zero); the output probabilities for each of these match states are based on the positional frequencies of specific nucleotides estimated in the data sets. The estimated frequencies of positional trinucleotides are then sent to the Maximum-Minimum-Summation (MMS) parser to prepare data for mining LSFs. By extending and modifying the Depth-Breadth Fused Codon Analyses (DBFCA) (Liou and Huang, 2008), three new operations, maximum (MAX), minimum (MIN) and summation (SUM) are introduced as defined in equations (1)–(3), SFmax = { f | f = MAX ( f1i , f 2i , f 3i ), i = 1 tok}
(1)
SFmin = { f | f = MIN( f1i , f 2i , f3i ), i = 1 tok}
(2)
SFaum = { f | f = SUM( f1 j , k , f 2j , k , f3 j , k ), k = j > 1}
(3)
where k is the number of overlapped 5-mer frames of the splice site sequence, f1i , f 2i , and f 3i are the frequencies of patterns estimated at the position 1, 2 and 3 of ith frame, and f nj , k is the frequencies estimated between frame j and frame k (k – j > 1). The meanings and functions of MAX-MIN-SUM operations are depicted in Figure 2. Figure 1
The procedures for mining LSFs. The true 5′ss/3′ss sequences are firstly reduced to PFM, which is further used to build a 3-periodic HMM to estimate the frequencies of the 64 trinucleotides. After the trinucleotide-frequency estimation, the maximum (MAX), minimum (MIN) and summation (SUM) operations and Mahalanobis distance transformation are applied to preprocessing the frequency information for feature mining. The Skewness-Kurtosis Dispatcher (SKD) will select different feature filters according to the preprocessed data by the MMS parser and MDT process; the filters will define the thresholds for being candidates of POSFs and LRSFs
3.2.2 Mahalanobis-distance transformation The Mahalanobis Distances (MD) (Mahalanobis, 1936) is a distance measure taking into account the group means, variances for each variable and the correlations/covariance
Modelling splice sites with locality-sensitive sequence features
83
between measures, which essentially addresses the question of whether a particular case would be considered as an outlier relative to a particular set of group data. Therefore, transforming the PFMs into MD-based matrix could promote the performance in identifying the outliers (i.e., the significant features). The formula of MD transformation is defined in equation (4), MDm = (x – m)tC–1(x –m)
(4)
where MDm is the Mahalanobis distance, x is the vector of data, m is the vector of mean values of variables, C–1 is the inverse of covariance matrix of independent variables and t indicates the transpose operation. Figure 2
The formulation of LSFs. The x-axis is the in-frame position 1, 2, 3 within ith penta-mer frame in splice site sequences; y-axis is the estimated frequencies of specific trinucleotides. (A) The MAX operation aims at position-specific LSFs that represent the positions singularly-loaded with one specific nucleotide. (B) The MIN operation tries to discover frame-specific LSFs which represent those trinucleotides locally aligned or locally distributed (i.e., overrepresented within one frame). (C) The SUM operation devotes to finding trinucleotides clustered within specific ranges (i.e., within multiple contiguous frames). In the figures, ckj is the estimated frequency of one specific pattern; Tallfi is the mean of all the pattern frequencies estimated within frame i, which represents the threshold for being a LSF candidate
3.3 Outlier detection To highlight the most significant sequence features (i.e., the LSFs), the Double-Boundary Filters (DBFs) are introduced; the DBFs use the σ–concessio mechanism starting from µ + 2σ, then down to µ + 2σ and finally to µ + σ. For data set D with mean µD and standard deviation σD, values great than or equal to µD + δ × σD (filter 1) form the candidates of LSFs, which are then in turn checked by the second µD + δ × σD (filter 2) to determine the final LSFs. The DBFs and the corresponding two-layered outlier boundaries are shown in the right side of Figure 1.
3.3.1 Statistics and data analysis The candidates of PO1, PO2, LR1 and LR2 are identified by means of outlier detection, and two descriptive statistics called skewness and kurtosis are used to detect the tendency of outlier existence. Skewness is sensitive to the extreme values, which is highly affected by one or more extreme values of a data set; thus, large skewness values indicate the existence of extreme outliers. Kurtosis is a measure of how outlier-prone a distribution is; a high kurtosis value implies that there exist extreme observations. Skewness and kurtosis are defined in equation (5) and (6),
84
S-W. Liou and Y-F. Huang skewness =
n n x−µ ∑ (n − 1)(n − 2) i =1 σ
3
(5) 4
kurtosis =
n n(n + 1) 3(n + 1) 2 xi − µ − ∑ (n − 1)(n − 2)(n − 3) i =1 σ (n − 2)(n − 3)
(6)
where µ is the mean, σ is the standard deviation, and n is the number of elements.
3.3.2 σ–Concession For data values highly skewed and with high kurtosis, the mean (µ) and standard deviation (σ) will be distorted by extreme values. At this time, it is impractical to define the Outlier Boundary (OB) by simply using µ + σ, µ + 2σ or even the µ + 3σ because that will produce too many outliers. Under such a situation, the frequently used outlier detection method, Tukey’s fences, also does not work effectively. Furthermore, in addition to highly skewed case, slightly skewed data and normal-distribution like data are also considered. Finally, to identify the different levels of LSFs (i.e., the significant outliers in different distribution types of data values), the adaptable Double-OB Filters (DOBFs) are devised to determine the thresholds of being a significant outlier in the data set (i.e., a LSF). The DOBFs use the σ–concession mechanism starting from µ + 2σ, then down to µ + 2σ and finally to µ + σ. For data set D with mean µD and standard deviation σD, values great than or equal to µD + δ × σD (filter 1) form the candidates of LSFs, which are then in turn checked by the second µD + σD (filter 2) to determine the final LSFs. The DOBFs and the corresponding twolayered outlier boundaries are shown in the right side of Figure 3.
3.3.3 Skewness-Kurtosis Dispatcher (SKD) Given n the sample size and M the matrix of transformed MD, an algorithm called SKD is devised to select different outlier detection modules (i.e., the LSF candidate filters) as described in Algorithm 1. The SKD calculates two measures, the Degree of Over-Skewness (DOS) and Tendency of Extreme Outliers (TEO), to decide which LSF filter should be called. The DOS is defined as the ratio of skewness over two times of Standard Errors of Skewness (SES); similarly, the TEO is defined as the ratio of kurtosis over two times of Standard Errors of Kurtosis (SEK). DOS and TEO are defined in equations (7) and (8), respectively. DOS = skewness (M)/(2 * SES)
(7)
TEO = kurtosis (M)/(2 * SEK)
(8)
where the Standard Errors of Skewness (SES) and the Standard Errors of Kurtosis (SEK) are the measures to evaluate the degree of skewness and kurtosis. By definition, SES and SEK equal to 6n and 24n , respectively. If DOS ≥ 1 and TEO ≥ 1 (line 3), which means the data set is highly skewed, SKD selects the PO filters (line 2, both PO1 and PO2 use the hybrid Tukey’s fences filter, which combines the classical Tukey’s fences and one µ + 2σ filter). If DOS ≥ 1 or TEO ≥ 1 (line 3, the data set is slightly skewed), the LR1 filters will be used and the OB will be defined by the double µ + 2σ filters. As for the
Modelling splice sites with locality-sensitive sequence features
85
LR2 filters (line 6), one single µ + σ filter is used to mine features in sequence fractions not occupied by candidates of PO1, PO2 and LR1 after the region-span check procedure as indicated in Figure 1. Figure 3
Double outlier-boundary filters (DOBFs). X-axis is the trinucleotide frequency and y-axis is number of such a kind of trinucleotide. The hybrid Tukey’s fences and µ + 2σ are applied to identify the PO1 and PO1 The outlier boundary of first filter of PO features is defined by the Tukey’s inner fence. Let Q1, Q2 and Q3 be the Ist, 2nd and 3rd quartile values in data set, respectively; the Inter Quartile Range (IQR) is Q3 – Q1 and the Tukey's inner fence is Q3 + (1.5 * IQR). For skewed data set, the Tukey’s fences will produce too many outliers (shadowed by the light grey regions) which need to be checked again by the second filter, the µ + 2σ filter, and the final set of outliers (indicated by dark grey regions) are the PO features. Similar with the procedures discovering PO1 and PO2, LR1 features are identified by double u + 2 × σ a filters. As for LR2 features, the 64 candidate trinucleotides are tend to be normally distributed (by the small SES and SEK values), and LR2 features are identified using single one µ + σ filter (not shown in this figure)
3.4 Model validation 3.4.1 The feature transformation function There are many possible transformation functions to convert the extracted patterns to feature vectors; e.g., frequency counting, information content or binary transformation. To simply test the validity and effectiveness of the LSF models, the simplest function called the binary transformation is selected, which is defined in equation (9), 1 if cp j >0 f ( p jLSFi ) = 0 otherwise
86
S-W. Liou and Y-F. Huang
i i where p LSF is the pattern j (if LSFi ∈ {PO1}, 1 ≤ j ≤ 4 and p LSF is a mononuclotide; j j LSFi otherwise, if LSFi ∈ {PO2, LR1, LR2}, 1 ≤ j ≤ 64 and p j is a trinucleotide), c pi is the i . Using the simple transformation, all the splice site sequences are count of pattern p LSF j reduced to binary feature vectors.
3.4.2 Evaluation measures Appealing for the simplicity and parameterless in selecting a method to validate the LSF models, a simple classifier called the Fisher’s Discriminant Analysis (FDA) is adopted. The applicability and usefulness of LSF models are evaluated under 10-fold cross validation, and three commonly used metrics (i.e., accuracy, sensitivity and specificity) are used to evaluate the experimental results. Accuracy (Acc) is the proportion of positive results in the population as defined in equation (10); sensitivity (Sn) defined in equation (11) measures the proportion of actual positives which are correctly identified as such; specificity (Sp) measures the proportion of negatives which are correctly identified, as defined in equation (12), Accuracy = (TP + TN) /( TP + TN + FP + FN)
(10)
Sensitivity =
TP TP + FN
(11)
Specificity =
TN TN + FP
(12)
where TP is the correctly predicted positives, TN is the correctly predicted negatives, FP is the incorrectly predicted positives and FN is the incorrectly predicted negatives.
3.4.3 The Receiver Operating Characteristic (ROC) analysis To evaluate the performances of LSF models more conscientiously, the ROC analysis (or simply the ROC curve) is used in all the experiments. The ROC curve plots sensitivity on the x_axis and (1 – specificity) on the y-axis, which presents the performances from the perspective of trade-off between the false negative and false positive rates for all the possible discrimination thresholds. The ROC curves evaluate the models from different perspective compared to the accuracy, sensitivity and specificity, and thus provide more information to judge the performances of evaluated models. Moreover, the area under the ROC curve (AUC) is also calculated, which specifically reflects the relationship between sensitivity and specificity; when the values of AUCs approach 1, it means the results come from high-quality tests.
4
Results
4.1 Data collections 4.1.1 Data sets Since approximately 96% of the identified splice sites are canonical sites (Gopalan et al., 2004), only the major-class splice site sequences were considered in this study.
Modelling splice sites with locality-sensitive sequence features
87
The data sets provided by Homo Sapiens Splice Site Dataset (HS3D) (Pollastro and Rampone, 2002) were firstly considered because the aim of HS3D splice-site sequences is to give standardised material to train and to assess the prediction accuracy of computational approaches for gene identification and characterisation (Pollastro and Rampone, 2002). After data cleaning, the HS3D data sets comprise 2796/2880 true and 271,937/329,374 false canonical human 5′ss/3′ss sequences. Following the formats of HS3D sequences, the window size of 140 nucleotides around each splice site is set up for the other data sets. Next, the other splice site sequences were manually collected from the Xpro database (Gopalan et al., 2004), which consist of eukaryotic protein-encoding genes of six model organisms including Homo sapiens (human), Mus musculus (mouse), Rattus norvegicus (rat), Caenorhabditis elegans (C. elegans), Arabidopsis thaliana (Arabidopsis) and Drosophila melanogaster (Drosophila). The number of sequences collected for the experiments of splice site classification will be listed specifically in Tables 1. Table 1
The number of true and false splice site sequences in data sets. The number of sequences collected for the experiments of splice site classification are listed in Table 1, where T represents the true splice site sequences, while F1 and F2 stand for the negative instances (i.e., the false splice site sequences) from different sources; the sequences in F1 were extracted from the intronless genes and the sequences in F2 were from the true introns. Thus, except for the HS3D data set, each data set comprises one positive set T and two negative sets F1 and F2. The accuracies are evaluated by different combination of T with F1, F2 and {F1 ∪ F2}
True/false sites Data sets
T
F2
F1
5′ss
3′ss
5′ss
3′ss
5′ss
3′ss
Human
29,795
30,132
26,109
28,601
414,970
422,080
Mouse
6749
6942
17,346
17,049
65,194
67,024
Rat C. elegans
811
826
1390
1469
4504
4653
44,204
52,261
2695
2750
162,040
161,960
Arabidopsis
51,522
51,376
19,501
19,896
34,858
33,817
Drosophila
28,505
36,131
16,843
17,465
214,910
213,500
The data obtained from Xpro database contains invertebrate (C. elegans, Drosophila), plant (Arabidopsis), primate (Human), rodent (Mouse, Rat) and mammalian (Human, Mouse, Rat), which represent all the eukaryotic gene entries. Thus, the effectiveness, applicability and robustness of the constructed LSF splice-site model can be thoroughly explored. The six model organisms belong to two major divisions: metazoan (Human, Mouse, Rat, C. elegans, Drosophila) and plant (Arabidopsis). The metazoan division can be further divided into three categories: mammal (Human, Mouse, Rat), nematode (C. elegans) and fruit fly (Drosophila). The three homologous species (Human, Mouse and Rat) are used to explore the applicability of the proposed LSF models; the other three heterologous species (C. elegans, Drosophila and Arabidopsis) are used to investigate the robustness of the LSF models.
88
S-W. Liou and Y-F. Huang
4.1.2 Data model Following the FRPM sequence model, the LSF-mining performs the feature selection based on overlapped 5-mer frames as illustrated in Figure 4. The position of a splice site is defined as 0 and the relative positions in the upstream/downstream regions are indicated by negative/positive numbers. Since the proposed LSF splice site models fulfill the full-range exploration on sequences, the window size for feature selection equals to the length of splice site sequences. With 140 bps sequence length, there are 70 bps exonic/intronic flanking regions around a splice site. Figure 4
The 5-mer frame based splice-site analysis model. An implementation of FRPM, the sequences are partitioned into Penta-Mer Frames (PMFs), the last 2 base pairs of each of the PMFs are overlapped with and first 2 base pairs of the adjacent PMF. Every PMF contains three trinucleotides. For a sequence of length k , it comprises (k − 2) / 3 PMFs (the denotes the floor function). The sequences modelled by FRPM keep both the specificity of intra-PMF and inter-PMF tri-nucleotides composition
4.2 Effectiveness of LSF models 4.2.1 The LSF models and the splicing signals The human LSF splice site models as shown in Table 2 were firstly constructed using the HS3D data sets; according to the σ-concession policy, the number of LR1,2 features are expected to be more than that of PO1, 2 features. By examining the contents of LSF, it shows the most important splicing signals were all recruited in the LSF models. The three elements of 5′ss PO1 signify the over-representation of the consensus sequence [G–1]|G1T2N3[A4][G5], where the splice site is represented by a vertical bar and the PO1 features are denoted in brackets (the subscripts denote the positions relative to the 5′ss). As for the four PO2 features of the 5′ss, the specific contents are [G–1|G1T2], [G1T2G3], [A–2G–1|G1] and [G1T2A3], which give a clear decomposition of the major-class 5′ss consensus. As for the 3′ss, the only one identified PO1 feature is [C–3]A–2G–1] and the two PO2 features are [C–3A–2G–1] and [A–2G–1|G1]; both of them clearly represent and decompose the composition of the well-known short 3′ss consensus [C–3A–2G–1|G1]. The LRi features for the 5′ss are [GGG]14, [GGG]3, [GGG]3and [GCG]2 (the superscripts are the number of such a kind of LR1 features), which contain 14 G-triplet (i.e., the [GGG]14) and each of them are identified at different positions of intronic flanking regions; it is obvious the well-known G-triplet intronic splicing enhancers (Mahalanobis, 1936) were recruited in the LSF models. Furthermore, by combining all the contents of the [GGG]14 and other 8 LR1 features, the sequence property of G-rich in 5′ss intronic regions is revealed. The 23 LR1 features in the 3′ss consist of [GGG]2, [CCT]3, [CTC]3, [CTT]3, [ TCC ] 3 , [TCC]3, [TTC]3 and [TTT]3. According to the
Modelling splice sites with locality-sensitive sequence features
89
identified positions (within the range [–16, –4] in the upstream region of the 3′ss) of these C-/T-major trinucleotides, they can be directly mapped to the well-known PPT splicing signals adjacent to the 3′ss. The main contents of the LR exon and LR intron in the 5′ss are 2 2 reversely complemented pairs of C-/G-major triplets: {CCC,GGG}, {CCC, GGG}, {CGC, GCG}, {CGG, GCC} and {GCG, CGC}, and such a triplet conservation might and LR intron of the characterise the protein-coding obligation of exons. While the LR exon 2 2 3′ss show completely different contents compared with the 5′ss ones, there are 15 different triplets in the 18 identified LR1 features; such a triplet diversity might be related to the non-coding property of introns. The LSF models are attributed with a comprehensive representation of sequence features that provides an immediate interpretation of the underlying biological mechanisms; therefore, LSFs are also a kind of interpretable statistical models (Huang and Pavlovic, 2008). Moreover, according to the information of overlapped positions of LSFs, longer motifs such as splice site consensus can be produced, an example of constructing extended 3′ss motifs is presented in Figure 5; thus, the LSFs can also fulfill the motif identification of unknown length (Leung and Chin, 2006). Some other noticeable details will be provided in the Discussion section. Table 2
The number of features in human-LSF models PO1
PO2
LR1
LR exon 2
LR intron 2
Total
5′ss
3
4
22
8
11
48
3′ss
1
2
23
9
9
44
Figure 5
Bottom-up assembly of 3′ss PO2 features. In this example, the 3′ splice site is located at position 70. The locality of identified PO2 features is specified from superscriptions to subscriptions; according to the overlapped positions, the PO2 features are merged together to produce a longer motifs. The final consensus are boxed with shadows (the vertical bars in the consensus stand for the location of 3′ splice site)
4.2.2 The performance of human-LSF models Owing to the far outnumbered false splice sites, the negative instances were randomly sampled from the corresponding F1 (in addition, F1 and F1 ∪ F2 in the following experiments) data sets with the same number of true instances. The performances of human-LSF models in splice site classification by using the FDA classifier are listed in Table 3; the values of sensitivity and specificity in each 5′ss and 3′ss classification experiment were very close to each other, which means the estimated accuracies came from an unbiased predictor.
90 Table 3
S-W. Liou and Y-F. Huang The performances of human-LSF models in splice site classification Accuracy
Sensitivity
Specificity
5′ss
0.90
0.93
0.87
3′ss
0.81
0.83
0.80
4.2.3 ROC analysis of human-LSF models The ROC analysis of human-LSF models in the 5′ss and 3′ss classification experiments is shown in Figure 6, where the area under the ROC curve (AUC) is also specified. Both the ROC curves of the 5′ss and 3′ss classification are close to the upper-left corner and the AUC values are all above 0.9. The high AUC values indicate the discriminant sequence features of splice sites are recruited in the LSF models. Figure 6
ROC analysis of human-LSF models: (a) 5′ss classification using human-LSF model and (b) 3′ss classification using human-LSF model (see online version for colours)
(a)
(b)
Modelling splice sites with locality-sensitive sequence features
91
4.2.4 Further exploration of six model organisms After obtaining the promising results from the HS3D data sets, the data sets of six model organisms provided by the Xpro database are then used to validate the proposed LSF models thoroughly. Firstly, the number of identified PO1, PO2, LR1 and LR2 features is summarised in Table 4 where the abbreviations of the data sets are as follows: H for Human, M for Mouse, R for Rat, C for C. elegans, A for Arabidopsis, and D for Drosophila. Table 4
The number of features in human-LSF models based on data sets of model organisms
Species
H
Splice site
M
R
C
A
D
5′ss
3′ss
5′ss
3′ss
5′ss
3′ss
5′ss
3′ss
5′ss
3′ss 5′ss
3′ss
PO1
2
1
3
1
3
1
1
3
3
2
2
3
PO2
5
2
5
2
4
3
6
5
3
3
8
3
LR1
10
16
13
18
15
15
6
13
21
5
8
9
LR exon 2
12
12
11
12
11
11
11
11
8
12
13
14
LR intron 2
8
9
11
9
11
8
8
8
0
7
8
8
Total
37
40
43
42
44
38
32
40
35
29
39
37
4.3 Applicability of LSF models 4.3.1 The performances of mammal-LSF models The three mammal data sets of Human, Mouse and Rat were selected to verify the general applicability of the proposed LSF models in splice site classification, and the measures of the performance for the 5′ss and 3′ss were listed in Tables 5 and 6. Each of the average accuracy, sensitivity and specificity is about 0.90 in the 5′ss classification and about 0.81 in the 3′ss classification under three case studies. The consistent and promising results (especially on identifying 5′ splice sites) indicate the LSF models are generally applicable to the close species. Table 5
Performances in the 5’ss classification T vs. F1
5′ss data sets
T vs. F2
T vs. {F1 ∪ F2}
Metric
Acc
Sn
Sp
Acc
Sn
Sp
Acc
Sn
Sp
1
0.89
0.89
0.89
0.89
0.92
0.87
0.89
0.91
0.87
Human
2
Mouse
0.93
0.95
0.91
0.91
0.93
0.88
0.91
0.93
0.89
3
Rat
0.89
0.91
0.88
0.89
0.90
0.88
0.88
0.90
0.87
4.3.2 ROC analysis of mammal-LSF models The ROC analysis of mammal-LSF models in the 5′ss and 3′ss classification experiments is shown in Figure 7 where the AUC1 is the AUC value of the ROC curve for the classification experiment using data set T and F1 (or AUC2 for T and F2, AUC2 for T and F1 ∪ F2}). Similar results with the human-LSF models were observed, which give our confidence to the applicability of LSF models in splice site classification.
92 Figure 7
S-W. Liou and Y-F. Huang ROC analysis of mammal-LSF splice site models: (a) Human 5′ss classification; (b) Human 3′ss classification; (c) Mouse 5′ss classification; (d) Mouse 3′ss classification; (e) Rat 5′ss classification and (f) Rat 3′ss classification(see online version for colours)
(a)
(b)
(c)
Modelling splice sites with locality-sensitive sequence features Figure 7
93
ROC analysis of mammal-LSF splice site models: (a) Human 5′ss classification; (b) Human 3′ss classification; (c) Mouse 5′ss classification; (d) Mouse 3′ss classification; (e) Rat 5′ss classification and (f) Rat 3′ss classification(see online version for colours) (continued)
(d)
(e)
(f)
94
S-W. Liou and Y-F. Huang Performances in the 3’ss classification
Table 6
T vs. F1
3′ss data sets
T vs. F2
T vs. {F1 ∪ F2}
Metric
Acc
Sn
Sp
Acc
Sn
Sp
Acc
Sn
Sp
1 Human
0.84
0.84
0.84
0.79
0.79
0.79
0.79
0.79
0.78
2 Mouse
0.82
0.82
0.82
0.81
0.82
0.81
0.81
0.81
0.81
3 Rat
0.78
0.78
0.78
0.79
0.80
0.78
0.78
0.79
0.77
4.4 Robustness of LSF models To clarify whether the above promising results are only obtained by using the data sets of close species, three different but also well-studied species were selected to test the robustness of LSF models; they are C. elegans (invertebrate), Arabidopsis (plant) and Drosophila (invertebrate). The performances in the 5′ss classification were listed in Table 7, and they are better than those in the mammal-LSF models. As the results of the 3′ss classification shown in Table 8, the performances were overall improved, especially in the case of C. elegan. Naturally, the ROC analysis and the AUC values of the three species also confirmed better performances as shown in Figure 8. Thus, the results of robustness test indicate the LSF models have a potential to be applied to other different species. Figure 8
ROC analysis of LSF models of diverse species: (a) C. elegans 5′ss classification; (b) C. elegans 3′ss classification; (c) Arabidopsis 5′ss classification; (d) Arabidopsis 3′ss classification; (e) Drosophila 5′ss classification and (f) Drosophila 3′ss classification (see online version for colours)
(a)
Modelling splice sites with locality-sensitive sequence features Figure 8
95
ROC analysis of LSF models of diverse species: (a) C. elegans 5′ss classification; (b) C. elegans 3′ss classification; (c) Arabidopsis 5′ss classification; (d) Arabidopsis 3′ss classification; (e) Drosophila 5′ss classification and (f) Drosophila 3′ss classification (see online version for colours) (continued)
(b)
(c)
(d)
96 Figure 8
S-W. Liou and Y-F. Huang ROC analysis of LSF models of diverse species: (a) C. elegans 5′ss classification; (b) C. elegans 3′ss classification; (c) Arabidopsis 5′ss classification; (d) Arabidopsis 3′ss classification; (e) Drosophila 5′ss classification and (f) Drosophila 3′ss classification (see online version for colours) (continued)
(e)
(f) Table 7
Performances in 5’ss classification T vs. F2
T vs. F1
5′ss data sets
T vs. {F1 ∪ F2}
Metric
Acc
Sn
Sp
Acc
Sn
Sp
Acc
Sn
Sp
C. elegans
0.92
0.91
0.92
0.91
0.91
0.92
0.91
0.91
0.92
Arabidopsis
0.86
0.86
0.87
0.85
0.83
0.86
0.84
0.83
0.84
Drosophila
0.94
0.94
0.94
0.94
0.94
0.95
0.94
0.93
0.95
Modelling splice sites with locality-sensitive sequence features Table 8
97
Performances in 3’ss classification T vs. F1
3′ss data sets
T vs. F2
T vs. {F1 ∪ F2}
Metric
Acc
Sn
Sp
Acc
Sn
Sp
Acc
Sn
Sp
C. elegans
0.92
0.91
0.93
0.87
0.87
0.87
0.87
0.87
0.87
Arabidopsis
0.86
0.89
0.83
0.81
0.79
0.83
0.81
0.81
0.81
Drosophila
0.85
0.84
0.86
0.81
0.81
0.82
0.81
0.81
0.81
5
Discussions
5.1 Insights into LSF models Transforming raw genomic sequences into knowledge-based data is crucial for improving the performances of splice site models (Mathe et al., 2002), which needs ensuring the elements in derived SSM biologically meaningful (Rauch and Kiss, 2003). Knowledge-driven feature selection is a way to identify biologically meaningful biomarkers (Chen et al., 2009). By using sequence logos (Schneider and Stephens, 1990), a deep insight into the LSF models is given as follows. The 5′ss and 3′ss consensus sequences are reconstructed with the PO1-LSFs as shown in Figure 9(a) and (b). It is clear both the derived 5′ss/3′ss consensus based on PO1-LSFs are consistent with the known splice site consensus in vivo. The 5′ss/3′ss PO2 patterns are position-specific trinucleotides; by applying the sequence logo again, the 5′ss and 3′ss consensus sequences are extended to 5′-aG|GTRAGt-3′ and 5′-tttYAG|Gr-3′, where the vertical bar is the splice site and the small capital letters mean that nucleotide sometimes appears at the specific position. Thus, based on the content of PO1 and PO2 patterns, not only the splice site consensus are recovered, but also they reveal more detailed and more specific sequence compositions defining the 5′ss and 3′ss. Figure 9
The splice site consensus derived from PO1-LSFs: (a) the 5′ss PO1 patterns in LSF model and (b) the 3′ss PO1 patterns in LSF model (see online version for colours)
(a)
98 Figure 9
S-W. Liou and Y-F. Huang The splice site consensus derived from PO1-LSFs: (a) the 5′ss PO1 patterns in LSF model and (b) the 3′ss PO1 patterns in LSF model (see online version for colours) (continued)
(b)
The 5′ss/3′ss LPi-LSFs are range-specific trinucleotides; similarly, the sequence logos of the LPi-LSFs are shown in Figure 10(a) and (b). It is clear the G-triplets are rich in the 5′ss intronic region and there exists a C/T-tract in the 3′ss intronic region. Thus, the imbalanced distribution of significant range-specific trinucleotides around the flanking regions of splice sites is revealed, which corresponds to the biological evidences supporting such an intron-preferred locality of trinucleotide repeats (Carlo et al., 1996; McCullough and Berget, 1997; Zhang, 1998; Louie et al., 2003; Zhang et al., 2005a, 2005b). Moreover, Figure 10 also reveals the biological facts that the abundant GpG dinucleotides exists in the intronic flank regions of the 5’ss (Karlin and Burge, 1995) and the contiguous Ts are preferred in the PPT region (Coolidge et al., 1997). Obviously, the PO1 and LRi features modelled in LSFs are consistent with some well-known biological findings. Figure 10 The LR1-LSF sequence patterns:(a) the 5′ss LR1-LSF sequence patterns and (b) the 3′ss LR1-LSF sequence patterns (see online version for colours)
(a)
Modelling splice sites with locality-sensitive sequence features
99
Figure 10 The LR1-LSF sequence patterns:(a) the 5′ss LR1-LSF sequence patterns and (b) the 3′ss LR1-LSF sequence patterns (see online version for colours) (continued)
(b)
and LR intron is observed: the The complement property between the 5′ss/3′ss LR exon 2 2 exon feature set of 5′ss LR 4 is {TTT, ATT, TAT, TTA, CCC, GCC, CGC, CGG, GCG} set: {AAA, TAA, ATA, A AT, GGG, CGG, GCG, that complements the 5′ss LR intron 2 feature set {TTT, ATT, TAT, TTA, CCC} also GCC, CGC}; similarly, the 3′ss LR exon 2 set {AAA, TAA, ATA, A AT, GGG}. This finding complements the 3′ss LR intron 2 corresponds to the complementary triplets in coding and non-coding sequences (Nikolaou and Almirantis, 2003; Lian and Garner, 2005). Furthermore, the fact that the identical-nucleotide trinucleotides (i.e., AAA, CCC, GGG and TTT) are more frequent than other ones also implies the feature-desert regions are less sensitive to the frameshift mutations. By observing the sequence logos of PFMs of the six model organisms (data not shown), the 5′ss consensus in higher eukaryotes (Human, Mouse, Rat) is more conservative than lower eukaryotes (C. elegans, Drosophila, Arabidopsis); yet, the conservative regions in 5′ss of the three lower eukaryotes are longer than the three higher eukaryotes to some extent. As for 3′ss, the conservative regions (i.e., the PPT) of the three lower eukaryotes are obviously stronger and longer than three higher eukaryotes. The length and strength of sequence conservation can explain why the performances of 3′ss classification are somewhat better than 5′ss classification in all the six model organisms; in addition, which can also explains the better performances in 3′ss classification of lower eukaryotes.
5.2 Model comparison There usually exist some result-sensitive parameters defined in the related methods (e.g., the window size for analysis or specific ranges of functional regions for collecting some statistics about sequence compositions), which would influence the performance of the methods to some extent. On the contrast, the proposed LSF-mining method appeals for parameter-free methodologies (both the LSF-mining and the adopted FDA classifier are parameter-free methods) to simply show applicability and robustness of the constructed LSF splice site models. Besides, using only one or two data sets for performance evaluation is common as shown in Table 9 (for the details of those
S-W. Liou and Y-F. Huang
100
compared methods, please see, IDQD (Zhang and Luo, 2003), GeneSplicer (Pertea et al., 2001), SpliceMachine (Degroeve et al., 2005), SplicePort (Dogan et al., 2007), PI (Solovyev et al., 1994), BTN (Cai et al., 2000), EDA (Saeys et al., 2003) and UMDA (Saeys et al., 2004)); thus, the performances of most of the related methods are probably either species-dependent (data set dependent) or species-sensitive (data set sensitive). It’s not clear whether the existing methods could obtain consistent performances or not without modifying any of the method-related parameters when they are applied to data sets (of different species) different from the one(s) presented in the literatures. Table 9 Method
Data set(s) tested in the related methods LSF-FDA
IDQD
GeneSplicer
SpliceMachine
SplicePort 2
#Data set
7
4
2
2
Methods
PI
BTN
EDA
UMDA
#Data set
1
1
1
1
6
Conclusions
In this paper, a new paradigm of SSM based on LSFs is proposed. The LSF-derived models are substantially and specifically attributed with sequence features relevant to splicing events in vivo, which retain the intrinsic properties of splice site sequences and give valuable insights into the composition of splice site sequences. From the experimental results, the proposed LSF-based SSM methodology is shown versatile and robust in the splice site classification. It is prospective the LSF-based SSM can serve as a new infrastructure for the fast development of effective splice site prediction methods and have the potential to be applied to other sequence prediction problems.
References Brent, M.R. and Guigo, R. (2004) ‘Recent advances in gene structure prediction’, Curr. Opin. Struct. Biol., Vol. 14, No. 3, pp.264–272. Burge, C. and Karlin, S. (1997) ‘Prediction of complete gene structures in human genomic DNA’, J. Mol. Biol., Vol. 268, No. 1, pp.78–94. Cai, D., Delcher, A., Kao, B. and Kasif, S. (2000) ‘Modeling splice sites with Bayes networks’, Bioinformatics, Vol. 16, No. 2, pp.152–158. Carlo, T., Sterner, D.A. and Berget, S.M. (1996) ‘An intron splicing enhancer containing a g-rich repeat facilitates inclusion of a vertebrate micro-exon’, RNA, Vol. 2, No. 4, pp.342–353. Chasin, L.A. (2007) ‘Searching for splicing motifs’, Adv. Exp. Med. Biol., Vol. 623:85–106. Chen, L., Xuan, J., Wang, C., Wang, Y., Shih, I-M., Wang, T-L., Zhang, Z., Clarke, R. and Hoffman, E.P. (2009) ‘Biomarker identification by knowledge-driven multilevel ica and motif analysis’, Int. J. Data Min. Bioinform., Vol. 3, No. 4, pp.365–81. Claverie, J.M. and Bougueleret, L. (1986) ‘Heuristic informational analysis of sequences’, Nucleic Acids Res., Vol. 14, No. 1, pp.179–196. Claverie, J.M., Sauvaget, I. and Bougueleret, L. (1990) ‘K-tuple frequency analysis: from intron/exon discrimination to t-cell epitope mapping’, Methods Enzymol., Vol. 183, pp.237–252.
Modelling splice sites with locality-sensitive sequence features
101
Coolidge, C.J., Seely, R.J. and Patton, J.G. (1997) ‘Functional analysis of the polypyrimidine tract in pre-mRNA splicing’, Nucleic Acids Res., Vol. 25, No. 4, pp.888–896. Crick, F. (1979) ‘Split genes and RNA splicing’, Science, Vol. 204, No. 4390, pp.264–271, . Degroeve, S., De Baets, B., Van de Peer, Y. and Rouze, P. (2002) ‘Feature subset selection for splice site prediction’, Bioinformatics, Vol. 18, Suppl. 2, pp.S75–S83. Degroeve, S., Saeys, Y., De Baets, B., Rouze, P. and Van de Peer, Y. (2005) ‘Splicemachine: predicting splice sites from high-dimensional local context representations’, Bioinformatics, Vol. 21, No. 8, pp.1332–1338. Dewey, C.N., Rogozin, I.B. and Koonin, E.V. (2006) ‘Compensatory relationship between splice sites and exonic splicing signals depending on the length of vertebrate introns’, BMC Genomics, Vol. 7, p.311. Dixon, R.J., Eperon, I.C. and Samani, N.J. (2007) ‘Complementary intron sequence motifs associated with human exon repetition: a role for intragenic, inter-transcript interactions in gene expression’, Bioin-formatics, Vol. 23, No. 2, pp.150–155. Dogan, R.I., Getoor, L., Wilbur, W.J. and Mount, S.M. (2007) ‘SplicePort-an interactive splice-site analysis tool’, Nucleic Acids Res., Vol. 35, Web Server Issue, pp.W285–W291. Gopalan, V., Tan, T.W., Lee, B.T.K. and Ranganathan, S. (2004) ‘Xpro: database of eukaryotic protein-encoding genes’, Nucleic Acids Res., Vol. 32, No. Database Issue, pp.D59–D63. Hastings, M.L. and Krainer, A.R. (2001) ‘Pre-mRNA splicing in the new millennium’, Curr. Opin. Cell Biol., Vol. 13, No. 3, pp.302–309. Huang, P-H. and Pavlovic, V. (2008) ‘Protein homology detection with biologically inspired features and interpretable statistical models’, Int. J. Data. Min. Bioinform., Vol. 2, No. 2, pp.157–75. Jiang, R. and Yan, H. (2008) ‘Segmentation of short human exons based on spectral features of double curves’, Int. J. Data Min. Bioinform., Vol. 2, No. 1, pp.15–35. Karlin, S. and Burge, C. (1995) ‘Dinucleotide relative abundance extremes: a genomic signature’, Trends Genet., Vol. 11, No. 7, pp.283–290. Leung, H.C.M. and Chin, F.Y.L. (2006) ‘An efficient motif discovery algorithm with unknown motif length and number of binding sites’, Int. J. Data Min. Bioinform., Vol. 1, No. 2, pp.201–15. Lian, Y. and Garner, H.R. (2005) ‘Evidence for the regulation of alternative splicing via complementary DNA sequence repeats’, Bioinformatics, Vol. 21, No. 8, pp.1358–1364. Liou, S-W. and Huang, Y-F. (2008) ‘Mining intronic sequence features of splice sites with depth-breadth fused codon analyses’, BIOCOMP, pp.203–209. Liou, S-W., Wang, C-M. and Huang, Y-F. (2009) ‘Integrative discovery of multifaceted sequence patterns by frame-relayed search and hybrid pso-ann’, J. UCS, Vol. 15, No. 4, pp.742–764. Louie, E., Ott, J. and Majewski, J. (2003) ‘Nucleotide frequency variation across human genes’, Genome Res., Vol. 13, No. 12, pp.2594–2601. Mahalanobis, P.C. (1936) ‘On the generalised distance in statistics’, Proceedings of the National Institute of Sciences of India, Vol. 2, pp.49–55. Mathe, C., Sagot, M-F., Schiex, T. and Rouze, P. (2002) ‘Current methods of gene prediction, their strengths and weaknesses’, Nucleic Acids Res., Vol. 30, No. 19, pp.4103–4117. McCullough, A.J. and Berget, S.M. (1997) ‘G triplets located throughout a class of small vertebrate introns enforce intron borders and regulate splice site selection’, Mol. Cell Biol., Vol. 17, No. 8, pp.4562–4571. Mengeritsky, G. and Smith, T.F. (1989) ‘New analytical tool for analysis of splice site sequence determinants’, Comput. Appl. Biosci., Vol. 5, No. 2, pp.97–100. Nakata, K. Kanehisa, M. and DeLisi, C. (1985) ‘Prediction of splice junctions in mRNA sequences’, Nucleic Acids Res., Vol. 13, No. 14, pp.5327–5340.
102
S-W. Liou and Y-F. Huang
Nikolaou, C. and Almirantis, Y. (2003) ‘Mutually symmetric and complementary triplets: differences in their use distinguish systematically between coding and non-coding genomic sequences’, J. Theor. Biol., Vol. 223, No. 4, pp.477–487. Patel, A.A. and Steitz, J.A. (2003) ‘Splicing double: insights from the second spliceosome’, Nat. Rev. Mol. Cell Biol., Vol. 4, No. 12, pp.960–970. Pertea, M., Lin, X. and Salzberg, S.L. (2001) ‘Genesplicer: a new computational method for splice site prediction’, Nucleic Acids Res., Vol. 29, No. 5, pp.1185–1190. Pollastro, P. and Rampone, S. (2002) ‘HS3D, a dataset of homo sapiens splice regions, and its extraction procedure from a major public database’, Internat. J. Modern Phys. C, Vol. 13, No. 8, pp.1105–1117. Rauch, T. and Kiss, I. (2003) ‘How to find the real one (at the level of pre-mRNA splicing)’, Acta Biol. Hung, Vol. 54, Nos. 3–4, pp.219–231. Reed, R. (1989) ‘The organization of 3′ splice-site sequences in mammalian introns’, Genes Dev., Vol. 3, No. 12B, pp.2113–2123. Saeys, Y., Degroeve, S., Aeyels, D., Rouze, P. and Van de Peer, Y. (2004) ‘Feature selection for splice site prediction: a new method using EDA-based feature ranking’, BMC Bioinformatics, Vol. 5, p.64. Saeys, Y., Degroeve, S., Aeyels, D., Van De Peer, Y. and Rouze, P. (2003) ‘Fast feature selection using a simple estimation of distribution algorithm: a case study on splice site prediction’, Bioinformatics, Vol. 19, Suppl. 2, pp.ii179–ii188. Schellenberg, M.J., Ritchie, D.B. and Macmillan, A.M. (2008) ‘Pre-mRNA splicing: a complex picture in higher definition’, Trends Biochem. Sci., Vol. 33, No. 6, pp.243–246. Schneider, T.D. and Stephens, R.M. (1990) ‘Sequence logos: a new way to display consensus sequences’, Nucleic Acids Res., Vol. 18, No. 20, pp.6097–6100. Sharp, P.A. (1987) ‘Splicing of messenger RNA precursors’, Science, Vol. 235, No. 4790, pp.766–771. Solovyev, V.V., Salamov, A.A. and Lawrence, C.B. (1994) ‘Predicting internal exons by oligonucleotide composition and discriminant analysis of spliceable open reading frames’, Nucleic Acids Res., Vol. 22, No. 24, pp.5156–5163. Staden, R. (1984) ‘Computer methods to locate signals in nucleic acid sequences’, Nucleic Acids Res., Vol. 12, No. 1 Pt. 2, pp.505–519. Venables, J.P. (2007) ‘Downstream intronic splicing enhancers’, FEBS Lett., Vol. 581, No. 22, pp.4127–4131. Wang, J.T.L. and Wu, X. (2006) ‘Kernel design for rna classification using support vector machines’, Int. J. Data Min. Bioinform., Vol. 1, No. 1, pp.57–76. Wu, Y., Zhang, Y. and Zhang, J. (2005) ‘Distribution of ex-onic splicing enhancer elements in human genes’, Genomics, Vol. 86, No. 3, pp.329–336. Zhang, L. and Luo, L. (2003) ‘Splice site prediction with quadratic discriminant analysis using diversity measure’, Nucleic Acids Res., Vol. 31, No. 21, pp.6214–6220. Zhang, M.Q. (1998) ‘Statistical features of human exons and their flanking regions’, Hum. Mol. Genet., Vol. 7, No. 5, pp.919–932. Zhang, M.Q. and Marr, T.G. (1993) ‘A weight array method for splicing signal analysis’, Comput. Appl. Biosci., Vol. 9, No. 5, pp.499–509. Zhang, X.H-F., Leslie, C.S. and Chasin, L.A. (2005) ‘Computational searches for splicing signals’, Methods, Vol. 37, No. 4, pp.292–305. Zhang, X.H-F., Leslie, C.S. and Chasin, L.A. (2005) ‘Di-chotomous splicing signals in exon flanks’, Genome Res., Vol. 15, No. 6, pp.768–779. Zhuo, D., Madden, R., Elela, S.A. and Chabot, B. (2007) ‘Modern origin of numerous alternatively spliced human introns from tandem arrays’, Proc. Natl. Acad. Sci. USA, Vol. 104, No. 3, 16 January, pp.882–886.