We present cor- related Markov models for the corresponding sources, and using a flow- ... The techniques and results summarized below are ex- tensions of ...
IEEE JOURNAL ON SELECTED AREAS IN COMMUNICATIONS, VOL. 7, NO. 5, JUNE 1989
865
Models for Packet Switching of Variable-Bit-Rate Video Sources
Abstract-Packet switching of variable-bit-rate real-time video sources is a means for efficient sharing of communication resources while maintaining uniform picture quality. Performance analysis for the statistical multiplexing of such video sources is required as a first step towards assessing the feasibility of packet video. This paper extends our earlier work in modeling video sources which have been coded using interframe coding schemes and in carrying out buffer queueing analysis for the multiplexing of several such sources. Our previous models and analysis were suitable for relatively uniform activity scenes. Here, we consider models for scenes with multiple activity levels, which lead to sudden changes in the coder output bit rates. We present correlated Markov models for the corresponding sources, and using a flowequivalent queueing analysis, obtain common buffer queue distributions and probabilities of packet loss. Our results demonstrate the efficiency of packet video on a single link, due to the smoothing effect of multiplexing several variable-bit-rate video sources.
P
or delaying data beyond a certain threshold decreases. This probability is related to the fraction of packets that arrive at their destination in time to be played back; thus, it is a major performance index. We develop queueing models to assess this probability. The techniques and results summarized below are extensions of previous results reported in [l]. They were motivated by experimental data obtained at Bell Communications Research. In that earlier paper, we presented correlated Markov process models for video sources coded using conditional replenishment interframe coding. The models were applicable to video scenes with relatively uniform activity levels, such as scenes showing a talking person. In what follows, we extend these models to encompass simultaneous multiplexing of two kinds of scenes: slow varying and fast varying. Such models apply to talker-listener alternating scenes, as well as to situations where there is a mix of dissimilar services, e.g., television and videotelephony .
Manuscript received October 26, 1988. This work was supported in part by the New York State Science and Technology Foundation, through its Center for Advanced Technology in Telecommunications, Polytechnic University, Brooklyn, NY; in part by the New York State Center for Advanced Technology in Computers and Information Systems and the Center for Telecommunications Research, Columbia University, New York; and in part by the National Science Foundation under Grant PY1:ECS-84-51499. This work was presented in part at the SPIE Conference on Visual Communications and Image Processing, Cambridge, MA, Oct. 1987. P. Sen, B . Maglaris, and N.-E. Rikli are with Polytechnic University, Brooklyn, NY 11201. D. Anastassiou is with the Department of Electrical Engineering, Columbia University, New York, NY 10027. IEEE Log Number 8927597.
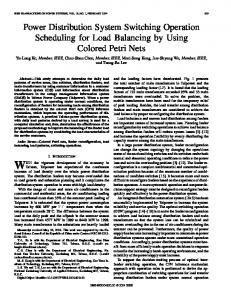
11. THE VIDEOSOURCE MODEL We consider digital video sources which are compressed using interframe variable-rate coding [2]. The coded bit stream from each source is stored in a separate prebuffer, which assembles the data into blocks (typically a frame’s worth of data) and packetizes the blocks. Prebuffering eliminates complicated properties in the nature of the source model [l], [3]. The packets from all the prebuffers join a common buffer in the multiplexer, where the packets are queued for transmission over a high-speed communication line. The schematic setup is shown in Fig. 1 [31. For the situation we consider, the data rates will be on the order of megabits per second, while the packet lengths will be less than a kilobit. Thus, it is possible to ignore the discrete packet nature of the data and treat them as a continuous bit stream or flow. As a result, we model the sources as producing continuous bit streams at quantized data-rate levels, with probabilistic transitions between the various rate levels. Correspondingly, we also model the statistical multiplexer queue as a fluid-flow pipe which takes in bits from the various prebuffers and serves them at a constant rate. The fluid-flow approximation is a pow-
I. INTRODUCTION ACKETIZED transmission in an asynchronous transfer mode (ATM) ISDN decouples the user input from the network by providing a unified transport mechanism for services of widely varying baud rates. In addition, it can perform statistical multiplexing by taking advantage of statistical variations in the traffic offered by users. In video communications, variable-bit-rate compression algorithms transmit at a higher rate during high-activity (motion) scenes and at a low rate when there is less motion. It is possible to multiplex statistically several independent video transmissions at a speed lower than the aggregate peak coding rate. The law of large numbers indicates that as the number of independent sources increases, the aggregate rate approaches the average, without adjustment of individual source rates by varying the picture quality. Equivalently, the probability of buffering
0733-8716/89/0600-0865$01.OO O 1989 IEEE
866
IEEE JOURNAL ON SELECTED AREAS IN COMMUNICATIONS. VOL. 7. NO. 5, J U N E 1989 PRE- B U f f E R
COMMON .
1
BUFFER
Ma
(M-l ) a
P
28
MB
Fig. 2 . State-transition-rate diagram for a single-activity-level source model.
0
Fig. 1. Schematic of a statistical multiplexer.
erful tool which allows the use of analytic models, taking into account the source correlations in the queueing analysis. Our earlier model, presented in [l], models the aggregated outputs of all the coders as a correlated Markov process whose state-transition-rate diagram is shown in Fig. 2. The aggregated process can transit between N 1 data rate levels where level i corresponds to data rate iA. The number of quantization levels N was chosen arbitrarily, while the rate increment A and the transition rates a and 0 were chosen to match the mean, variance, and autocovariance function of the experimental data. The appropriateness of this Markov model stems from the data in [ l ] and from earlier work [3], [4], as well as from some more recent experiments [5]. These results indicate that an exponential correlation model for the data-rate process is a very good aproximation for videotelephone scenes with a uniform activity level, e.g., showing a person talking. For other types of video traffic, such as broadcast television, videoconferencing, and longer videotelephone sequences (showing persons talking and listening); experimental work indicates the following structure. If we consider an environment where the video sources feeding the network are a mix of these types, then two important correlations are evident: a relatively fast-decaying shortterm correlation corresponding to uniform activity levels, with a time constant on the order of a few hundred milliseconds, and a slow-decaying long-term correlation corresponding to sudden changes in the gross activity level of the scene (e.g., scene changes in broadcast TV or changes between listener and talker modes in a videotelephone conversation), with a time constant on the order of a few seconds [6]. Our earlier model [I] captured only the short-term correlation. In this paper, we extend our model to accommodate the above-mentioned correlation structure. Moreover, we allow the multiplexing of sfatistically diferent sources, with different means and variances for the bit rates. We approximate the correlation decays as exponential since we feel that this captures the essential features of the correlation and provides a model which lends itself to analysis. The time constants for the two decay rates are different, in general, and are matched to the data. Our extended model, which includes both short-term and long-term correlations, involves a correlated Markov
+
....
Fig. 3. State-transition-rate diagram for the aggregate source model.
process model with a state-transition-rate diagram as shown in Fig. 3. Our models represent the source as one which changes among different fixed-rate levels. The label in any state indicates the data rate out of the prebuffer corresponding to that state. The possible data-rate levels are built up from two basic levels: a high rate A,, and a low rate A,, via integer combinations up to a maximum of N, 1 low-rate levels and N2 1 high-rate levels. Note that this generalized model handles abrupt changes in the output rate, unlike the earlier one. In the special case of a videotelephone sequence, where a person alternates between talking and listening, the individual source model will reduce to the case of N2 = 1, as shown in Fig. 4. When several sources are multiplexed, the resultant aggregate bit rate can be modeled by the same sfructure as the individual source model. The sources need not be statistically identical: they may have different means and variances. We assume only that the autocovariance behavior of all of the sources can be approximated by the same two dominant time constants (a “fast” mode and a “slow” mode). To determine the rest of the parameters in the model, first- and second-order statistics are matched. The maximum rates can also be equated. As an example, consider a single videotelephone source, involving transition between talking and listening (the model of Fig. 4). In this case, the fraction of time spent in the high activity level and the average time spent in the high level are used to fix c and d . The ratio of the average data rate in the high activity level to that in the low activity level is defined as the mean ratio y. Matching and the secondthe mean ratio, the overall mean
+
+
(x),
867
SEN er al. : PACKET SWITCHING OF VARIABLE-BIT-RATE VIDEO SOURCES
... ...
... Fig. 4 . State-transition-rate diagram for a two-activity-level source model (b)
order statistics in a single activity level [the conditional autocovariance function C ( i - ) ] completely determines the values of all of the other parameters, a , 6 , A,, and Ah.The parameter N indicating the number of quantization levels in any activity level is the only free parameter to be chosen as desired. The equations to be used for the matching are
C ( 0 ) = Np( 1 - p ) A :
Fig. 5 . Miniprocess models.
and multiplexer queue size, at steady state, the following equation can be obtained
U
wherep = a + b
- ib
(3) -
X
=
NpA,
+ qAh
a
where q = c d'
+
+
(4)
The specific order to determine the parameters of the model is as follows. From the actual data, the fraction of time spent in the high activity level can be equated to q , and the average time spent in the high level can be equated to 1 / d . This fixes both c and d . Matching the conditional variance, the conditional autocovariance exponent, the mean ratio, and the overall mean, with the help of ( 1 ) (4), yields the values of the parameters a , b, A I , and A h . When M such sources are multiplexed, the overall process can then be represented by our general model (Fig. 3 ) , with the above parameters, and N2 = M , N I = M N , where N is a freely chosen parameter. 111. PERFORMANCE ANALYSIS
In this section, we describe the analysis of the multiplexer queue using the source model of the previous section, considering the queue to be of constant fluid flow. The process of Fig. 3 can be decomposed into a superposition of simpler sources. In fact, the process is just a superposition of independent ON-OFF miniprocesses, N I of the type shown in Fig. 5(a) and N2 of the type shown in Fig. 5(b). The aggregate source process state then corresponds to the pair ( i , j ), denoting the respective number of miniprocesses which are ON. Let p be the fixed output rate of the continuous state multiplexer queue and q ( t ) be the instantaneous queue size. The process of Fig. 3 feeds the multiplexer queue. By considering the Chapman-Kolmogorov forward equations for the joint probability distribution of source state
+ j d + ( N I - i)a + ( N 2 - j ) c X.'.I .
- I.L
Fi,j ( x )
(i + l ) b X.1.J . - p Fi+ I , j ( x )
+ (N2X.- .j -+ 1 ) . CL
'.I
Fi,j - I ( X I
where Fu ( x )
=
Prob (source is in state ( i , j ) , multiplexer queue size
and A,
=
iAI
+ jA,.
Ix
)
(6)
Equation ( 5 ) can be written as
DF
=
MF
(7)
in which D and M are appropriate matrices and F is the vector formed from the Fu . The solution of (7) is given by
F(x)
=
F(w)
+ c u,q5(z)ezx
where the z are eigenvalues of D - I M in the left half complex plane and 4(') are the corresponding eigenvectors
~Dq5'~ =' M4','.
(9)
Note that for the solution of (7) to be a probability distribution function, only the left half plane eigenvalues can appear. To obtain the complete queue distribution, we need to evaluate the eigenvalues and eigenvectors of D - I M , as well as the coefficients a?. We first determine the eigenvector for a given eigenvalue. Let i P c z ) (U , U ) denote the
IEEE JOURNAL ON SELECTED AREAS IN COMMUNICATIONS, VOL. I, NO. 5 , JUNE 1989
868
generating function of 4 (‘)
l p-o f i O b ( l M ) i=Ni j=N2
+ y u , U) =
c c
j=o
j = o q5j;L’U’Vj.
(10)
Using (lo), the following equation for the generating function can be obtained (we omit the dependence on z for notational clarity) -12 -
a+(uy
au
[ -b
+ (A,z + b - a ) u + U U 2 ]
-16-
-20 -
= +(U, U ) [ p~
We solve ( 1 1 ) by using a separation of variables. Thus, letting +.(U, U ) =
(12)
h(u) g(u),
- r I ) c ’ ( u-
h(u) =
(U
g(v) =
(U -
r3)c3(’ -
r2)cL r4)
(13)
c4
(14)
where
{ - ( A , z + b - U ) + [ ( A l z + b - a)’ + 4 a b p 2 }/ 2 a 2 r2 = { - ( A , z + b - a ) - [ ( A l z + b - U ) + 4 a b p 2 }/ 2 a r3 = { - ( & Z + d - C ) + [(Ahz + d - cf rl =
I
.
+ 4cd]1’2)/2c r4 = { - ( ~ , z + d - c ) - [ + 4Cdp2)/ 2 c
pz/2 -
r
I
squaring both sides of the resulting equation, we get the fourth-order equation
+ T 1 z 3 + T2z2 + T3z + T4 = 0
(15)
where the coefficients To, T I , T2, T3, and T4 are all functions of only the model parameters. We omit their explicit expressions. The eigenvalues are obtained by solving (15) for all possible combinations of cl and c3. Once the eigenvalues and the eigenvectors are obtained as above, the coefficients a, of (8) have to be evaluated in order to determine the complete queue distribution. To that end, we use the fact that the queue size is nonzero with probability one, if the instantaneous input rate is greater than the queue output rate, since we have a flow model for the queue. This gives rise to a set of linear equations if
X,
=
(iA,+ j A h ) > p .
(16)
The buffer overflow probability, or “survivor function,” for a given queue size x is
( ~ +~ d z- c)’
G ( x ) = Prob(queue size
>x)
=
1n,m
F,,(x). (17)
-
N I 4 - r1);
a(r1 c3 =
I
Fig. 6 . Variation of loss probability with buffer size for a utilization of 65 percent and a mean ratio of 1.5.
F,(O) = 0
and CI =
I
buffer size (msec)
Toz4
substituting in (1 1) we obtain
r
I
I
- ( N ~ u+ N ~ c + ) N ~ U U+ N ~ c v ] . (11)
PZ/2 +
-,M-S
-
~ - r3) 4 1
~
c(r3 -
c2 =
r2)
;
~4
= N2
- cl -
~ 3 .
r4)
The eigenvector generating function 9( U , v ) can be obtained from (12)-( 14), and the eigenvector components can be obtained by comparing this expression to the expansion of (10). Given an eigenvalue z , the complete procedure for finding the eigenvector is the following. Compute rl - r4 and clr c3 from the above, with r chosen to make both cI and c3 integers. Use (12)-(14) to obtain and (10) to obtain the eigenvector components. To obtain the eigenvalues, we proceed as follows. Solving for r in the expressions for cI and c3 above and
IV. RESULTS In this section, we present some results generated by our analysis. Our intent is to show the types of results which can be obtained, as well as to note general trends. We present results for the special case of a videotelephone conversation. Thus, each source is modeled as in Fig. 4 . The mean data rate per video source is taken to be 3.9 Mbits/s, the source-data-rate conditional variance is 3.015 Mbits2/s2, and the short-term correlation exponent is 3.9/s. For the long-term correlation parameters, we choose c = d. This is motivated by the videotelephone application we have in mind, where a scene alternates between a person talking and listening for approximately equal lengths of time on the average. The average time spent in any one state is taken to be 1.5 s. The queue
SEN er u l . : PACKET SWITCHING OF VARIABLE-BIT-RATE VIDEO SOURCES
logloProb(1oss)
[2] A . N. Netravali and B. G. Haskell, Digital Pictures: Representntion and Compression. New York: Plenum, 1989. [3] B. G . Haskell, “Buffer and channel sharing by several interframe picturephone coders,” Bell Svst. Tech. J . , vol. 51, no. I . pp. 261-289, Jan. 1972. [4]J . 0. Limb, “Buffering of data generated by the coding of moving images,” Bell Syst. Tech. J . , vol. 51, no. 1 , pp. 239-255, Jan. 1972. [SI W. Verbiest, “Video coding in ATD environment,” in Proc. Third Int. Conf. New Syst. Services Telecommun., Liege, Belgium, Nov. 1986. “The impact of ATM concept on video coding,” I E € € J . Select. [6] -, Areas Commun.. vol. 6 , pp. 1623-1632, Dec. 1988.
0,
t ,
I
200
300
-zot 0
loo
,
,
400 500 buffer size (msec)
Fig. 7 . Variation of loss probability with buffer size for a utilization of 6 5 percent and a mean ratio of 2.5.
log,, Prob(1oss)
::I,
I
I
-20 0
loo
869
zoo
300
400 500 buffer size (msec)
Fig. 8. Variation of loss probability with buffer size for a utilization of 75 percent and a mean ratio of I .5.
output rate is adjusted according to the chosen utilization. The mean ratio is also varied. In Figs. 6-8, we show the survivor function for the queue size in the multiplexer queue for various combinations of utilization values and mean ratio. The ordinate G ( x ) thus shows the probability of data loss if the buffer size exceeds x. The buffer size is specified in time units, representing the time required to empty a full buffer at the output rate. We choose combinations of low and high utilizations and low and high mean ratio. Each graph shows the loss probability for multiplexing one to five video sources, demonstrating the dramatic reduction in loss probability as the number of multiplexed sources increases. In order to achieve the same loss probability with higher utilization (compare Figs. 6 and 8) or higher mean ratio (compare Figs. 6 and 7), a larger number of sources have to be multiplexed.
Prodip Sen (S’75-M’81) was born in Amritsar. India, in 1951. He received the B.Tech. degree in electrical engineering from The Indian Institute of Technology, Bombay, India, in 1973 and the Ph.D. degree in electrical engineering from the Indian Institute of Science, Bangalore, India, in December 1977. He was a Research Fellow and Visiting Assistant Professor in the Department of System Science in the School of Engineering at the Universitv of California. Los Angeles. from 1978 to 1980. From 1980 to 1983 he was a Research Mathematician at Polysystems Analysis Corp., Huntington, NY. Since 1983 he has been with Polytechnic University, Brooklyn, NY. where he is currently an Associate Professor of Electrical Engineering. His research interests are in the areas of integrated networks, local and metropolitan area networks, and network management.
Basil Maglaris (S’74-M’79) was born in Athens, Greece, i n 1952 He received the undergraduate Diploma degree in electrical engineering from the National Technical University of Athens in 1974, the M Sc. degree from the Polytechnic Institute of Brooklyn, Brooklyn, NY, i n 1975, and the Ph D degree in electrical engineering and computer science from Columbia University, New York, i n 1979 From 1979 to 1981 he was with the Network Analysis Corporation. Great Neck. NY, where he was involved in several projects in data and voice networks for both government and industry In 1981 he joined the Polytechnic Institute of New York. Brooklyn, where he is currently an Associate Professor of Electrical Engineering and Computer Science His research interests focus on the analysis, performance evaludtion. and optimization of data, voice and i n tegrated networks, packet radio, and local area networks. Dr Maglaris ha\ been involved in varioub professional activities with the IEEE and the ACM
Nasser-Eddine Rikli received the Diplome d‘lngenieur d’Etat degree (with honors) in “genie electrique” from the Institut National d’Electricite et d’Electronic, Boumerdes. Algeria. in 1984 and the M.S. and Ph.D. degrees in electrical engineering from Polytechnic University, Brooklyn, NY, in 1985 and 1988, respectively. His main interests are in the modeling and analysis of integrated communication networks involving voice. data, and video and mobile communication with application to cellular radio.
REFERENCES [ I ] B. Maglaris, D. Anastassiou, P. Sen, G. Karlsson, and J . Robbins, “Performance models of statistical multiplexing in packet video communications,” I€€€ Trans. Commun., vol. 36, pp. 834-844, July 1988.
Dimitris Anastassiou (S’77-M’78), for a photograph and biography, see this issue, p. 63 I .