PASJ: Publ. Astron. Soc. Japan , 1–??, c 2008. Astronomical Society of Japan.
MOIRCS Deep Survey. II. Clustering Properties of K-band Selected Galaxies in GOODS-North Region Takashi Ichikawa,1 Ryuji Suzuki,2 Chihiro Tokoku,2 Yuka Katsuno-Uchimoto,3 Masahiro Konishi,1,2 Tomohiro Yoshikawa,1,2 Masaru Kajisawa,5 Masami Ouchi,4 Takashi Hamana,5 Masayuki Akiyama,2 Tetsuo Nishimura,2 Koji Omata,2 Ichi Tanaka,2 and Toru Yamada2 1
arXiv:astro-ph/0701820v1 29 Jan 2007
Astronomical Institute, Tohoku University, Aramaki, Aoba, Sendai 980-8578
[email protected] 2 Subaru Telescope, National Astronomical Observatory of Japan, 650 North A’ohoku Place, Hilo, HI 96720, USA 3 Institute of Astronomy, University of Tokyo, Mitaka, Tokyo 181-0015 4 Space Telescope Science Institute, 3700 San Martin Drive, Baltimore, MD 21218, USA 5 National Astronomical Observatory of Japan, Mitaka, Tokyo 181–8588 (Received ; accepted )
Abstract We present the first measurement of clustering properties of low mass galaxies with a stellar mass down to M∗ ∼ 109 M⊙ at 1 < z < 4 in 24.4 arcmin2 of the GOODS-North region with a depth of KAB ∼ 25, based on the near infrared observations performed with MOIRCS at the Subaru Telescope. The correlation amplitude strongly depends on the K-band flux, color, and stellar mass of the galaxies. We find that K-band luminous galaxies have a larger correlation length than K-band faint galaxies. For color selected samples at 2 < z < 4, distant red galaxies with J − K > 1.3 show a large bias of b ∼ 7.2 ± 1.3 on scales up to θ ∼ 100′′ or 3.1 comoving Mpc, while blue galaxies with 0.5 < J − K < 1.3, in which most Lyman break galaxies are populated, have a weak clustering signal on large scales, but a possible strong small scale 10 excess at θ < 10′′ . For massive galaxies with M∗ > ∼ 10 M⊙ , we estimate a correlation length and bias to be r0 ∼ 4.5 h−1 Mpc and b = 1.9 − 3.5, which are much larger than those of low mass (M∗ ∼ 109 –1010 M⊙ ) galaxies. The comparison of our measurements with analytic CDM models constrains the properties of hosting dark halos, and indicates that the low mass galaxies would be progenitors of galaxies with a typical luminosity of L < ∼ L∗ in the local Universe. The blue galaxies in low mass samples are more strongly clustered in more massive halos with higher occupation numbers than low mass red galaxies. This fact suggests an environment effect due to the halo mass on star formation activity at high-z. Key words: cosmology: observations — galaxies: evolution — galaxies: high-redshift — infrared: galaxies — cosmology: large-scale structure of universe 1.
Introduction
The spatial correlation of galaxy distributions with that of the underlying dark matter is one of fundamental information to understand galaxy evolution. Under a fixed cosmological framework of cold dark matter models, the comparison of observed clustering properties of galaxies to the theoretical predictions allows us to obtain, in a statistical manner, typical masses of the dark matter halos hosting galaxies even at the high-z Universe (e.g., Moustakas & Somerville 2002; Ouchi et al. 2004; Hamana et al. 2006). Therefore the evolution of galaxy clustering strength and stellar mass assembly in galaxies as a function of redshift will give us clues to the assembly history of not only the stellar mass but also dark halos. Thus, it allows us to study ancestor-descendant connections of galaxies at different redshifts. Previous studies of galaxy evolution at high-z have
been limited mainly to massive galaxies with stellar mass M∗ > 1010 M⊙ . According to hierarchical clustering models, low mass galaxies played an important role in the high-z Universe as building blocks, merging into massive galaxies. Therefore the comparison of the clustering properties of massive and lower mass galaxies will give us a more general view of galaxy evolution in dark matter. In this context, we have performed deep near-infrared (NIR) imaging observations (Kajisawa et al. 2006) to measure the properties of high-z galaxies based on a K-selected catalog, focusing on low luminous (or low mass) galaxies in comparison with massive galaxies. Clustering properties are well studied at z < ∼ 1 in optical band with spectroscopic redshift data (e.g., Zehavi et al. 2002, 2005; Norberg et al. 2002; Coil et al. 2004; Meneux et al. 2006; Li et al. 2006). For higher redshift, where spectroscopic redshift data are limited to bright galaxies, multicolor selection techniques have efficiently revealed an
2
Ichikawa et al.
abundant population of galaxies. Optically selected UV luminous Lyman break galaxies (LBGs) (Steidel et al. 1996) and NIR selected galaxies, such like distant red galaxies (DRGs) (Franx et al. 2003) are among the galaxies selected by such color selection techniques for high-z galaxies. It is important to notice that the clustering properties of galaxy samples would be sensitive to the selection criteria. LBGs are generally biased to UV luminous active star-forming galaxies, and may give biased samples in terms of stellar mass (van Dokkum et al. 2006). On the other hand, galaxy catalogs compiled with NIR data allow us to construct a mass-selected sample because NIR emission is less affected by dust extinction and closely traces total stellar mass. Thus a NIR selection may give a suitable sample to study the clustering properties of galaxies based on the stellar mass. Nonetheless, the previous studies at high-z on the basis of NIR observations have been limited in deep (K < ∼ 26), but small field of view (4.5 arcmin2 ) (Labb´e et al. 2003) or in shallow (K < ∼ 23.5) and wide fields (> 30 arcmin2 ) (e.g., Glazebrook et al. 2004; Quadri et al. 2007; Foucaud et al. 2007; Grazian et al. 2006b). To examine the clustering properties of galaxies at 1 < z < 4, we will analyze in this study the medium 2 deep (K < ∼ 25) and wide-field (28 arcmin ) NIR data taken with MOIRCS on the Subaru Telescope (Kajisawa et al. 2006) and a publicly available data in the Great Observatory Origins Deep Survey North (GOODS-N) region (Giavalisco et al. 2004). Although the depth (K = 25.1 at the 90% completeness) is shallower than K = 25.7 of Daddi et al. (2003), the field of view is 5.5 times larger. The limiting magnitude, ∼1.5 mag deeper than that of e.g., Grazian et al. (2006b), will give us data statistically robust in number and with smaller field variance for the clustering properties for low luminous (or low mass) galaxies. Applying analytic models for the spatial clustering of dark matter to the observational results, we estimate the mass of dark matter halos hosting massive and low mass galaxies from the bias of galaxy-dark matter distribution (Bullock et al. 2002; Moustakas, Somerville 2002; Allen et al. 2005). The present paper is organized as follows. In §2, we present a brief account of the observations and data reduction. The photometric redshift and stellar mass of observed galaxies are obtained. We describe in §3 the angular clustering estimates, and the dependence on color, flux, and mass of galaxies at z = 1–4. Summarizing the result in comparison with previous studies, we estimate in §4 the galaxy-dark matter biases to investigate the properties of dark halos hosting high-z galaxies and the relation between galaxies and dark halos. In §5, we discuss our results and relevant literature in conjunction with galaxy evolution scenarios and possible candidates of the descendant in the local Universe. Throughout this paper, we assume Ωm = 0.3, ΩΛ = 0.7, and H0 = 70 km s−1 Mpc−1 . To facilitate the comparison to previous studies, the results of the correlation length (r0 ) are expressed using h = 1 (H0 = 100 km s−1 Mpc−1 ). We use the AB magnitude system (Oke, Gunn
[Vol. ,
1983; Fukugita et al. 1996), unless otherwise stated. For comparison with previous observations in literature, we convert K in Vega system using KAB = KVega + 1.82. 2. 2.1.
Data Observations and Data Analysis
We performed MOIRCS Deep Survey (MODS), J, H, Ks -band imaging observations in GOODS-N region with the Multi-Object InfraRed Camera and Spectrograph (MOIRCS; Ichikawa et al. 2006) on the Subaru Telescope in April and May, 2006. MOIRCS has a field of view of 4× 7 arcmin2 with 0′′.117 pixel scale. We observed one field of view of MOIRCS centered at 12h 36m 46.s 62, +62◦ 13′ 15.′′ 6 (J2000), which includes the Hubble Deep Field North (HDF-N, Williams et al. 1996) at the center. The sky was clear and stable during the observations under good seeing condition. We choose in this study highest-quality data sets which include only the frames with seeing size smaller than 0′′.5 (FWHM). The data were reduced in a standard manner using the IRAF software package. The details of the data processing and the data quality will be described at length in Konishi et al. (in preparation). FS23 and FS27 in the UKIRT faint standard stars were used for the flux calibration. The FWHMs of the point spread function (PSF) for the combined images are 0′′.42, 0′′.41, and 0′′.40 in J, H, Ks bands, respectively. The total exposure times of the final images are 5.0 (J), 1.8 (H), and 7.7 (Ks ) hours. The source detection is performed on the Ks -band image using the SExtractor image analysis package (Bertin, Arnouts 1996). We use MAG AUTO of the SExtractor as the total K magnitudes of the detected objects. In total, we have detected 2564 objects down to K ∼ 26.3. The 5σ limiting magnitudes in 0′′.85 aperture are J = 25.7, H = 24.2, and K = 25.3. The photometric errors and the completeness of the detection in Ks band are obtained by Monte Carlo simulations with mock images produced by the IRAF/ARTDATA package. We mingle many simulated galaxies in our image and then search them using the same photometric method used to detect actual galaxies. We find the 90% completeness at K = 25.1. We also test sensitivity to false detections by running SExtractor on the inverted Ks -band image. Only 15 spurious objects are extracted at K < ∼ 25, which is reasonably negligible for the present study. The field of view of MOIRCS is divided into two 4′ ×3′.5 fields and focuses on two separate focal plane arrays (Ichikawa et al. 2006). Excluding the edge area of each frame, where the S/N is lower than the center due to dithering or pixel defect, we obtain the images with the K ∼ 25.0 limiting magnitude uniform over the field of 24.4 arcmin2 , which is smaller than the original observation area (28 arcmin2 ). The final catalog used for the present study contains 1959 galaxies to the 90%completeness limit K = 25. Our survey area is covered by deep ACS images with the F435W, F606W, F775W, and F850LP bands of HST
No. ]
Clustering of Galaxies in MOIRCS Deep Survey Region
3
Fig. 3. Stellar mass distributions for the galaxies with K ≤ 25.0. DRGs (J − K ≥ 1.3), the galaxies with 0.5 ≤ J − K < 1.3 and J − K < 0.5 are depicted with filled circles, open circles, and crosses, respectively. The typical error for each z bin is shown by a thin line. Fig. 1. Upper panel: the spectroscopic (zsp ) vs. photometric (zphoto ) redshifts for 527 galaxies in the present region. Lower panel: relative scatter (zphoto − zsp )/(1 + zsp ) as a function of zsp . The inset histogram shows the distribution of the photometric redshift error. The error distribution is approximated by a Gaussian centered at 0.004 with an rms of 0.06 (solid line).
in the GOODS-N region (Giavalisco et al. 2004). (For convenience, we designate them as B, V , i, and z when referring to the filters, respectively.) A deep U -band image taken with KPNO 4m telescope is available in Capak et al. (2004), though the PSF is much larger than those of ACS and MOIRCS. Using our MOIRCS data and the public dataset, we have produced a high-quality multicolor catalog of galaxies in the MODS region. The ACS images and our Ks and H images are convolved with a Gaussian kernel to match the PSF to 0′′.42 of J band, which has the largest PSF in the present image set, except U band. For the color measurements, we use 0′′.85 aperture (2×FWHM). For the U -band image with FWMH=1′′.3, we measure the flux in 2′′.8 aperture. The aperture correction is made using the difference of the photometric measurements with apertures 0′′.85 and 2′′.8 on the B-band image after convolved with a Gaussian kernel to match the PSF to 0′′.42 (J) and 1′′.3 (U ), respectively. 2.2.
Fig. 2. Redshift distributions for 1959 galaxies with K ≤ 25.0. The spectroscopic samples for 527 galaxies are depicted by the filled histogram.
Photometric Redshift and Stellar Mass
We compile spectroscopic redshifts for 527 galaxies in the present region from the literature (Wirth et al. 2004; Cowie et al. 2004; Barger et al. 2003; Cohen et al. 2000; Cohen 2001; Treu et al. 2005; Erb et al. 2004; Steidel et al. 2003; Dawson et al. 2001; Reddy et al. 2006), excluding several unreliable identifications. (Note that the spectroscopic redshifts are available for only 7 DRGs among 115 DRGs in the present region.) For all the detected objects, we estimate their redshifts photometrically with the photometric data of U BV izJHK by fitting the observed flux with model SEDs, following the method described in Kajisawa, Yamada (2005). We use the model SEDs of Bruzual, Charlot synthetic library (GALAXEV; Bruzual, Charlot 2003), the Calzetti extinction law (Calzetti et al. 2000), and H I absorption (Madau 1995). Free parameters used in the fitting are redshift, spectral type, age, and extinction. We assume a star formation rate (SFR) that
4
Ichikawa et al.
[Vol. ,
ies in §3. Figure 2 shows the redshift distribution of the present K-band selected galaxies. We hereafter use the spectroscopic redshifts whenever available. GALAXEV gives the stellar mass-to-light ratio (M∗ /L) and rest frame colors for each template, so that we can obtain the total stellar mass (M∗ ) of the galaxies using the total absolute magnitude in rest frame V band, corrected for dust extinction. Note that our stellar mass estimate with the Chabrier (2003) IMF is systematically about 1.8 times smaller than that with the Salpeter IMF (Salpeter 1955). We plot the mass distributions as a function of redshift in Fig. 3, where the galaxies are divided into three groups with colors J − K ≥ 1.3, 0.5 ≤ J − K < 1.3, and J − K < 0.5. All of 52 LBGs of Steidel et al. (2003), which are located in the present region, are identified in our K-selected catalog. The colors of most LBGs are distributed in 0.5 < J − K < 1.3. Therefore, we divide the bluer galaxies into two groups by J − K = 0.5 for the following analysis. We see that most DRGs (J − K ≥ 1.3) are massive galaxies (3.6 × 10¹⁰ M⊙ on average) residing at 2 < z < 4. The sky distributions of the sample galaxies are represented in Fig. 4, where we see, as a visual impression, the difference of the distributions between different sampling criteria by the redshift, color, and stellar mass. In what follows, we examine the differences in a quantitative manner. 3.
Fig. 4. Sky distributions of the galaxies at (a) 1 < z < 2 and (b) 2 < z < 4. The galaxies with J − K ≥ 1.3, 0.5 ≤ J − K < 1.3 and J − K < 0.5 are depicted with filled circles, open circles, and crosses, respectively. The large and small symbols represent the galaxies with stellar mass M∗ > 1010 M⊙ and M∗ = 109−10 M⊙ , respectively.
decays exponentially with time, SFR ∝ e−t/τ , where τ is the time scale between 0.01 and 30 Gyr. The metallicity is changed from 0.005 to 2.5 solar values. The initial mass function (IMF) of Chabrier (2003) is adopted with upper and lower mass cutoffs of ml = 0.1M⊙ and mu = 100 M⊙ . We check the accuracy of our photometric redshift measurement using the objects with available spectroscopic redshifts. Figure 1 compares the spectroscopic and photometric redshifts. There are several outliers at zsp ∼ 0.5 and 2 < z < 4, for which difference is as large as |∆z| ∼ 2. The error distribution (the inset of the lower panel of Fig. 1) is nearly Gaussian and scatters around zero with an rms error of ∆z/(1 + zsp) ∼ 0.06. Excluding |∆z|/(1 + zsp) > ∼ 0.5, we obtain the rms error ∼ 0.12, which is comparable with the results 0.12, 0.09, and 0.05 of Quadri et al. (2007), Rudnick et al. (2003) and Grazian et al. (2006a). The outliers are possibly caused by the confusion of Lyman break and 4000˚ A/Balmer break in the photometric redshift technique. We will discuss the influence of the outliers to the evaluation of clustering properties of galax-
Angular Correlation Function
We quantitatively measure the clustering properties of galaxy distributions using the angular two-point correlation function (ACF) w(θ) (Peebles 1980). To examine the dependence on galaxy properties, we define a variety of different subsamples based on the redshift, flux, color, and stellar mass (see the following section for the definitions). We adopt the minimum variance Landy-Szalay estimator (Landy, Szalay 1993): w(θ) ≡
DD(θ) − 2DR(θ) + RR(θ) , RR(θ)
(1)
where DD(θ) is the observed number of galaxy pairs with separation θ, DR(θ) the number of pairs between the observed galaxies and random samples, and RR(θ) the number of pairs in the random catalog. In the calculation, we distribute the same number of random samples as of the observed sample in the same geometrical constraint of the observations. To reduce the noise in the random pair counts, we repeat the measurement until the random samples count over 100,000. We compute w(θ) in logarithmic bins of width ∆log(θ) = 0.4. The ACF errors are estimated by a bootstrap re-sampling technique (e.g., Ling et al. 1986). Note that our error estimate does not include field variance. The ACFs measured in a finite sky region are influenced by the, so called, integral constraint IC, which is expressed by Z 1 IC ≈ 2 dΩ1 dΩ2 wT (θ), (2) Ω
No. ]
Clustering of Galaxies in MOIRCS Deep Survey Region
5
Fig. 5. Upper panel: The ACFs, w(θ), of the K-band selected galaxies at (a) 1 < z < 2 and (b) 2 < z < 4. The filled circles show the observations with 1σ bootstrap error. The solid curve with dotted 1σ error range is the best-fit power law Aθ −β with fixed β = 0.8 for 1′′ –100′′ , corrected for integral constraint IC. The dash curve shows the ACF of dark p matter predicted by the nonlinear model of Peacock, Dodds (1996). Lower panel: Galaxy-dark matter bias b, defined as b(θ) = w(θ)/wDM . The thin line with dotted lines of ±1σ error indicates the average bias and the dispersion in the bins with 8′′ < θ < 100′′ .
where wT (θ) is the true ACF and Ω is the solid angle of the field (Groth, Peebles 1997). We assume a power-law ACF of the form, w(θ) = Aθ−β , and determine its amplitude, A, by fitting the function, w(θ) = Aθ−β − IC,
(3)
to the observations. Our measurement, however, cannot significantly constrain the slope of the correlation function because of the relatively small number of pairs and small angular range. Therefore, we take a fixed slope of β = 0.8. The amplitude A is computed by fitting the ACF over the range 1 − 100′′ because the finite size effect is serious for larger separation and our aperture photometry size 0′′.85 would hardly separate close pairs in θ < 1′′ , if any. We estimate the integral constraint numerically as P RR(θ)Aθ−β P IC = , (4) RR(θ)
following Roche et al. (2002). Since ACF quantifies the clustering properties of galaxies projected on the sky, it reflects the combination of the redshift distribution of selected galaxies and the clustering in three-dimensional space. The spatial correlation is usually expressed by a power law as ξ = (r/r0 )−γ ,
(5)
where r is the spatial separation between objects, r0 the correlation length, and γ the slope of power law. The slope β of ACF is related to γ with γ = β + 1. We use the Limber equation (Limber 1953) to infer r0 from w(θ) in comoving units: R∞ 2 1−γ dz θ1−γ I(γ) 0 ( dN dz ) [r(z)] dr dz , (6) w(θ) = 2 Nobj
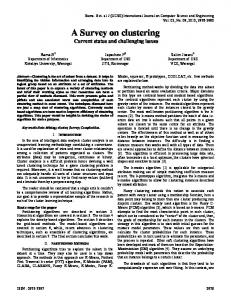
Fig. 6. The dependence of the clustering length on K magnitude at 1 < z < 2 (left) and 2 < z < 4 (right). Open circles represent the results of the present study. Square and triangle show the results of Daddi et al. (2003) (FIRES) and Quadri et al. (2007) (Q07), respectively.
I(γ) ≡
√ Γ( γ−1 2 ) π , Γ( γ2 )
p H0 ΩM (1 + z)3 + ΩΛ dz = , dr Z c z c dz p , r(z) = H0 0 ΩM (1 + z)3 + ΩΛ
(7) (8) (9)
where Nobj is the number of galaxies in a sample and dN/dz is the redshift selection function of sampled galaxies. For dN/dz, we use the actual redshift distribution of each subsample. Since the scatter in the photometric redshifts is very small as shown in the previous section, the error in the photometric redshifts does not have a significant influence on our results. The outliers of the photometric redshift act
6
Ichikawa et al.
Fig. 8. The results of the correlation length, r0 , for red galaxies based on K-selected samples at z > 1. The filled circle represents our result for DRGs (J − K ≥ 1.3) at 2 < z < 4. The other symbols show the previous studies, as labeled in the legend: Quadri et al. (2007) (Q07), Foucaud et al. (2007) (F07), and Grazian et al. (2006b) (G06) for DRGs, Daddi et al. (2003) for J − K > 0.7 galaxies (FIRES), and Daddi et al. (2002) for ERO.
as contaminants. If the contaminants have a uniform distribution, the measured amplitude A should be multiplied by 1/(1 − fc )2 , where fc is the fraction of the contaminants. As shown in the previous section, the outliers at z < 1 could be counted at the redshift range 1 < z < 4 due to the photo-z error. The numbers of the interlopers observed at 1 < z < 2 and 2 < z < 4, which are actually located at z < 1, are ∼1% and ∼3% of all galaxies, respectively (Fig. 1). Among the 877 galaxies at z < 1, 358 have reliable spectroscopic redshift. Therefore, out of the other 498 galaxies, ∼5 and ∼15 galaxies are potential interlopers which could be counted in the redshift range of 1 < z < 2 and 2 < z < 4, respectively. They are 1% and 3% of the samples. Therefore, the photo-z error decreases the amplitude by ∼6% at most. It corresponds to an error of ∼ 4% on r0 , which is much smaller than the fitting error of r0 . We also estimate the bias parameter b, which is defined as the ratio of the clustering amplitudes of galaxies to that of dark matter, s w(θ) b(θ) ≡ , (10) wDM where w(θ) and wDM are the observed ACF corrected for IC and that of dark matter computed by the Limber’s projection with the nonlinear model of Peacock, Dodds (1996). We calculate wDM using the same observational selection function of each subsample. Note that w(θ) of Eq. 1 can be negative due to a p statistical error. In such cases we artificially set b(θ) ≡ − |w(θ)|/wDM . 4.
Results from Clustering Measurements
We present results of clustering measurements for subsamples in the present K-selected galaxy catalog with K ≤ 25. We define subsamples by (1) K flux, (2) J − K
[Vol. ,
color, (3) stellar mass M∗ and (4) rest frame U − V color. Also, in the ACF analysis, we divide the catalog into two redshift bins of 1 < z < 2 and 2 < z < 4 to investigate the redshift evolution of the galaxy clustering. The redshift intervals are chosen so that each sample has roughly the same number of galaxies (∼ 500) and similar time intervals (∼ 2Gyr). In Fig. 5, the observed w(θ) and the best fit power-law model with a fixed slope of β = 0.8 and galaxy-dark matter bias b are depicted. It is found from the figure that the clustering bias of the present sample increases with z. In the higher redshift sample, the bias excess at the small scales (θ < 8′′ ) is distinctly observed. In the galaxy catalog with flux limit, various populations of galaxies are likely to be mingled. Populations uniformly distributed in space would smear out actual strong clustering of some populations, if any. To see what populations are contributed to the large bias or small scale excess, we disentangle the populations using different selection criteria. 4.1.
Clustering on K-band Flux Selection
We show the dependence of the clustering length on K magnitude in redshift bins of 1 < z < 2 and 2 < z < 4 in Fig. 6, where the ACF analysis is made with the limiting magnitudes of K = 23, 24, 25 for our sample. In this figure, we see that the clustering length increases with K-band luminosity in both redshift bins; more luminous galaxies tend to be more strongly clustered. The result conflicts with the previous study by Daddi et al. (2003) based on the K ∼ 26 sample in 4.5 arcmin2 HDF-S field, in which they concluded that the clustering length declined only slightly from K ∼ 21 and remained as high as r0 ∼ 5 down to K ∼ 26. Fluctuations in the clustering amplitude due to field variance could affect their estimate derived in the small HDF-S field. Quadri et al. (2007) studied in 300 arcmin2 the angular correlation functions of K selected galaxies with 2 < z < 3.5 and K < 22.8. Their clustering measurement based on the shallow but wide-field data is statistically more robust than ours at the bright magnitude of K < ∼ 23. The −1 correlation length for their sample is r0 = 6.0+0.9 Mpc −1.1 h with γ = 1.8, which is in good agreement with our result −1 r0 = 4.8+2.4 Mpc with the same selection criteria (K < −4.8 h 23), even though our error is much larger due to the small area and small number (N = 54) of galaxies. The bias b = 4.1 ± 2.0 for our K < 23 sample is also consistent with that of Quadri et al. (2007) (b = 3.3 ± 0.5) within 1σ error. They found no dependence of the correlation lengths on K magnitudes, whereas our deeper observation have revealed the strong dependence on K flux at a fainter magnitude of K > 23. The result that at high-z the dependence of the correlation lengths on K flux is weak for bright galaxies (Quadri et al. 2007), whereas that for faint galaxies is strong (this study), suggests opposite tendency for the galaxies at the local Universe (e.g., Norberg et al. 2002; Li et al. 2006) or for LBGs at z ∼ 4 (Ouchi et al. 2005).
No. ]
Clustering of Galaxies in MOIRCS Deep Survey Region
7
Fig. 7. Same as Fig. 5, but for DRGs (J − K ≥ 1.3) and bluer galaxies at 2 < z < 4.
4.2.
Clustering of DRGs and Bluer Galaxies at 2 < z < 4
To study the color dependence of the clustering properties, we present the results of ACF analysis based on J − K color selection in Fig. 7. It is found from Figure 7 that the bias increase with the J − K color; the stronger clustering for the redder J − K color. The clustering lengths of DRGs are measured by the previous studies (Quadri et al. 2007, Foucaud et al. 2007, Grazian et al. 2006b). We compare their results with ours in Fig. 8. As shown in the figure, −1 our result (r0 = 9.2+2.1 Mpc for the sample with −2.8 h J − K ≥ 1.3 at 2 < z < 4) agrees with their results −1 within 1σ error (r0 = 12.0+0.9 Mpc, Quadri et al. −1.0 h +3.8 −1 2007; r0 = 11.1−2.3 h Mpc, Foucaud et al. 2007; r0 = −1 13.4+3.0 Mpc, Grazian et al. 2006b). We note, how−3.2 h ever, that a marginal tendency of a larger correlation length for a brighter sample is observed among the results. Daddi et al. (2003) found the color segregation of the clustering at 2 < z < 4, dividing the catalog into J −K > 1.7 and bluer galaxies so that the number of the galaxies become similar. (J − K = 1.7 in Vega corresponds to J − K = 0.74 in AB of MOIRCS photometric system.) Although their sample is 0.7 mag deeper than our data at the same 90% completeness level, our catalog is expected to well sample the galaxies with J − K > 0.74 at 2 < z < 4. In fact, the surface number density 11.0 ± 0.7 galaxies arcmin−2 in our catalog is very consistent with their sample (10.9 ± 1.6 arcmin−2 ). To check the consistency with the result of Daddi et al. (2003), we subsample the galaxies of our catalog by J − K = 0.74 and measure the correlation lengths. For the redder sample −1 (J − K > 0.74), we obtain r0 = 5.3+0.4 Mpc, which −0.4 h is much small than the value provided by Daddi et al. (2003) (8.3 ± 1.2 h−1 Mpc). For the bluer sample, we ob−1 tain r0 = 2.5+1.2 Mpc, which is slightly smaller than −2.4 h −1 that of Daddi et al. (3.5+1.7 Mpc), though the dif−3.0 h ference is within 1 σ error. The discrepancy may likely arise from the field-to-field variation as discussed in the
previous subsection. In addition to the J − K color segregation of the clustering, it is important to notice that the sample with 0.5 < J −K < 1.3, which include the most of LBGs, clearly shows the excess clustering at small scales (θ < 8′′ ), while the sample has a weaker clustering amplitude at 8′′ < θ < 100′′. −1 Interestingly, the correlation length (r0 = 4.1+1.3 Mpc) −1.9 h and bias (b = 2.6 ± 0.4) for 0.5 < J − K < 1.3 galaxies ∗ are consistent with those of LBGs for L > ∼ L at hzi = 3 +0.7 −1 (r0 = 5.0−0.7 h Mpc, b = 2.7 ± 0.4) (Giavalisco, Dickinson 2001; Ouchi et al. 2004). 4.3.
Clustering on Stellar Mass Selection
Next, we examine the stellar mass dependence on the galaxy clustering. We divide the sample into the two mass ranges of massive (M∗ > 1010 M⊙ ) and low mass (M∗ = 109−10 M⊙ ) populations. The result is presented in Fig. 9, which shows that massive galaxies are larger biases than the low mass galaxies at the same redshift ranges. We examine which populations mainly contribute to the massive galaxies. Some massive galaxies at 2 < z < 4 would be overlooked by the standard DRG selection technique as shown in Fig. 3 (see also Conselice et al. 2007 and van Dokkum et al. 2006). We count 124 galaxies with M∗ > 1010 M⊙ at 2 < z < 4. Among them, 54 galaxies are found to be DRGs with J − K ≥ 1.3. van Dokkum showed that the fraction of DRGs at 2 < z < 3 is 69% by number among the massive galaxies with M∗ > 1011 M⊙ , using the Salpeter IMF. At the same 2 < z < 3, we count 16 galaxies with M∗ > 6 × 10¹⁰ M⊙ which corresponds M∗ > 1011 M⊙ with the Salpeter IMF. Among them, 13 galaxies (81%) are DRGs; the fraction is consistent with the result of van Dokkum et al. (2006), if the field variance is taken into account. LBGs are another population of massive galaxies (e.g., Rigopoulou et al. 2006). In fact, van Dokkum et al. (2006) studied the population of LBGs with M∗ > 1011 M⊙ at 2 < z < 3. However, it is noted that the 52 LBGs of Steidel et al. (2003) in the present region have various stellar masses with the wide range of 7 × 10⁸ M⊙ ∼ 9 × 10¹⁰ M⊙ with no typical mass. Among
8
Ichikawa et al.
them, 12 LBGs have masses of M∗ > 1010 M⊙ . Counting DRGs and LBGs, we find that only 53% of massive galaxies are classified by the combination of the color selection techniques. In summary, massive galaxies, including the DRGs sample (J − K > 1.3) and a minor portion of LBGs in 2 < z < 4, contribute large bias at θ > 8′′ (or > 0.25 Mpc at z ∼3) with large correlation length. The redder massive galaxies are more strongly clustered as discussed below. 4.4.
Clustering on the rest frame U − V color
Finally, we examine the rest frame U − V color dependence on the galaxy clustering. We divide the sample into the two subsamples by the rest frame U − V = 0.7. Note the color U − V ∼ 0.7 in AB magnitude corresponds to the color of A0 type stars (U − V ∼ 0 in Vega). Therefore, U − V < 0.7 galaxies are likely to be in active star formation. Also, it should be noted that most of the massive galaxies (M∗ > 1010 M⊙ ) at 1 < z < 2 have color redder than U − V = 0.7. We summarize the results in Table 1. The first column is the redshift range, in which we examine the clustering properties for each subsample. The second column is selection criteria for subsampling. The number of the galaxies, N , for each subsample is shown in the third column. The average redshift hzi and stellar mass hM∗ i are calculated for each subsample in column 4 and 5, respectively. The sixth column is the best fit parameter A in Eq. 3 and the 1σ error with a constrained slope β = 0.8. Using the Limber equation (Eq. 7), we convert the parameter to comoving correlation length, r0 , in units of h−1 Mpc in the seventh column. The eighth column is the bias averaged in the bins, where we use the bins with 8′′ < θ < 100′′ to avoid a small scale excess. In last column, we compute the number density and the Poisson error in comoving scale using the 1/Vmax method, where Vmax is the volume corresponding to the total redshift range over which the galaxy would be detected at the K ∼ 25 flux limit. 4.5.
Hosting Dark Halos and Halo Occupation Number
Here we examine a characteristic mass of dark matter halos that hosting galaxies and the halo occupation number from the galaxy clustering and number density compared with a theoretical model in the CDM cosmology. In Fig. 10 we plot the bias parameter b to compare the clustering strength with a dark matter halo model against the number density of the galaxies. In the previous section, we obtained the correlation length r0 , fitting the power law ACF to the observations. The r0 value would be a reasonable quantity to compare the observations with dark matter models. However, it strongly depends on the assumed γ and, moreover, could be affected by the small scale excess in θ < 8′′ bins as shown in the previous section. For this reason, here we adopt the bias instead of the correlation length. In addition, for comparison, we depict the results of other studies based on K-selected catalogs (Daddi et al. 2003; Quadri et al. 2007) and those of optical samples (LBGs, Lee et al. 2006; DEEP2, Conroy et al.
[Vol. ,
2007). The model predictions for the number density and average bias of dark halos with mass larger than the minimum min MDH are shown by solid lines. The discrepancy in number density between the observed points and the model prediction indicates that the number densities of galaxies and dark halos are not exactly in one-to-one correspondence. We define the occupation number, Noc , as the ratio of the number density to that of the dark halos. Assuming that the bias of galaxies (b) reflects the bias of dark halo (bDH ) hosting the galaxies (i.e., b ≃ bDH ), we estimate the hosting halo mass MDH with the help of the analytic models given by Sheth, Tormen (1999) and Sheth, Mo, Tormen (2001) (e.g., see Ouchi et al. 2004 for the detail method), where b is obtained by averaging the observed biases in the bins with 8′′ < θ < 100′′ to avoid the small scale excess (see Table 1). For reference, we mark the MDH values, which correspond to the bias, at the right side of Fig. 10 We summarize in Table 2 the results of the minimum min halo mass MDH , the occupation number Noc , the halo mass MDH with the same bias as the galaxies (b ≃ bDH ), and the ratios of MDH to the average stellar mass hM∗ i. 4.6.
Redshift Evolution of Galaxy Biases
In order to explore an ancestor-to-descendant connection of different galaxy populations at various redshifts from the viewpoints of both stellar mass and dark matter assembly, we compare our results of the bias and those of literature with model predictions as a function of redshift in Fig. 11. If the bias values are not available in the literature, we calculate the bias bg by the following equation from the published r0 and γ, s [8h−1 Mpc/r0 ]−γ bg = , (11) ξDM (r = 8h−1 Mpc) where ξDM is the two-point correlation function of underlying dark matter. We calculate r0 of the dark matter using nonlinear CDM correlation function (Peacock, Dodds 1994). For comparison, we show the bias values of clusters of galaxies (Bahcall et al. 2003) and groups of galaxies (Padilla et al. 2004; Girardi et al. 2000) in the local Universe. The bias value of the local galaxies with typical luminosity Mr∗ ∼ −20.5 (Zehavi et al. 2005), which corresponds to M∗ ∼ 3.8 × 10¹⁰M⊙ using M∗ /L ∼3 (Kauffmann et al. 2003), is also shown with the bias range for galaxies with −23 < Mr < −17. If the motion of galaxies is purely caused by gravity and merging does not take place, the bias value of galaxies will decrease as the Universe evolves with time, according to bz = 1 + (b0 − 1)/D(z),
(12)
where D(z) is the growth factor and b0 is the bias at z = 0 (Fry 1996). We calculate the growth factor following Carroll, Press, Turner (1992). This galaxy-conserving model provides an upper limit of the bias evolution as shown in Fig. 11. On the other hand, if galaxies continue merging with
No. ]
Clustering of Galaxies in MOIRCS Deep Survey Region
9
Table 1. Clustering measurements of galaxies with K ≤ 25.0
γ = 1.8 z
Criteria K flux K < 23 K < 24 K < 25 K < 23 K < 24 K < 25
1