automated software analysis and monitoring of both quality- related code metrics and development activities by means of software maps. A software map ...
Monitoring Code Quality and Development Activity by Software Maps Johannes Bohnet, Jürgen Döllner Hasso-Plattner-Institute for IT Systems Engineering @ University of Potsdam Germany
{bohnet, doellner}@hpi.uni-potsdam.de
ABSTRACT
1. INTRODUCTION
Software development projects are difficult to manage, in general, due to the friction between completing system features and, at the same time, obtaining a high degree of code quality to ensure maintainability of the system in the future. A major challenge of this optimization problem is that code quality is less visible to stakeholders in the development process, particularly, to the management. In this paper, we describe an approach for automated software analysis and monitoring of both qualityrelated code metrics and development activities by means of software maps. A software map represents an adaptive, hierarchical representation of software implementation artifacts such as source code files being organized in a modular hierarchy. The maps can express and combine information about software development, software quality, and system dynamics; they can systematically be specified, automatically generated, and organized by templates. The maps aim at supporting decisionmaking processes. For example, they facilitate to decide where in the code an increase of quality would be beneficial both for speeding up current development activities and for reducing risks of future maintenance problems. Due to their high degree of expressiveness and their instantaneous generation, the maps additionally serve as up-to-date information tools, bridging an essential information gap between management and development, improve awareness, and serve as early risk detection instrument. The software map concept and its tool implementation are evaluated by means of two case studies on large industrially developed software systems.
Developing and managing long-term software systems and legacy systems is challenging, in general, because one needs to find a balance between explicit development progress, e.g., measured by the number of implemented features per iteration, and an internal high-quality of the implementation. The term internal quality refers to "less visible" quality-related aspects of the system implementation such as conformance to architectural/design principles, modularity and clearly defined interfaces, and code complexity. In general, internal quality measures how well a software system is built. A low internal quality implies long-term risks and decreases maintainability. Contrarily, the term external quality of the system implementation refers to visible aspects such as post-delivery defects detected by customers or the number of implemented features per iteration. In general, external quality measures how well the software system operates and behaves as expected. A high external quality can be measured by interacting with the software, observing its behavior, and assuring that it conforms to the functional specifications. Finding a balance between external and internal quality is difficult because the return on investment into external quality appears to be immediate. However, the return on investment into internal quality is medium to long term. Hence, long-term code quality is frequently deferred in favor of short-term gain, which in turn creates future pressure to remediate internal quality aspects. Symptoms for a low internal quality are, for instance, that the implementation of new features frequently leads to defects – the developers’ understanding of the system architecture does not reflect the as-is architecture and accidental complexities and design anomalies are introduced that cause the structural integrity to decay [8]. As modifying a long-living software system is necessary – otherwise it won’t remain useful to the users [7] – increased complexity and software decay are inevitable if the internal quality cannot be “seen” and realized from the management perspective.
Categories and Subject Descriptors D.2.8 [Software Engineering]: Metrics – Complexity measures, Process metrics, Product metrics. D.2.8 [Software Engineering]: Management – Productivity.
General Terms Management, Measurement
Keywords
The perspectives of managers1 and developers often differ significantly with regard to where to invest the scarce development time, especially when internal quality is concerned. Developers tend to vote for investments into internal quality but managers often tend to question these investments’ values and, therefore, tend to decline to approve them. For managers, leading a software development project means to optimize the resources
Managing Technical Debt, Software Quality, Software Visualization, Automated Software Analysis, Refactoring
Permission to make digital or hard copies of all or part of this work for personal or classroom use is granted without fee provided that copies are not made or or commercial that Permission to distributed make digitalforor profit hard copies of all or advantage part of thisand work for copies bear this noticeuse andis the full citation first page. To copy personal or classroom granted without on feethe provided that copies are otherwise, republish,fortoprofit post oroncommercial servers or advantage to redistribute to copies lists, not made ortodistributed and that bear this prior noticespecific and thepermission full citationand/or on thea first requires fee. page. To copy otherwise, to republish, to post servers or to redistribute to lists, MTD’11, Mai 23,on 2011, Waikiki, Honolulu, HI, USA.requires prior specific permission and/orACM a fee.978-1-4503-0586-0/11/05... $10.00. Copyright 2011 MTD’11, May 23, 2011, Waikiki, Honolulu, HI, USA Copyright 2011 ACM 978-1-4503-0586-0/11/05 ...$10.00
1
9
The term manager refers to all stakeholders in the development process that decide about where to invest the developers’ time.
Foundation (460kLOC C/C++). In the case studies, we show how software maps enable managers to identify parts of the code with a low degree of quality that should reasonably be refactored to both speed up current development and to reduce the risk of future maintenance problems.
2. RELATED WORK An early research contribution for making development activity visible was the SeeSoft system of Eick et al. [3]. In this approach miniaturized representations of source code are used to display a large amount of source code in a condensed way. The code lines are colored according to metrics, e.g., modification age. Froehlich and Dourish [4] extend the SeeSoft approach. Besides the code modifications stored in a configuration management system, their Augur tool analyzes the source code to be able to classify code lines as comments, method declarations, method definitions, etc. The classifications help to visually distinguish between different code line types. Both approaches operate on a detailed code-line abstraction. Our software map approach operates on a more coarse-grained level. The maps display files or classes as smallest code artifacts, respectively. The SeeSoft approach could be combined with our approach if a drill down to code line level would be necessary for a specific task.
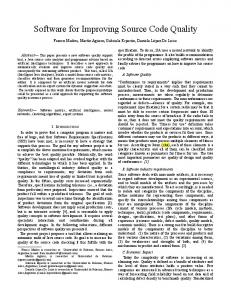
Figure 1: A software map depicting the source code files of the JBoss software system. Files are grouped according to their containment relations within the system’s hierarchical module structure by a 2½D treemap. for short-term goals, e.g., implemented features, and long-term goals, i.e., minimizing the future economic and technical risks.
A variety of approaches for assessing the internal quality of software systems compare metrics values against thresholds and aggregate metrics to combined metrics. Correia et al. [2] propose a pragmatic approach for measuring internal quality of a software system. They map system properties onto quality characteristics using relative weights that were empirically determined. Another approach for aggregating quality related metrics to a single value – using the metaphor of technical debt – is reported by Gaudin [5]. A single dollar value for the technical debt of the implementation due to a lack of internal quality is calculated as linear combination of various code metrics. Our software map approach differs from the mentioned approaches because we do not aggregate metrics. The software maps show each code file of a software system together with multiple values of quality-related metrics. In contrast to the aggregation approach, metrics values of different files can be compared to find outlier files with regard to multiple quality dimensions.
There are multiple reasons why solving this optimization problem is difficult from the perspective of the management: (1) Internal quality is largely invisible/non-observable/non-understandable to managers and customers. (2) Increasing internal quality does not generate short-term revenue. (3) Applying design short-cuts initially give the impression of quick development success. This paper proposes the concept of software maps and its implementation as a tool. The main goal of software maps is to make internal quality better visible and realizable to managers as well as to provide an effective communication means between managers and developers. Software maps provide reliable status information because they can be automatically derived from implementation artifacts and data from configuration management systems (SCM). The maps visualize aspects related to internal quality together with the information of where and when developers have been working in the code – software maps allow us to combine and evaluate developer-related and system-related information. This way, these maps enable managers to better consider internal quality aspects in their decision-making processes. The concept does not aim on finding new measurements for internal quality. Instead, the concept of thematic software maps handles a large variety of measures and allows us to combine and visualize.
Our visualization technique is similar to the CodeCity tool proposed by Wettel and Lanza [11]. They use 3D cubes organized on a plane to represent classes of object-oriented software within their package structure. Class metrics are visualized as ground area, height, and color of the cubes. With EvoSpaces, Wettel and Lanza [12] extend their approach and visualize how the implementation evolved by means of showing a series of development snapshots. Our approach differs from the EvoSpaces approach in two ways. First, the goal of the visualization is different. The EvoSpaces tool aims at revealing the evolution history of a system implementation. With EvoSpaces, users can reason about the origins and the causalities, which led to the current state of a system. In contrast, our goal is to provide managers and other stakeholders with up-to-date information on the internal quality of the system combined with information where and which developers perform code modifications – for an adaptable time range of interest. Second, our visualization technique uses a screen-space ambient occlusion technique to provide an optimized 2½D representation of the visual elements. Using this advanced computer graphics technique improves the perception quality of virtual 2½D environments displaying large
The thematic software maps concept has been implemented by a software maps tool. As one of its key applications, it facilitates finding answers on questions such as when and where in the code a major refactoring has a high return of investment – even if the delivery of specific features is delayed. Software maps are defined by a set of visual variables (e.g., footprint size, height, color, texture, brightness for each visualized implementation artifact), each of which can be used one source of information. To evaluate the proposed concept of software maps, we report on two case studies where we applied the concept on large, industrially developed software systems, namely, the JBoss software system of Red Hat Inc. (850kLOC Java) and the Blender software system developed by Not A Number B.V. / Blender
10
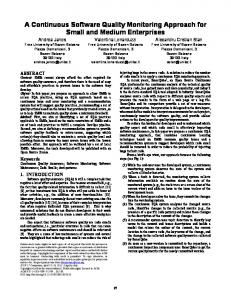
Figure 2: A software map depicting complexity hotspots in the implementation of the JBoss software system. Metrics mappings: ground area = lines-of-code; height = McCabe complexity; color = level of control-flow-nesting. amount of small visual elements – it facilitates to distinguish between these elements.
the level of control-flow-nesting (e.g., nested if statements) are chosen to reveal complex parts of the code.
3. SOFTWARE MAPS
The tool implementation of the software map supports to show different metrics for each code file by encoding them into visual attributes of the block representations: (1) ground area, (2) height, and (3) color; further attributes are possible such as texture, brightness, and flickering. However, the number of visual variables should be kept small because our human perception processes can only distinguish few of them in a pre-attentive, efficient way [6, 10].
A software map represents an adaptive, hierarchical 2½D representation of software implementation artifacts such as source code files (e.g., *.java, *.cs, *.cpp, *.h, *.xml, …) being organized in a modular hierarchy (e.g., file hierarchy, module hierarchy, namespace hierarchy). We can visually map developer-related and system-related information on their visual variables. This way, the maps can be systematically specified, automatically generated, and organized by templates. In Fig. 1, an example of a software map is given. The map depicts the implementation of the 850kLOC JBoss software system of Red Hat Inc. Each block represents a source code file; the blocks are physically grouped according to the files’ containment relations within the module hierarchy. For the layout of the files on the map, a treemap algorithm is used [9].
The goal of software maps is to enable managers to better see, assess, and realize internal quality. Particularly, the maps aim at facilitating the identification of outliers, i.e., those parts of the code where an improvement of quality is most necessary. One advantage of this visual approach is that the human perception is optimized on detecting outliers. If the basic representation elements are processed pre-attentively, the low-level human visual system can rapidly identify outliers [6]. A prerequisite for effective visual processing is that the basic visual elements are perceived as distinguished elements. Therefore, we apply a specialized computer graphics illumination technique (screenspace ambient occlusion) for realistic shadowing in the 2½D software map. With the technique, a high contrast between the representation elements is achieved. Our technique is an adaption
After having organized the code files on the map, the map is used as a basic representation for projecting file-related metrics on it (Fig. 2). These metrics are either indicators for quality of the files or they are related to the development process and show when, where, and how often which developer modifies code. In the illustrated map, the metrics lines-of-code, McCabe complexity and
11
Figure 3: Software maps are used within the visualization step of the automated software analysis process. are not necessarily the files that represent the biggest quality problems. However, files that are large and monolithic (lines-of-code), complex (McCabe, Halsted, #code-lines in deep nesting levels, …), highly coupled (fan-in, fan-out, …), full of code clones, not covered by tests (code coverage), and are modified frequently by the developers should likely be improved with regard to quality.
from high-end computer graphics algorithms used in the gaming industry. The visual approach of software maps aims on overcoming further problems that arise while trying to assess the internal quality of a software system by analyzing metrics values: 1)
2)
3)
There are no universal threshold values for file metrics that could classify value ranges into good and bad quality. For a given software system, instead, one has to analyze the metrics values of one code file relatively to the metrics values of all other files. Software maps facilitate this analysis process because they comprehensively show all files together with their metrics values and, by this, reveal whether a file has relatively high metrics values.
The mentioned problems are general problems when trying to assess internal quality with metrics. Conventional means for exploration of metrics values such as metrics tables (e.g., Excel sheets) are less suitable means because users can find outliers in one metrics dimension only. Likewise, approaches that aggregate over multiple metrics dimensions are only suitable if the way of combining the metrics values has been adjusted according to the specific software system’s characteristics, particularly being weighted with regard to the system’s architecture.
Assessing whether a metrics value of a file is too high depends on where the file is located within the system architecture. A file that is part of a computer vision module, for instance, and encapsulates image processing algorithms might have a high value of a complexity metrics. For a file in the user interface layer of the system, however, the same high complexity value would probably not be acceptable. Software maps address this assessment problem by providing an architectural overview of the modular structure of the system and by showing metrics values within this architectural context.
4. THE ANALYSIS PROCESS WITH SOFTWARE MAPS The visualization of internal quality and development activity with software maps is one step of the larger general process of automated software quality analysis (Fig. 3). The analysis process consists of (1) extracting data from the software system’s artifacts, (2) integrating the data that come from the different sources, and (3) visualizing the data. The software map concept is used within the visualization step. This essential last step closes the analysis loop and makes raw analysis results accessible and usable for the stakeholders.
To assess internal quality, it is not enough to consider one metrics in isolation. The 10 code files of a software system with the highest McCabe complexity values, for instance,
12
5.1 Case Study: JBOSS – RED HAT INC. The JBoss software system is a Java-based application server, a framework dedicated to the efficient construction of web-based applications. JBoss is developed by Red Hat Inc. It consists of approximately 850.000 lines of Java code organized in ~6500 code files. About 40 developers are actively performing code modifications.
5.1.1 Complexity Hotspots Fig. 1 shows complete source code files within their modular hierarchy as a software map. Interestingly, the map reveals that ~45% of the code is test code (370kLOC). As this code also needs to be maintained besides the production code, managers should have a particular focus on the internal quality of the test code. The focus is necessary because there is no safety net for test code: tests are not tested. Hence, requirements with regard to complexity are stricter for test code.
Figure 4: A complex test case is revealed that may be difficult to be maintained. Starting points of the automated software analysis process are the implementation artifacts and repositories. These central elements and infrastructures are available in all common software development projects. During data extraction, various sources of information on the as-is implementation and its behavior is collected. By analyzing the source code, metrics are generated that serve as indicators for internal quality. Additionally, the modular structure of the as-is implementation is revealed. Via dynamic analysis, test coverage information is collected – another indicator for internal quality. Information about the development process is collected from configuration management and issue tracking systems. This information includes when, why, and by whom specific code modifications were performed.
Fig. 2 shows complexity hotspots in the JBoss implementation. The metrics that are projected on the software map are: ground area = lines-of-code; height = McCabe complexity; color = level of control-flow-nesting. In the production code part, a handful of files are identified where all three quality aspects are outstanding low. These files are located in the server module and the tomcat module. Having identified these quality outliers, a manager can precisely ask the developers for the reasons for the high complexity and discuss with the developers whether and when refactorings are beneficial for long-term sustainability. In the test code, the complexity metrics values are not as high as in the production code. However, here also outliers exist that a project manager should be aware of. The map depicted in Fig. 4 reveals a test case with a significant number of code lines being located in deeply nested control branch structures [e.g., if(a==b)…if(…)…for(…)…if(…)…]. There are 10 nested condition statements! The manager should discuss with the developers whether there is a good reason for implementing the test case in such a complex way or whether there is an implementation solution that is easier to understand and to maintain.
In the next step of the analysis process, the isolated data sets are combined into an integrated data model and stored in a software analysis database. Finally, the data is visualized with software maps and other means. In our tool implementation, we provide various views on the analysis data that permit to retrieve overview information and to drill down and retrieve on demand details necessary for decision-making. The tool implementation is integrated into a continuous integration environment so that managers are provided with always up-to-date information on quality and development activity. The continuous integration environment triggers the creation of the raw data every time a developer publishes a code modification in the configuration management system. So managers can see in “real-time” how the software evolves. Hence, software maps can be used as an early warning system for managers enabling them to detect problem situations early and to better steer the software project.
5.1.2 Development in Code with low Quality Visualizing difficult-to-maintain code with software maps that show code metrics gives an overview of the internal quality of the system and reveals the outlier files with low quality. However, one needs to consider the development activity to be able to decide which parts of the code are problems for the project’s progress in the current situation. If the developers need to work in low quality files, they are probably slower than if they had to modify code with higher quality. Additionally, the risk is higher that with the code modifications new defects are introduced into the system. Reasons for these negative effects of modifications in files with low quality include:
5. CASE STUDIES In the next two sections, we report on case studies we have performed to validate the concept of software maps as suitable means for assessing internal quality and for obtaining hints where quality measures should reasonably be applied in the code.
•
The subject systems in the case studies are large, industrially developed software systems: JBoss (Red Hat Inc.) and Blender (Not A Number B.V. / Blender Foundation). For both systems, we illustrate how software maps can enable managers to gain insight into current quality and development situations. For both software systems, we depict different software maps and discuss how the maps serve as objective basis for decision-making and steering the software project.
13
Understanding the as-is implementation: Prerequisite for modifying code is that the developer understands which parts of the implementation are relevant for the system features that the developer’s task concerns. In code with low quality, it is often time-consuming to obtain this understanding due to a lack of modularity, a lack of clear functional responsibility, and complex control and dependency structures in the code.
Figure 5: JBoss development activity 5.Oct. 2010 – 5.Jan. 2011. Developers operate on large, complex files in the tomcat module. •
quality. Reasonably, one would also consider further metrics related to internal quality such as fan-out/fan-in, for instance. In the given example, the manager would probably discuss with the developers whether code modifications in the file JBossCacheManager.java of the tomcat module are more difficult and time-consuming than necessary due to the files large size; it is the largest file of the complete JBoss implementation (Fig. 7). Furthermore, they would discuss whether it would be beneficial to clean up the code right now before continuing the development work.
Understanding the impact of a change: When modifying code with low quality, it is often difficult for a developer to assess the impact of the change. In coupled code lacking of modularity and clearly defined module interfaces, changing a code line may impact multiple system features. For developers, it is timeconsuming to assure that the change only affects the taskconcerned feature and conserves all other system behavior. Likewise, it takes time for developers to assess the impact of modifying a code line in complex code, e.g., in code with high McCabe complexity where the modified line lies in the midst of nested control structures.
Hence, with such a view on the development activity and quality, managers can observe potential future quality-related risks at an early stage. Often, it turns out beneficial to directly invest into increasing the internal quality before continuing to implement new features. A quality measure could be to perform a refactoring so that the new design speeds up further modifications on the respective parts of the code.
With a software map as shown in Fig. 5, managers can see and identify where the developers are currently working in the code together with a software-quality related information. The analysis is restricted to those code files that were modified within a specific time range. For choosing the time range, the development activity over time is depicted (Fig. 5 upper part, Fig. 6). The borders of the time range can interactively be moved. The grey lines correspond to Saturdays and Sundays. In Fig. 5 the time range from October 5, 2010 and January 5, 2011 is selected.
Steering the project in this way is an example of the principle of mutual benefit that Kent Beck describes in his book Extreme Programming Explained [1]: “Mutual benefit in XP is searching for practices that benefit me now, me later and my customer as well”. Increasing the internal quality at the right time as discussed above is a win-win situation. It speeds up the developers now and simplifies maintenance of the code later.
In the software map all files that were not modified within the given time range are represented by blocks with default ground area, height, and color. For all modified files, height shows the number of changes in the files. The ground areas of the blocks correlate with the files’ lines of code. Hence, the manager obtains an overview whether the developers need to work in large, monolithic code files. Likewise, the color indicates the complexity of the files (McCabe complexity), another indicator for low
Figure 6: The code modification history permits to choose a time range for the analysis of the development activity.
14
Figure 9: Monolithic and most complex file in the implementation of the Blender software system.
Figure 7: Development activity in the largest file of the JBoss software system.
5.1.3 Revealing Error-Prone Code Files
system is used for the Blender system.
Providing a holistic view on internal quality and on the development activity creates further synergies. If the configuration management system that stores and manages code modifications is linked to an issue/bug tracking system, modifications can be classified as bug-related or not. Even if there is no link to such a tracking system, code modifications can be identified as bug fixes if developers use as a convention keywords in the change message.
The Blender software system developed by Not A Number B.V. / Blender Foundation is a tool for creating, modeling and rendering 3D content. The system comprises 460.000 lines of C/C++ code. Approximately 40 developers are actively participating in the development.
5.2.1 Complexity Hotspots Fig. 9 shows the all source code files within their modular hierarchy as software map. The ground area of the blocks depict lines-of-code; the height corresponds to the McCabe complexity of the most complex function in the file; and the color indicates the maximum nesting level of branch constructs. The readfile.c source code file is quickly identified as a file with outstanding low quality. The function do_versions() that is implemented in the file comprises 1273 branch statements!
Fig. 8 shows a software map that reveals which code files of the JBoss implementation were modified in the context of bug fixes between August 31, 2010 and January 5, 2011. The MappedReferenceMetaDataResolverDeployer.java file in the server module is one of them. It is large (lines-of-code), it is the most complex file of the complete implementation (McCabe complexity), and a significant part of its code lines are located deep within nested branch structures (8 times if()…if()…). With this information on bug fix activities, a manager should discuss with the developers whether the low quality of the file led to the defects. If this turns out to be true, the manager should plan a refactoring of this file in the next development iteration to lower the future risk of further bugs being contained or introduced in this complex and monolithic code file.
5.2.2 Development in Code with low Quality Next, we observe how developers work within the code. Fig. 10 shows the development activity from July 3 to October 13, 2010. Again, the source code file readfile.c is an outlier with quality characteristics that strongly suggest a refactoring. The file is changed several times per week (yellow “days” in Fig. 10 upper
5.2 Case Study: BLENDER – NAN B.V. In the last section, we evaluated the software map approach on the JBoss system. In this section, we create similar maps that reveal internal quality and development activity in the Blender software system. The same set of map specifications as for the JBoss
Figure 8: Files that are modified in the context of bug fixes.
Figure 10: The readfile.c source code file is frequently modified by a large number of different developers.
15
Furthermore, we will extend the software map concept in a way that the identification of trends in metrics values is supported. Additionally, we work on concepts to integrate information on multiple software projects into software maps to provide higher level management with decision-support regarding different project teams across a portfolio of multiple systems. Furthermore, we will examine how to explicitly connect other technical-debt related concepts that measure hidden costs and risks in the code by means of aggregated values.
7. ACKNOWLEDGMENTS The project is subsidized by the German Federal Ministry of Economics and Technology. We thank Software Diagnostics (www.softwarediagnostics.com) for providing us with their Software Diagnostics Studio technology used as research platform.
8. REFERENCES [1] Beck, K.: Extreme Programming Explained: Embrace Change, Addison-Wesley Professional, 1999
Figure 11: The file drawobject.c is frequently changed in the context of bug fixes.
[2] Correia, J., Kanellopoulos, Y., and Visser, J.: A survey-based study of the mapping of system properties to ISO/IEC 9126 maintainability characteristics, IEEE Int'l Conf. on Software Maintenance, 2009, 61-70
part) by a large number of different developers.
5.2.3 Revealing Error-Prone Code Files The software map showing bug fixing activities from March to October 2010 reveals that some files are frequently changed in the context of a bug fix. The source code file drawobject.c, for example, is one of them. Based on these findings, a manager responsible for the development of the Blender project could discuss with the developers why the outlier files are error-prone. Additionally, testing efforts should be focused on these files.
[3] Eick, S., Steffen, J., and Sumner, Jr.: Seesoft-A Tool for Visualizing Line Oriented Software Statistics, IEEE Trans. on Software Engineering, 1992, 18, 957-968 [4] Froehlich, J. and Dourish, P.: Unifying Artifacts and Activities in a Visual Tool for Distributed Software Development Teams, Proc. of the Int'l Conf. on Software Engineering, 2004, 387-396
6. CONCLUSIONS
[5] Gaudin, O.: Evaluate your technical debt with Sonar, http://www.sonarsource.org/evaluate-your-technical-debtwith-sonar
Internal quality aspects of software systems should be tracked, managed, and mitigated during development and maintenance of a software system. Left unmanaged, a low internal quality can lead to systems with significant long-term problems being difficult to maintain and evolve. A major problem for achieving maintainable software is that internal quality is largely invisible/non-realizable to most stakeholders, particularly, to the management. However, as a manager one needs to balance short deadlines with long-term sustainability, which is a challenge if information on internal quality is hardly accessible.
[6] Healey, C., Booth, K., and Enns, J.: High-speed visual estimation using preattentive processing, ACM Trans. Comput.-Hum. Interact., 1996, 3, 107-135 [7] Lehman, M. and Belady, L.: Program evolution: processes of software change, 1985, Academic Press Professional, Inc. [8] Parnas, David: Software aging. In: International Conference on Software Engineering, 1994, pp. 279–287
The concept of software maps proposed in this paper aims on providing all stakeholders including managers with an automatically generated, factual, and up-to-date access to explicit representations of the quality of the system implementation and its evolution. This visualized information serves as basis for management decisions. In particular, it facilitates the decision where to invest the scarce developers’ time: into the implementation of new features to reach short term goals or into the quality of the code to obtain sustainable development and to facilitate future maintenance of the system.
[9] Shneiderman, Ben: Tree visualization with tree-maps: 2-d space-filling approach. In: ACM Transactions on Graphics 11 (1992), No. 1, pp. 92–99 [10] Ware, Colin: Information Visualization: Perception for Design. Morgan Kaufmann Publishers, 2004 [11] Wettel, R. and Lanza, M.: Visualizing software systems as cities, Proc. of the IEEE Int'l Workshop on Visualizing Software For Understanding and Analysis, 2007, 92–99 [12] Wettel, R. and Lanza, M.: Visual Exploration of Large-Scale System Evolution, Proc. of the IEEE Working Conf. on Reverse Engineering, 2008, 219-228
As future work, we plan to extend the software map concept by additional visual variables such as textures, flickering, and focus&context techniques. We also plan to systematically construct a set of templates of frequently used and most important combinations of develop-related and system-related information dimensions.
16