Monitoring spatial and temporal distribution of Sea Surface Temperature with TIR sensor data Eufemia Tarantino Politecnico di Bari, Via Orabona 4 - 70125 Bari - Italy. E-mail:
[email protected]
Abstract
This study was primarily aimed at verifying the potentiality of medium spatial resolution Thermal Infrared (TIR) data in monitoring environmental aspects strictly correlated to SST (Sea Surface Temperature), such as industrial cooling water discharges and the increase in seawater temperature over time, at two coastal sites in the Apulia region (Italy).TIR data acquired by LANDSAT ETM+ and ASTER satellite instruments were used to observe SST and provide insight into its spatial variability, in this case totally lacking information from conventional in situ measurements. The spatial information obtained, clearly mapped for its visual interpretation, can significantly contribute to improving general surface near-shore water quality monitoring. Keywords: Thermal Infrared; LANDSAT ETM+; ASTER; Sea Surface Temperature.
Introduction
A significant population percentage lives in low elevation coastal areas and is directly at risk from sea-level rise, coastal erosion, stronger storms and other seaward hazards induced by climate change [McGranahan et al., 2007]. The remaining coastal areas undergo intense anthropogenic effects. The continuous increase and additive effect of various pollution sources lead to a progressive eutrophication and microbiological contamination of water, making it substantially more difficult to use for human needs [Kaplan et al., 2003]. As a consequence of the increasing threat to our environment, it is important to organize coastal water area monitoring, and create corresponding systems, including the most recent aerospace platforms [Bondur, 2005]. Thermal infrared (TIR) sensors have been successfully deployed at global scale on operational meteorological satellites for over 30 years to provide images of cloud top and sea surface temperatures (SST). Since TIR radiance depends on both the temperature and emissivity of the target, and the emissivity will vary as the land cover changes, it is difficult to measure land surface temperatures. On the other hand, the emissivity of water is known and nearly constant (98%), approaching the behaviour of a perfect blackbody radiator [Klemas, 2009]. Considering that the TIR radiance measured over the oceans will primarily vary with SST, an accurate determination of SST (± 0.5 ºC) can be performed through some atmospheric corrections [Ikeda and Dobson, 1995]. Accurate long-term SST observations are important to a wide range of oceanographic studies and global-scale events, e.g. to investigate western boundary currents, such as the Gulf Stream and Kuroshio, or to monitor Italian Journal of Remote Sensing - 2012, 44 (1): 97-107 doi: 10.5721/ItJRS20124418
97
Tarantino
TIR sensor data
El Niño events of major upwelling areas and the elevated SSTs damaging coral reefs which support a large diversity of sea life. At local scale, TIR data can aid identifying a severe environmental phenomenon which may extend for only a few kilometres studying estuary and coastal thermal plumes: thermal pollution resulting from power plant and industry discharges of water used in cooling processes. Aquatic life gets affected as the thermal pollution lowers dissolved oxygen and increases respiration rates, killing an ever-increasing quantity of fish in their positive feedback cycle. The density and viscosity of water also decrease as temperature increases. This results in a faster settling of suspended solids. The rate of evaporation significantly increases too as temperature increases, resulting in a greater wastage of water in the form of its vapour. The Thematic Mapper (TM) on the LANDSAT -5 satellite, launched March 1, 1984, and the Enhanced Thematic Mapper Plus (ETM+) on the LANDSAT -7 satellite, launched April 15, 1999, provide a single 10.5-12.5 µ m TIR band. The main differences between these two technologies are related to spatial resolution and Noise-Equivalent Temperature Difference (NEΔT), respectively 120 m and NEΔT of ≤ 0.30 at 280 K for the LANDSAT -5 and 60 m and NEΔT of 0.22 at 280 K for LANDSAT -7 [Barsi et al., 2003]. The launch of LANDSAT ETM+ was followed by the introduction of the first Earth Observing System (EOS) platform, subsequently named Terra, which included the Advanced Spaceborne Thermal Emission and Reflection Radiometer (ASTER) with five thermal infrared spectral bands, each with a spatial resolution of 90 m and NEΔT of ≤ 0.3 K at 280 K [Yamaguchi et al., 1998]. The capability of these new instruments allows to develop new applications with thermal infrared data in order to address new issues that could not be addressed with earlier instruments [Steissberg et al., 2005]. LANDSAT sensors proved to be useful in studying inland water processes [Rogers et al., 1976] and the clarity and color of water associated with changes in sediment input or the amount of chlorophyll [Choubey, 1998]. Thermal infrared data can be processed to look at changes in the surface temperature associated with upwellings or changes in circulation [Schladow et al., 2004; Steissberg et al., 2005]. Gibbons and Wukelic [1989] demonstrated the potential use of LANDSAT-4 and 5 TIR imageries in estimating SST in coastal thermal plumes. Xing et al. [2006] integrated LANDSAT-5 and LANDSAT7 TIR data to detect the thermal pollution of cooling water discharge from the Daya Bay nuclear power station. Ahn et al. [2006] derived detailed SST maps through LANDSAT-5 and 7 sensors, with enhanced information about the plume shape, dimension and direction of dispersion of waste water, in order to study the thermal impact of warm water discharged from Younggwang nuclear power plant on the coastal marine ecosystem. Teggi [2010] proposed a method for improving the spatial resolution of ASTER TIR data aimed at mapping small bodies of water or near coasts. This paper is the first step to investigate the potential of medium resolution satellite TIR data in monitoring SST anomalies due to various environmental pollutants at two Apulian coastal sites, Brindisi and Taranto respectively (Fig. 1). The analysis was implemented on single LANDSAT and multi-date ASTER data in a remote sensing image processing software environment [ITT, 2009]. Due to the lack of contemporaneous ground surveying, the resulting maps were qualitatively compared with the SST measurements published by the Maritime Department of the Italian Agency for the Environmental Protection and Technical Services (APAT). 98
Italian Journal of Remote Sensing - 2012, 44 (1): 97-107
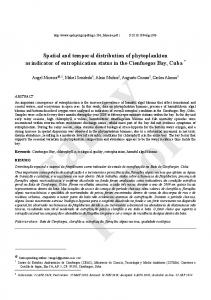
Figure 1 – The two study sites along the Apulian coast.
Data and methods
Study case 1. The coastal water area of Brindisi The first analysis was conducted on one LANDSAT ETM+ TIR data set (acquisition date: July 6th, 2001) from the Southern coast of Brindisi which hosts ENEL “Federico II” power plant (Fig. 2). The plant complex includes 4 sections divided by polycombustible thermoelectric power of 660 MW each, which came into service between 1991 and 1993. This plant made Brindisi a leader in the production of electricity in Italy. The area considered suffers from severe environmental problems, not only in terms of atmospheric pollution from coal combustion but also of sea bed degradation near the heat water discharges of local cooling ponds [Akella et al., 2009].
Figure 2 – Localization of the power plant “Federico II” of Brindisi in the PAN (left)
and TIR (right) LANDSAT ETM+ imagery
To improve the accuracy of thermal pollution identification in TIR sensor data, the highresolution panchromatic data (15 m) was co-georeferenced (reference system UTM 33 99
Tarantino
TIR sensor data
– WGS 84) in order to verify the coastal line coincidence in both the images. LANDSAT ETM+ and ASTER sensors acquire surface temperature data and store it as 8 bit Digital Numbers (DNs). In order to convert these DNs to temperature data, the procedure was subdivided into two phases, the first for data calibration and the second one for radiometric temperature identification [Zhang et al., 2008]. Radiometric calibration was preliminarily carried out to derive thermal radiance (Lsensor). The Digital Number (DN) values of band 6 were converted into spectral radiance L (w×m2 ×sr-1×μm-1) using the following equation: Lsensor = gain $ DN + offset 61@ This is also expressed as: Lsensor = Lmin + ((Lmax - Lmin) /255) $ (DN - Lmin) 62@ where Lmax and Lmin are the spectral radiance values for band 6 at digital numbers 1 or 0 and 255, respectively. Moreover, it is known that band 6 of LANDSAT ETM+ is always acquired in low (L) and high (H) gain states. Band 6L provides an expanded dynamic range and lower radiometric sensitivity and can measure temperatures in between –70 oC and +90 o C, whereas band 6H has higher radiometric sensitivity (although it has a more restricted dynamic range) and can measure temperatures in between -30 oC and +60 oC. For band 6L, Lmin = 0.0, Lmax = 17.04; for band 6H, Lmin = 3.2, Lmax = 12.65. The values for all these parameters were obtained from data header files. Next, the spectral radiance Lsensor was converted into at-sensor brightness temperature T in Kelvin. The conversion formula is given by: Tsen sor =
K2 63@ K ln c 1 + 1m Lsensor
where T is the at-sensor brightness temperature in K; K1 (666.09 K) and K2 (1282.71 K) are calibration constants. The resulting temperature map was not technically considered as a proper SST map, because it also needed to be atmospherically corrected, using either a model or calibration with in situ data. In this case raw LANDSAT TIR data were not atmospherically processed due to the lack of ground based temperature measurements at the time of the satellite overpassing the instruments mounted on the stations located across the study area. The accuracy and precision of deriving surface temperatures from LANDSAT TM band 6 data have already been assessed in a study by Schneider and Mauser [1996], who employed a full atmospheric model to convert at-satellite radiance to an accurate measure of water leaving radiance (and thus water temperature) at a lake in Germany for which extensive in situ water temperature data were available. On average (across 31 images), atmospheric correction increased satellite-derived temperatures by 1.33 K between 9:00 and 11:00 h, the standard crossing times of LANDSAT satellites. Humes et al. [2005]
100
Italian Journal of Remote Sensing - 2012, 44 (1): 97-107
proved that TM-derived temperature was slightly higher than the ground-based temperature (approximately 1.5 ºC). With most current satellite observations at 1 km pixel scale, significant variations in near surface meteorological conditions may be observed, depending on surface conditions. Methods using satellite data indicate at least a ≈ 3 K uncertainty in the estimate of SST when compared to standard weather station observations [Goward et al., 1994; Prince et al., 1998]. Thus, we may expect to slightly underestimate temperatures when corrections are not made, although the exact error shall depend upon specific atmospheric conditions. In this case study, to effectively improve the visual interpretation of SST variations in the processed image, the Linear Stretching function was lastly applied (Fig. 3). A linear stretch clipped off a portion of the histogram tails and then effectively increased the dynamic range by stretching the remaining histogram over the full 0–255 data range. The pixel values in the lower portion of the histogram were automatically set to 0 and the values in the upper portion of the histogram clipped were set to 255.
Figure 3 – Map showing the spatial distribution in °C of Sea Surface Temperature (SST) near the power plant “Federico II” of Brindisi (acquisition date: July 6th, 2001).
Study case 2. The coastal water area of Taranto The coastal water area in the Gulf of Taranto (Ionian Sea) was investigated in this study because of its complex environmental system. It consists of a coastal marine area between two sea basins known as “Mar Grande” and “Mar Piccolo”. Mar Grande is characterized by the presence of important naval and industrial activities. This sea area is connected to the basin of Mar Piccolo by two narrow channels, the so-called “Navigabile” and “Porta Napoli” channels. Mar Piccolo washes the Northern town area of Taranto. It is an inner, semi-enclosed basin with a 21 km2 surface area, divided into two inlets, called first and second inlet, which have a maximum 101
Tarantino
TIR sensor data
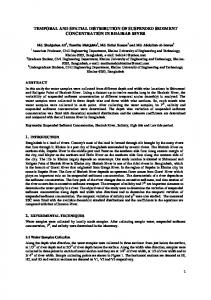
depth of 13 and 8 m, respectively. Its marine ecosystem features a number of lagoons, strongly modified by human activities. Being a semi-enclosed basin, it is affected by water exchange mainly due to its moderate tidal range, which does not exceed 30-40 cm [De Serio et al., 2007]. The source of pollution in Mar Piccolo mainly originates from urban effluents, discharges from local industries, spillages from vessels, harbour operations, and presumably atmospheric transport [Mossa, 2006]. In addition, a large industrial settlement (the most important steelworks in Europe) and a petroleum refinery also affect the neighbourhoods of Taranto, while small rivers and freshwater springs drain the surrounding agricultural soils in the basin of Mar Piccolo [Pisoni et al., 2004; Cardellicchio et al., 2007]. The analysis of this study area was carried out on the multi-date TIR bands of ASTER sensor data (acquisition dates/time: August 11th, 2000 – time 10:07; June 18th, 2006 - time 9:46; August 24th, 2007- time 9:46). In the preprocessing phase the In-Scene Atmospheric Correction (ISAC) algorithm [Young et al., 2002] was applied, only considering at-aperture radiance data to estimate the upwelling radiance and transmissivity of the atmosphere. Lobs = x $ B ]T g + Lu 64@ In eq. [4] Lobs is the observed at-aperture radiance, τ is the transmission of the atmosphere, B(T) is the Planck function, and Lu is the upwelling radiance due to the atmosphere. Figure 4 shows the atmospheric transmission and upwelling spectra related to the five TIR ASTER bands for every single acquisition date, using the Thermal Atm Correction function of the ENVI image processing [ITT, 2009]. Next, the brightness temperature of each pixel from the pixel radiance was derived. For such purpose, digital number (DN) values of thermal infrared bands were converted into spectral radiance Ls (w×m-2×sr-1×μm-1) using the following equation:
L
sensor
= gain $ ]DN - 1g 65@
where gain is different in different bands: gain(10) = 0.006882, gain(11) = 0.006780, gain(12) = 0.006590, gain(13) = 0.005693, gain(14) = 0.005225. Secondly, spectral radiance was converted into brightness temperature by means of the following equation Tsensor =
m cln d
c2 c1 m 5c(Lsens + 1)
n
66 @
where: c1 = 1.191×10⁸ Wm-2sr-1μm-1, c2 = 1.439×104 μm K, λc is the wavelength in μm. In the final phase, the apparent emissivity image was obtained by normalizing the radiance of each pixel to the Planck’s curve that was generated from the pixel with the 102
Italian Journal of Remote Sensing - 2012, 44 (1): 97-107
maximum brightness temperature at an emissivity value of 0.98 (a reasonable hypothesis for water) [Schmugge et al., 2002]. The resulting SST showed substantial concordance with the ground based temperature measurements taken at the time of the satellite overpassing the mareographic station (SM3810 model) located at the pier St. Eligio in Taranto’s harbor. Such measurements were published by the Maritime Department of the Italian APAT. At 10:00 h, the crossing time of ASTER satellites, the measured temperatures were: August 11th, 2000 – 24.5 °C; June 18th, 2006 - 22.0 °C; August 24th, 2007- 27.2 °C. Lastly, to make previous image treatments more effective and enhance the interpretation of SST variations in the processed image, the Linear Stretching function was implemented in this study case, too.
Figure 4 – Plots of the resulting atmospheric transmission and upwelling spectra related to the five TIR ASTER bands. 103
Tarantino
TIR sensor data
Results and conclusions
The final data from both study cases were interpreted in order to better understand the environmental processes affecting both areas. The SST values derived from LANDSAT thermal data were divided in two distinct zones (zone 1 and zone 2) in the coastal area of Brindisi, with 20.51 °C (T1) and 23.25 °C (T2) values as mean temperatures (Fig. 5). The rate of change in temperature ∆T between zone 1 and zone 2 was then calculated, normalizing the difference between T1 and T2. DT ]%g = ^T1 - T2h /T2 # 100 = 13.26% 67@ The resulting SST spatial distribution combined with the obtained increase in temperature ∆T between zone 1 and zone 2 demonstrated the effectiveness of this image data analysis in upwelling thermal anomalies in sea water.
Figure 5 – Identification of zones 1 and 2 for the calculation of SST variation near the power plant “Federico II” – Brindisi.
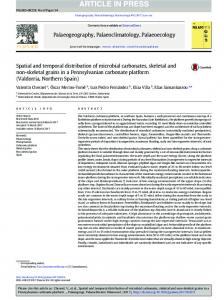
As to SST spatial and temporal distribution in the Gulf of Taranto’s study area, a qualitative analysis of the time series processed from ASTER showed a progressive increase of temperature, especially for 2007 data (Fig. 6). The resulting image showed a significant SST rise for the second inlet of Mar Piccolo, correlated to its weak currents, resulting in attenuated mixing and dispersion. As for the first study case, the prevalence of temperature anomalies can’t but emphasize the vulnerability of the coastal area studied. The examination of results as presented in this study shows the effectiveness of satellite
104
Italian Journal of Remote Sensing - 2012, 44 (1): 97-107
methods and technologies in thermal monitoring of coastal areas subjected to intense atrophic activities. The SST maps derived from both TIR LANDSAT and ASTER sensors captured fundamental properties such as minimum and maximum temperatures, dates of temperature extremes, and rates of change in temperature, all useful in understanding estuarine and coastal processes which could hardly be recognized through lower spatial resolution.
Figure 6 – The SST changes identified on the multi-date TIR ASTER data (2000, 2006 and 2007) in the marine coastal area between Mar Grande and Mar Piccolo – Taranto.
In order to provide reliable information on favorable and unfavorable environmental conditions and in the water area studied, permanent monitoring should be maintained on major ground based parameters (current fields, wind speed and direction, air temperature, etc.). Such monitoring should be performed by processing and analyzing remotely sensed data and comparing it with the results of in-situ measurements. When new satellite techniques aimed at generating, organizing, storing, and analyzing spatial information are combined with watershed, estuarine and coastal ecosystem models, coastal managers and scientists have sufficient means to assess the impacts of alternative management practices.
References
Ahn, Y.H., Shanmugam, P., Lee, J.H., Kang, Y.Q. (2006) - Application of satellite infrared data for mapping of thermal plume contamination in coastal ecosystem of Korea. Marine environmental research, 61, 186-201. doi: http://dx.doi.org/10.1016/ j.marenvres.2005.09.001. Akella A. K., Saini R. P., Sharma M. P. (2009) - Social, economical and environmental impacts of renewable energy systems. Renewable Energy, 34: 390–396. doi: http:// dx.doi.org/10.1016/j.renene.2008.05.002. Barsi J. A., Schott J. R., Palluconi F. D., Heider D. L., Hook S. J., Markham B. L. (2003) - LANDSAT TM and ETM+ thermal band calibration. Canadian Journal of Remote
105
Tarantino
TIR sensor data
Sensing, 29(2): 141–153. doi: http://dx.doi.org/10.5589/m02-087. Bondur V. (2005) - Complex Satellite Monitoring of Coastal Water Areas. Proceed. of 31st Int. Symp. on Remote Sensing of Environment. St. Petersburg. Cardellicchio N., Buccolieri A., Giandomenico S., Lopez L., Pizzulli F., Spada L. (2007) - Organic pollutants (PAHs, PCBs) in sediments from the Mar Piccolo in Taranto (Ionian Sea, Southern Italy). Marine Pollution Bulletin, 55: 451–458. doi: http://dx.doi. org/10.1016/j.marpolbul.2007.09.007. Choubey V. K. (1998) - Laboratory experiment, field and remotely sensed data analysis for the assessment of suspended solids concentration and Secchi depth of the reservoir surface water. International Journal of Remote Sensing, 19(17): 3349– 3360. doi: http:// dx.doi.org/10.1080/014311698214037. De Serio F., Malcangio D., Mossa M. (2007) - Circulation in a Southern Italy coastal basin: Modelling and field measurements. Continental Shelf Research, 27: 779-797. doi: http://dx.doi.org/10.1016/j.csr.2006.11.018. Gibbons, D., Wukelic, G., Leighton, J., Doyle, M. (1989) - Application of Landsat Thematic Mapper data for coastal thermal plume analysis at Diablo Canyon. Photogrammetric Engineering and Remote Sensing, 55: 903–909. Goward S.N., Waring R. H., Dye D. G., Yang J. (1994) - Ecological remote sensing at OTTER: satellite macroscale observations. Ecological Applications, 4: 322–343. doi: http://dx.doi.org/10.2307/1941937. Humes K., Hardy R., Kustas W. P., Prueger J., Starks P. (2005) - High spatial resolution mapping of surface energy balance components with remotely sensed data. Thermal Remote Sensing in Land Surface Processes. Quattrochi D. A. and Luvall J. F. Editors. Taylor & Francis e-Library, Boca Raton, Florida. pp. 110-132. ITT Visual Information Solutions (2009) - ENVI - Environment for Visualizing Images, Version 4.7, Boulder, USA. Kaplan D. M., Largier J. L., Navarrete S., Guinez R., Castilla J. C. (2003) - Large diurnal temperature fluctuations in the nearshore water column. Estuarine Coastal and Shelf Science, 57: 385–398. doi: http://dx.doi.org/10.1016/S0272-7714(02)00363-3. Klemas, V. V. - Remote Sensing of Coastal Resources and Environment. Environmental Research, Engineering and Management, 2(48): 11-18. Ikeda M., Dobson F. W. (1995) - Oceanographic Applications of Remote Sensing. CRC Press, New York. McGranahan G., Balk D., Aderson B. (2007) - The rising tide: assessing the risks of climate change and human settlements in low-elevation coastal zones. Environment and Urbanization, 19(1): 17-37. doi: http://dx.doi.org/10.1177/0956247807076960. Mossa M. (2006) - Field measurements and monitoring of wastewater discharge in sea water. Estuarine, Coastal and Shelf Science, 68: 509-514. doi: http://dx.doi.org/10.1016/ j.ecss.2006.03.002. Pisoni M., Cogotzi L., Frigeri A., Corsi I., Bonacci S., Iacocca A., et al. (2004) - DNA adducts, benzo(a)pyrene monooxygenase activity, and lysosomal membrane stability in Mytilus galloprovincialis from different areas in Taranto coastal waters (Italy). Environmental Research, 96: 163–175. doi: http://dx.doi.org/10.1016/j.envres.2004.02.011. Prince S. D., Goetz S. J., Dubayah R. O., Czajkowski K. P., Thawley M. (1998) - Inference of surface and air temperature, atmospheric precipitable water and vapor pressure 106
Italian Journal of Remote Sensing - 2012, 44 (1): 97-107
deficit using Advanced Very high-Resolution Radiometer satellite observations: comparison with field observations. Journal of Hydrology, 212–213: 230–249. Rogers R. H., Shah N. J., McKeon J. B., Smith, V. E. (1976) - Computer mapping of water-quality in Saginaw Bay with LANDSAT digital data. Photogrammetric Engineering and Remote Sensing, 42(6): 831. Schladow, S. G., Palmarsson, S. O., Steissberg, T. E., Hook, S. J., & Prata, F. J. (2004) - An extraordinary upwelling event in a deep thermally stratified lake. Geophysical Research Letters, 31: L15504. doi: http://dx.doi.org/10.1029/2004GL020392. Schmugge, T., French, A., Ritchie, J. C., Rango, A., & Pelgrum, H. (2002) -Temperature and emissivity separation from multispectral thermal infrared observations. Remote Sensing of Environment, 79: 189– 198. doi: http://dx.doi.org/10.1016/S00344257(01)00272-3. Schneider K., Mauser, W. 1996 - Processing and Accuracy of LANDSAT Thematic Mapper Data for Lake Surface Temperature Measurement. International Journal of Remote Sensing 17: 2027–2041. doi: http://dx.doi.org/10.1080/01431169608948757. Steissberg T. E., Hook S. J., Schladow S.G. (2005) - Characterizing partial upwellings and surface circulation at Lake Tahoe, California–Nevada, USA with thermal infrared images. Remote Sensing of Environment, 99: 2-15. doi: http://dx.doi. org/10.1016/j.rse.2005.06.011. Teggi, S. (2010) - Temperature of coastal waters and of watercourses from ASTER images. Italian Journal of Remote Sensing, 42 (2): 75-86. doi: http://dx.doi. org/10.5721/ItJRS20104226. Yamaguchi Y., Kahle A. B., Kawakami T., Pniel M. (1998) - Overview of Advanced Spaceborne Thermal Emission and Reflection Radiometer (ASTER). IEEE Transactions on Geoscience and Remote Sensing, 36(4): 1062–1071. doi: http:// dx.doi.org/10.1109/36.700991. Young, S.J., Johnson, R.B., Hackwell, J.A., (2002). An in-scene method for atmospheric compensation of thermal hyperspectral data. Journal of Geophysical Research, v. 107, no. D24, 4774. 20 p. doi: http://dx.doi.org/10.1029/2001JD001266. Xing, Q.; Chen, C.; Shi, P. Method of integrating LANDSAT-5 and LANDSAT-7 data to retrieve sea surface temperature in coastal waters on the basis of local empirical algorithm. Ocean Science Journal 2006, 41, 97-104. doi: http://dx.doi.org/10.1007/ BF03022414. Zhang G., Liu J., Fei W. (2008) - Detection of Anomaly Temperature Based on ASTER and ETM+ Thermal Infrared Image. International Conference on Computer Science and Software Engineering, Wuhan, China. pp. 241-244. doi: http://dx.doi.org/10.1109/ CSSE.2008.52.
Received 27/01/2011, accepted 14/07/2011
107