Remote Sens. 2015, 7, 7494-7520; doi:10.3390/rs70607494 OPEN ACCESS
remote sensing ISSN 2072-4292 www.mdpi.com/journal/remotesensing Article
Monitoring Spatial and Temporal Dynamics of Flood Regimes and Their Relation to Wetland Landscape Patterns in Dongting Lake from MODIS Time-Series Imagery Yanxia Hu 1,2, Jinliang Huang 1,*, Yun Du 1, Pengpeng Han 1,2 and Wei Huang 1,2 1
2
Institute of Geodesy and Geophysics, Chinese Academy of Sciences, Wuhan 430077, China; E-Mails:
[email protected] (Y.H.);
[email protected] (Y.D.);
[email protected] (P.H.);
[email protected] (W.H.) University of Chinese Academy of Sciences, Beijing 100049, China
* Author to whom correspondence should be addressed; E-Mail:
[email protected]; Tel.: +86-27-6888-1360. Academic Editors: George P. Petropoulos and Prasad S. Thenkabail Received: 28 December 2014 / Accepted: 29 May 2015 / Published: 5 June 2015
Abstract: Dongting Lake, the second largest freshwater lake in China, is well known for its rapid seasonal fluctuations in inundation extents in the middle reach of the Yangtze River, and it is also the lake most affected by the Three Gorges Project. Significant inter-annual and seasonal variations in flood inundations were observed from Moderate Resolution Imaging Spectroradiometer (MODIS) time-series imagery between 2000 and 2012 in the Dongting Lake. Results demonstrated that temporal changes in inundation extents derived from MODIS data were accordant with variations in annual and monthly precipitation and runoff data. Spatial and temporal dynamics of some related parameters of flood regime were analyzed as well, which included flood inundation probability, duration and start/end date of the annual largest flood. Large areas with high flood inundation probability were identified in 2000 and 2002, but relatively small regions with great flood inundation probability occurred in 2001, 2006, and 2011. Long flood durations were observed in 2000, 2002, 2008, 2010, and 2012, whereas short flood durations occurred in 2001, 2006, and 2011. Correlation analysis techniques were applied to explore spatial-temporal relationships between parameters associated with flood regime and wetland landscape patterns from 2000 to 2012. In addition, this paper presented comprehensive discussions on development of related parameters of flood regime and their influences on wetland landscape pattern after impoundment of the Three Gorges Reservoir, changes in wetland
Remote Sens. 2015, 7
7495
landscape patterns after the flood period, and the role of flooding in wetland evolution and vegetation succession. These results can provide scientific guidance and baseline data for wetland management and long-term monitoring of wetland ecological environment in the Dongting Lake. Keywords: MODIS; flood inundation probability; duration; wetland landscape pattern
1. Introduction The mechanism of vegetation succession is a part of the most important theoretical foundations for wetland restoration and conservation, and has become a central issue of wetland science [1–7]. Although several factors (such as soil nutrients and moisture, as well as the predation, competition, and promotion among wetland plants) influence the succession of wetland vegetation, hydrological conditions are the most significant and complicated elements [8,9]. Wetland hydrology is a major component of the wetland ecosystem, which primarily includes water-level fluctuation, flood inundation probability, hydro-period related variables (start time, duration, and end time of flood), and sedimentary material. In general, the wetland landscape pattern can present spatial distribution of wetland landscape patches for adapting to hydrological processes at different levels [10]. Moreover, the abovementioned water regimes are key factors for spatial differentiation of wetland landscape patterns, which exert pronounced influence on succession of wetland vegetation and benefits of wetland ecosystem [11–13], especially for lakes that experience obvious seasonal variations in inundation extents and those that are connected to large rivers. Some studies supported by observation data have indicated that some changes have appeared in flood regimes in the Dongting Lake after impoundment of the Three Gorges Reservoir [14–18]. The annual runoff in the Yangtze River generally is distributed evenly by lowering water levels in the flood period and raising water levels in the dry period. Runoff and sediment flowing into the Dongting Lake from the Yangtze River have experienced a dramatic drop since the launch of the Three Gorges Project. With the changing water levels in the Yangtze River and the regulation of the Three Gorges Reservoir, wetlands in the Dongting Lake have been periodically or permanently affected by flooding. First, seasonal variations in floods determine varying degrees of flood inundation probability for wetland plants in diverse locations, which could have significant effects on the growth and spatial distribution of wetland vegetation. Second, flood duration and its start/end time could exert profound influence on biomass accumulation of wetland vegetation in different growth stages. The time interval between the end date of current flooding and the start date of subsequent flooding could also have considerable effects on wetland landscape patterns [19]. Third, given that the input and output of runoff are the main material exchanges for wetlands with the outside environment, sedimentary materials brought by floods could lead to depositions or erosions of wetlands and thus could accelerate developments or degradations of wetlands over a long period of time. Studies have shown that long-term floods would have tremendous effects on the processes of wetland evolution and vegetation succession [20–23]. In general, wetlands enduring erosion would tend to be replaced with submerged plants, whereas wetlands suffering sedimentation would have a trend of being substituted by emergent
Remote Sens. 2015, 7
7496
plants. Specifically, reeds and poplars grown in middle–high wetlands would be transferred into meadows when experiencing long-term inundation, whereas meadow wetlands would be invaded by woody plants in the absence of periodic floods [24]. Therefore, dynamic monitoring flood regime has great theoretical and practical significance in understanding succession laws of wetland vegetation and ecological functions of wetlands [13,25,26]. Considerable research has utilized multi-temporal remote sensing imagery, especially Moderate Resolution Imaging Spectroradiometer (MODIS) data with high temporal resolutions, to monitor periodic fluctuations in hydrological conditions [27–33]. MODIS launched in December 1999 can view the surface of the entire Earth every one to two days, which is helpful in monitoring spatial and temporal dynamics of flood regimes at a regional scale [34–37]. MODIS imagery has two principal superiorities over other data sources. First, MODIS data can help understand inter-annual and seasonal changes in the hydrological environment of an entire lake from a global viewpoint, which cannot be achieved by traditional hydrographic surveys with a finite number of monitoring sites. Second, MODIS images with high temporal and spectral resolutions are more effective in identifying water pixels and monitoring frequent fluctuations in wetland environment than other remote sensing imagery with high spatial resolutions (Landsat, SPOT, Quickbird, etc.) [38,39]. The increase or decrease in water flows from the Three Gorges Reservoir changes the flood regime in the Dongting Lake, which would have beneficial or adverse effects on wetland vegetation. Numerous studies have investigated the changes in the wetland environment of the Dongting Lake in response to the Three Gorges Project, such as changes in water levels [40], hydrological environment [41], wetland vegetation biomass [42], and wetland ecosystem services [43]. A few studies have associated flood regimes with wetland landscape patterns as well. The current study, beyond previous applications of MODIS data, not only represented inter-annual and seasonal variations in inundation extents over the period during 2000 to 2012 in the Dongting Lake, but also derived other hydrological related factors (flood inundation probability, flood duration, and the start/end date of the annual largest flood) that are crucial to wetland landscape pattern. Quantitative analysis methods were applied to explore relationships between hydrological factors and wetland landscape patterns. Our goal is to explore an efficient method to monitor changes in wetland vegetation patterns and thus to reflect modifications of the wetland environment resulting from the Three Gorges Project. Combination of long-term Terra/MODIS data with wetland landscape pattern data provided a feasible way to understand the spatial and temporal distributions of flood regimes of the Dongting Lake and to address the insufficiency of measurements from limited hydrologic stations. There were three major objectives in this study. The first was to develop an efficient approach for analyzing spatial and temporal characteristics of flood regimes in the Dongting Lake. The second was to establish relationships between flood regimes and wetland landscape patterns in the Dongting Lake. The third was to explore possible effects of the developments of flood regimes on wetland evolution and vegetation succession after running the Three Gorges Project. Results of this study could establish baseline information for future estimation of flood regimes and provide data for other research. The applications of monitoring dynamics of flood regime and its relation to wetland landscape pattern are of great ecological and economic importance for management of the Three Gorges Reservoir and the enhancement of ecosystem services of wetlands in the Dongting Lake.
Remote Sens. 2015, 7
7497
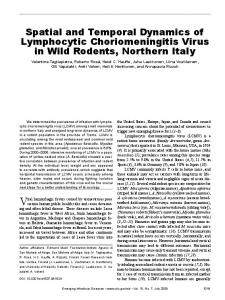
2. Study Area The Dongting Lake (28°42′–29°38′N and 111°52′–113°08′E, Figure 1) is located in the north of Hunan Province and the south of middle reaches of the Yangtze River (Jing River). The lake has an area of 2794.7 km2 and is the second largest freshwater lake in China. Runoff discharged into the Dognting Lake principally contains four tributaries (Xiang River, Zi River, Yuan River and Li River) and those diverted from the Yangtze River through three outlets (Songzi, Taiping and Ouchi), and discharged back into the Yangtze River at the northeast outlet (Chenglingji). These water supplies are mostly concentrated in the flood season from June to September [44]. The Dongting Lake experiences great seasonal variations in water levels because it is affected by the monsoon climate. The annual mean lowest water level is only 20.19 m, which often happens in January. By contrast, the annual mean highest water level can reach 30.24 m, which usually occurs in July [45]. The Dongting Lake is likely to be affected by the Three Gorges Project given its specific geographical location and hydrological connectivity.
Figure 1. Geographical location and hydrological connectivity of the Dongting Lake. The red five-pointed star in the inset map indicates that the Dongting Lake is downstream of the Three Gorges Reservoir. To adapt to the changing water levels, wetland plants are growing along water-level gradients with a zonal distribution [13,46–51]. The primary wetland vegetation communities from water to land are
Remote Sens. 2015, 7
7498
submerged plants, phalaris (Phalaris arundimacea), carex (Carex brevicuspis), reed (Phragmites australis), and poplars (Populus euramericana) [52,53]. Only a few polygonum (Polygonum flaccidum) and artemisia (Artemisia selengensis) sporadically grow in some specific areas. In recent years, there was an expansion trend for poplars (Populus euramericana) planted in high wetlands, which would be a serious threat to the wetland ecological environment in the Dongting Lake. 3. Data and Materials 3.1. Remote Sensing Imagery Terra/MODIS data used in this study involved MOD09GQ and MOD09GA daily reflectance products with resolutions of 250 and 500 m, respectively. These data were derived from the Land Processes Distributed Active Archive Center (LP DAAC) [54] of the United States National Aeronautics and Space Administration (US NASA). MOD09GQ contained two bands (648 and 858 nm), and MOD09GA included seven bands (648, 858, 470, 555, 1240, 1640, and 2130 nm). They were geo-referenced into a consistent projection of Universal Transverse Mercator (UTM) Grid System by MODIS Reprojection Tool (MRT) [55]. Given different resolutions for these two data sets, a “sharpening” scheme [56] was applied to resample the third to seventh bands of MOD09GA to a resolution of 250 m. These bands were then stacked with one to two bands of MOD09GQ to acquire 250 m data with seven bands, which would have an improved appearance of red-green-blue (RGB) images. We used a variety of cloud-removing methods but failed to obtain satisfactory results. Therefore, RGB composite images were used as the last resort to select cloudless images. A total of 4628 images were generated between 2000 and 2012, among which 445 cloud-free images were selected (Table 1). Most months consisted of an average of two to six available images, and only a few months had no image. Considerable cloudless images can be found in November because of the good weather. Table 1. Number of cloudless MODIS images in each month from 2000 to 2012. Month
2000
2001
2002
2003
2004
2005
2006
2007
2008
2009
2010
2011
2012
January February March April May June July August September October November December Cloudless Total
1 2 2 6 2 4 1 5 1 7 1 32 293
1 2 2 1 3 1 3 1 10 1 9 2 36 346
1 4 2 1 2 1 5 4 3 6 5 0 34 355
5 3 3 5 3 2 8 4 4 4 6 0 47 356
1 2 4 5 3 1 4 3 5 5 2 5 40 364
1 0 3 7 0 2 5 2 6 4 2 6 38 364
4 0 1 2 3 3 1 3 6 2 5 7 37 364
3 1 2 6 4 0 3 1 4 1 6 1 32 365
2 2 3 1 1 1 1 0 1 4 3 5 24 361
3 1 2 2 3 4 3 3 2 4 6 0 33 364
1 1 2 2 3 0 1 6 3 4 5 7 35 365
1 2 1 2 4 0 6 3 0 3 3 4 29 365
1 0 3 3 1 0 3 1 4 4 4 4 28 366
Remote Sens. 2015, 7
7499
Landsat Thematic Mapper (TM)/Enhanced TM Plus images (ETM+) with a resolution of 30 m were obtained from the United States Geological Survey (USGS) [57] covering the East Dongting Lake in 1993, 1996, 2002, and 2010, which were selected in the flood, normal, and dry seasons (Table 2). These images were geometrically rectified and reprojected into the same UTM coordinate as the above MODIS images. These data would be used to give an example of the role of flooding in accelerating the process of wetland evolution and vegetation succession in the Dongting Lake. Table 2. Periods, paths, rows, acquisition dates, and sources of Landsat images. Period
Path/Row
Date
Landsat
The flood season
123/40
08/17/1996 07/09/2002 08/03/2010
TM ETM+ TM
The normal season
123/40
10/04/1996 10/13/2002 10/30/2010
TM ETM+ TM
123/40
12/31/1993 12/29/2001 01/02/2010
TM ETM+ TM
The dry season
3.2. Hydrological and Meteorological Monitoring Data Average annual and monthly precipitation data during 2000 to 2012 over the study area were derived from the China Meteorological Data Sharing Service System [58], which primarily included four meteorological stations (Nanxian, Yueyang, Changde, and Yuanjiang). Average annual and monthly runoff data between 2000 and 2012 were obtained from the Sediment Bulletin of the Yangtze River [59], which involved Chenglingji hydrological station at the outlet of the Dongting Lake. 3.3. Auxiliary Data Field sampling and wetland landscape pattern data were collected as auxiliary data in this study to explore relationships between related parameters of flood regime and wetland landscape pattern. Field sampling data were accumulated in four periods (September 2010, October 2010, April 2013 and November 2013). These data were located by a handheld global positioning system (GPS) and matched to remote sensing images, which were geometrically rectified by experienced personnel who were familiar with the local field conditions. Polygon features derived from these measurements provided a qualitative assessment of the wetland vegetation conditions (such as wetland plant communities, biomass, and biodiversity). These field data would be used as the reference for combining classes into specified categories in the process of wetland classification. Wetland landscape pattern data were derived from the research of Hu et al. (2014) [60]; they developed a rule-based model to extract the spatial distribution of wetland vegetation from MODIS time-series data during 2000 to 2012 in the Dongting Lake. Hu et al. (2014) [60] verified the accuracy of the wetland landscape pattern data and obtained an overall accuracy of 83.99% and a Kappa coefficient of 0.79.
Remote Sens. 2015, 7
7500
4. Methods 4.1. Water Area Delineation Spectral index is a common method for extracting water surface from remote sensing images [61–63]. The most widely used indices include normalized difference vegetation index (NDVI) [64], normalized difference water index (NDWI) [65] and modified NDWI (MNDWI) [66]. These indices, constructed by a ratio form (NDVI, NDWI, etc.), are sensitive to aerosols and solar elevation angles. Therefore, thresholds for distinguishing water from wetlands are often extremely varied between different images, and sometimes quite differ in the same image with dissimilar distributions of aerosols and solar elevation angles [35,67,68]. When confronted with a large number of images, extensive work cannot be achieved through batch processing. A steady-state index would be very useful for resolving these problems. Hu (2009) [67] proposed such an index named floating algae index (FAI) and used this index to extract long time-series water boundaries in the Tai Lake. FAI can be calculated as follows:
FAI Rrc , nir Rrc , nir ;
(1)
Rrc , nir Rrc , red ( Rrc , swir Rrc , red ) (λ nir λ red ) / (λ swir λ red ).
(2)
where Rrc , nir is the baseline reflectance in the near-infrared band derived from a linear interpolation between red band and short-wavelength infrared band. This baseline reflectance is equivalent to making an atmospheric correction from the two bands. This study used the surface reflectance from MOD09GA/MOD09GQ instead of the Rayleigh-corrected reflectance to derive FAI. Since FAI was initially used to detect floating algae in global oceans, the effect of aerosols could be lowered by selecting cloudless images with good quality when it came to a more local inland lake. FAI can extract the water delineation with relatively uniform thresholds at spatial and temporal ranges and thus is efficient for batch-oriented processing of considerable data. Feng et al. (2012) [35] used this index combining with a gradient approach to extract the water body from MODIS data during 2000 to 2010 in the Poyang Lake with the thought of regarding the maximum gradient of FAI as the water/marshland boundary. On the basis of Feng’s research, Hu et al. (2014) [60] utilized FAI with a gradient approach of Robert [69] to derive inundation areas from MODIS images between 2000 and 2012 in the Dongting Lake and Poyang Lake. In the current study, the method used for water area delineation was guided by that of Hu et al. (2014) [60]. Figure 2 presents a schematic view of this method for water extraction.
4.2. Flood Inundation Probability Flood inundation probability was defined as the probability of a wetland pixel being inundated by flood waters during one year. The formula was as follows:
1 n f ( ) xi ~ [0, 1] n i 1
(3)
where f denotes the flood inundation probability, n is the number of images in a year, xi is the pixel value of i-th water image (0 for non-water and 1 for water) for a certain wetland pixel. This parameter
Remote Sens. 2015, 7
7501
can reflect the relative bottom topography of wetlands. Wetlands having large values of flood inundation probability are usually associated with low elevations, and vice versa.
Figure 2. Process and result of water area delineation. The following figures from left to right were MODIS image on 17 October 2012, FAI image, and water image extracted by FAI gradient method.
4.3. Duration and Start/End Date of the Annual Largest Flood The largest flood plays an important role in the spatial differentiation of wetland landscape patterns. To some extent, this phenomenon decides the outcropping vegetation type after being submerged. This study utilized daily MODIS imagery to detect the duration and start/end date of the annual greatest flood. Duration of the largest flood was defined as the longest period of continuous inundations, which was established as the time interval between the start date and end date of the annual largest flood:
d max( j i 1, x j xi 1 xi 1)
(4)
where d denotes the flood duration, i is the start date for a certain wetland pixel, and j is the end date for a certain wetland pixel. For each wetland pixel, the continuous flood periods were first recorded by water-related pixels. Second, if periods of continuous inundation were identified twice or more in a year, the longer period would be taken as the annual largest flood. Third, the duration was defined from the start and end times of the annual largest flood. These three hydro-period related variables can be achieved by programming with MATLAB. 4.4. Wetland Landscape Patterns before and after the Flood Period Changes in wetland landscape patterns can provide a comparative review of the adaptation and response of wetland plants to flooding stress, which can be observed in different phases of remote sensing images. This study made wetland classifications for several groups of MODIS images before and after the flood period to clarify the effect of floods on wetland landscape pattern in the Dongting Lake. Iterative self-organizing data analysis technique algorithm (ISODATA) was used to perform unsupervised classifications of MODIS images. We initially selected 10 classes, which would be combined into three general categories (reed, meadow, and tidal wetlands) with the help of field sampling data and expert knowledge. Reed wetlands were primarily composed of majorities of reeds and minorities of poplars, meadow wetlands mainly were consisted of carex and phalaris, and tidal
Remote Sens. 2015, 7
7502
wetlands principally comprised mudflat and water. MODIS images for classification should be selected in April (before the flood period) and October (after the flood period) with equivalent inundation areas when floods were not large and most wetland plants were in the growing season. 5. Results
5.1. Inter-Annual and Seasonal Variations in Inundation Extents Studies on spatial and temporal changes in inundation extents can enable a thorough understanding of the characteristic of expansion and recession of flood cycles at a regional scale. Only cloud-free images were selected to illustrate inter-annual and seasonal variations in inundation areas in consideration of the uneven distributions of clouds and noises. Figure 3 illustrates temporal changes in inundation areas gained from MODIS images with the lapse of day of year (DOY) between February 2000 and December 2012 in the Dongting Lake. There were significant variations in inundation extents over the period from 2000 to 2012 in Dongting Lake. Large scale floods with long durations could be observed in 2000, 2002, and 2003, with average inundation areas of 1342.0 km2, 1329.0 km2, and 1252.3 km2, respectively. The wetlands almost experienced four massive floods in each year in these years. However, relatively small scale floods occurred in 2009, 2007, 2006, and 2011, with average inundation areas of 950.7 km2, 810.8 km2, 781.7 km2, and 742.4 km2, respectively. Annual inundation areas during these years were lower than the historical average level (1051.4 km2).
Figure 3. Temporal variations in inundation areas obtained from MODIS images between February 2000 and December 2012 in the Dongting Lake. The red line indicates the mean inundation area over the period from 2000 to 2012, and the dash dotted lines denote separating lines between years.
Temporal changes in inundation extents acquired from MODIS data are accordant with annual runoff and precipitation data recorded at the Chenglingji Station (Figure 4). Annual precipitation, runoff and inundation area all experience a downward trend, with a reduction rate of 41.1 mm·year−1, 9.4 (108m3)·year−1, and 27.7 km2·year−1, respectively. Figure 5 presents the maximum (red plus blue) and minimum (red) inundation areas acquired from MODIS images in each month over the 13-year period, from 2000 to 2012. Both maximum and minimum inundation extents vary greatly from January to December. The flood period in the Dongting Lake is principally from June to September, with an average inundation area of 1508.8 km2.
Remote Sens. 2015, 7
7503
Both maximum and minimum inundation extents are large in June and July. The normal period is primarily in April, May, October, and November, with an average inundation area of 933.7 km2. The dry period is mainly in January, February, March, and December, with an average inundation area of 747.3 km2.
Figure 4. Temporal changes in annual precipitation, runoff and inundation areas acquired from MODIS data during 2000 to 2012 in the Dongting Lake. The dotted lines denote their development trends. (Precipitation: mm; Runoff: 108 m3; Inundation area: km2).
Figure 5. Variations in minimum and maximum inundation areas derived from MODIS images in each month during 2000 to 2012 in the Dongting Lake.
Remote Sens. 2015, 7
7504
Considering that the water supply in the Dongting Lake is primarily gained from precipitation and runoff, we compared the average monthly precipitation, runoff, and inundation area obtained from MODIS data in each month between 2000 and 2012 in Figure 6. Similar tendencies exist among these three observations.
Figure 6. Changes in the average monthly precipitation, runoff, and inundation areas obtained from MODIS data between 2000 and 2012 in the Dongting Lake. The error bars represent standard deviations of precipitation and runoff. (Precipitation: mm; Runoff: 108 m3; Inundation area: km2).
5.2. Flood Inundation Probability and Its Relation to Wetland Landscape Patterns The spatial distribution of flood inundation probability is helpful in identifying varying degrees of the effect of flooding on wetlands. Figure 7 shows the spatial and temporal variations in flood inundation probability of wetlands during 2000 to 2012 in the Dongting Lake. Large areas with high flood inundation probability are identified in 2000 and 2002, but relatively small areas with great flood inundation probability occurred in 2001, 2006, and 2011. The flood inundation probability also exhibits an obvious gradient distribution, which gradually decreases along the radial orientation from the lake center to the lake shore (Figure 7). Spatial overlay analyses were used to investigate the relationship between flood inundation probability and wetland landscape patterns, which can be conducted by overlaying these two groups of data layers. Figure 8 manifests the variations in average areas of reed, meadow, and tidal wetlands with the change in flood inundation probability over the period 2000 to 2012 in the Dongting Lake. Significant differences can be observed among the three wetland types with the change in flood inundation probability. Variations in reed and tidal wetlands exhibit opposite trends. Approximately 92.4% of reed wetlands have a tolerance range of flood inundation probability between 0 and 0.3, whereas approximately 88.6% of tidal wetlands present a tolerance range of flood inundation
Remote Sens. 2015, 7
7505
probability between 0.6 and 1. The flood inundation probability for meadow wetland is primarily between 0.3 and 0.6, and approximately 84.5% of meadow wetlands are distributed in this range.
Figure 7. Spatial and temporal variations in flood inundation probability during 2000 to 2012 in the Dongting Lake.
Figure 8. Variations in average areas of reed, meadow, and tidal wetlands with the change in flood inundation probability over the period from 2000 to 2012 in the Dongting Lake.
5.3. Spatial-Temporal Characteristics of the Annual Largest Flood The spatial and temporal distributions of the duration and start/end date of the annual largest flood can provide a good way to identify characteristics of the greatest inundation cycles and regions most affected by floods. Figure 9 indicates the changes in the duration and start/end date of the largest flood from 2000 to 2012 in the Dongting Lake.
Remote Sens. 2015, 7
7506
Figure 9. Spatial and temporal changes in the duration and start/end date of the largest inundation cycle from 2000 to 2012 in the Dongting Lake.
The flood duration (duration of the annual largest flood) varied among different years. Long durations were observed in 2000, 2002, 2008, 2010, and 2012, whereas short durations occurred in 2001, 2006 and 2011. These years with long or short durations of the annual largest flood appeared to be accordant with the years when the flood reached their peak points in an upward trend of inundation areas or decreased to their lowest levels in a downward trend of inundation extents. Wetlands with high flood inundation probability commonly experience long flood durations and vice versa. The start/end dates differ yearly but were consistent with each other. The start/end date of the largest flood occurred early in 2005, 2006, and 2010 but late in 2000, 2003, 2007, and 2008.
Remote Sens. 2015, 7
7507
Spatial overlay analyses were applied to clarify relationships between the three parameters (duration, start date, and end date of the largest flood) and wetland landscape patterns, which can be implemented by overlaying three groups of data layers. Figure 10 displays the variations in average areas of reed, meadow, and tidal wetlands with the change in the duration and start/end date of the greatest flood from 2000 to 2012 in the Dongting Lake. The results were summarized below.
Figure 10. Variations in average areas of reed, meadow, and tidal wetlands with the change in the duration (a); start date (b); and end date (c) of the largest flood over the period from 2000 to 2012 in the Dongting Lake.
Remote Sens. 2015, 7
7508
First, significant differences existed among various wetland types with the change in flood duration. Reed wetlands had poor water-resistance, and 87.8% of them showed a tolerance range of flood duration between one and 10 days. Meadow wetlands held better water-resistance than reed wetlands, and 78.2% of them presented a tolerance range of flood duration from five to 20 days. Tidal wetlands indicated greater water-resistance than reed and meadow wetlands, and 82.6% of them exhibited a tolerance range of flood duration between 10 and 30 days. When flood lasted over 45 days, the majority of reed and meadow wetlands would be submerged in floods, and tidal wetlands would be in the dominant position in the Dongting Lake. Second, great variations can be observed among the three wetland types with the change in the start date of the largest flood. For reed wetlands, 47.2%, 19.6%, and 23.4% of them began to experience the largest flood in DOYs of 0 to 60 (January and February), 180 to 270 (July to September), and 300 to 366 (November and October), respectively. For meadow wetlands, 17.3%, 55.5%, and 12.7% of them went through the greatest flood in DOYs of 0 to 60, 180 to 270 and 300 to 366, respectively. For tidal wetlands, 13.9%, 49.7%, and 20.3% of them experienced the largest flood in DOYs of 0 to 60, 180 to 270 and 300 to 366, respectively. A large amount of wetland vegetation suffered the greatest inundation during July to September (DOYs 180 to 270), especially in July (DOYs 180 to 210). This period was the universal flood period and the main growing season of wetland vegetation in the Dongting Lake, which would exert significant influence on wetland landscape patterns. Specifically, 12.2% of reed wetlands, 30.4% of meadow wetlands and 27.3% of tidal wetlands experienced the largest flood in July. Third, profound changes can be determined among wetlands with the change in the end date of the greatest flood. For floods that lasted two to three days at least, and one to two months at most, some differences existed in the influence of the start/end date of the largest flood on wetland landscape pattern. Statistics for the end date of the greatest flood were based on the same time ranges as the start date of the largest inundation. For reed wetlands, 46.3%, 19.4%, and 23.6% had the greatest flooding ending in in DOYs of 0 to 60, 180 to 270, and 300 to 366, respectively. For meadow wetlands, 18.4%, 51.9%, and 13.5% of them concluded their largest flood in DOYs of 0 to 60, 180 to 270, and 300 to366, respectively. For tidal wetlands, 14.7%, 46.7%, and 24.7% of them completed the greatest flood in DOYs of 0 to 60, 180 to 270, and 300 to 366, respectively. A great deal of wetland vegetation ended the largest inundation during July to October (DOYs 180 to 300), especially in August (DOYs 210 to 240), in which 7.0% of reed wetlands, 23.9% of meadow wetlands, and 18.4% of tidal wetlands ended the greatest flood. Proportionate areas of the three wetland types ending the largest flood from July to September were less than those starting the greatest flood at the same time. By contrast, the proportions of areas of wetlands ending the largest flood in November and December were more than those starting the greatest flood at the same time. Such a difference was probably the result of time lag caused by the continued flooding. 5.4. Spatial-Temporal Correlations between Flood Regimes and Wetland Landscape Patterns Correlation analyses were conducted to explore relationships between parameters associated with flood regime and wetland landscape patterns from 2000 to 2012. Such approach would provide an effective way to illustrate the impact of flooding on wetland vegetation and to identify the areas that
Remote Sens. 2015, 7
7509
are most affected by floods. The formula for calculating the correlation coefficient between flood inundation probability and wetland landscape pattern is as follows: r
( F F )(W W ) ( F F ) (W W ) i
i
2
i
2
(5)
i
where Fi indicates the flood inundation probability in i-th year, Wi denotes a certain wetland landscape in i-th year, F and W present the average values of flood inundation probability and wetland landscape over the period from 2000 to 2012, respectively. The correlation coefficient between flood duration and wetland landscape pattern can be obtained through this formula as well. All these input parameters should be normalized before the calculation. Generally, |r| ≥ 0.8 was considered to indicate a highly significant correlation, 0.5 ≤ |r|