Nov 11, 2013 - KEY WORDS: Visualization, Mobile Mapping, Laser scanning, Point Cloud, Segmentation, Classification, Multi-Layer, Parallax. Scrolling.
ISPRS Annals of the Photogrammetry, Remote Sensing and Spatial Information Sciences, Volume II-5/W2, 2013 ISPRS Workshop Laser Scanning 2013, 11 – 13 November 2013, Antalya, Turkey
MULTI-LAYER VISUALIZATION OF MOBILE MAPPING DATA
D. Eggert, M. Sester
Institute of Cartography and Geoinformatics, Leibniz Universität Hannover, Germany (eggert, sester)@ikg.uni-hannover.de
KEY WORDS: Visualization, Mobile Mapping, Laser scanning, Point Cloud, Segmentation, Classification, Multi-Layer, Parallax Scrolling
ABSTRACT: Data acquisition via Mobile Mapping systems generates a huge amount of LiDAR as well as image data. Depending on the final application various different visualization schemes are conceivable. This paper presents a multi-layer based visualization method, enabling fast data browsing of mobile mapping data. In contrast to systems like Google Street View the proposed visualization does not base on 360° panoramas, but on colored point clouds projected on partially translucent images. Those images are rendered as overlapping textures, preserving the depth of the recorded data and still enabling fast rendering on any kind of platform. Furthermore the proposed visualization allows the user to inspect the mobile mapping data in a panoramic fashion with an immersive depth illusion using the parallax scrolling technic.
1. INTRODUCTION Visiting remote locations navigating from panoramic bubble to bubble is a very immersive experience. Systems like Google Street View (Vincent, 2007) and Bing Maps Streetside have successfully implemented this, enabling the user to virtually visit almost every place on earth. The advent of highly accurate mobile mapping systems recording much more than only panorama images, demands a redesign away from bubble based images to a visualization making use of entire recorded data. The first shortcoming of the existing systems is the limitation of the possible viewpoints. While the user might pan and zoom inside a bubble, it is still impossible to get a different view angle other than the images provide. This was first addressed by a system called Street Slide (Kopf, 2010). The system constructs and dynamically renders a multi-perspective panorama. Instead of jumping from bubble to bubble the user gets a continuous stream of multiple panoramas stitched together. While working nicely within the façade plane, objects closer to the point of recording, like cars or trees, are highly distorted. Even background objects, like mountains or the sun appear on several image strips, making the visualization less immersive.
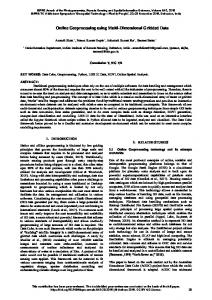
the mobile mapping data. First of all this value is represented by the dense and georeferenced 3D vertex data. So how can this kind of data be included into a merely flat visualization, or how to include the depth information, provided by the vertex data, into this kind of view? In order to address this question we analyzed past visualization schemes from the time before hardware acceleration made 3D visualizations possible on every average personal computer. Taking a closer look at 2D jump and run games for instance like Nintendo’s Super Mario, shows that those game engines also create an illusion of depth. This illusion is created by multiple translucent layers rendered in front of each other, what is called parallax scrolling. While the games protagonist moves from one side of the screen to the other the different layers are shifted differently. The further the layer is in the background the less it is shifted to either side. This kind of layered 2D visualization is still used in applications that does not require full 3D visualizations like many games designed for mobile devices, e.g. Angry Birds from Figure 1.
The foundations of the discussed systems are basically images with all their advantages and disadvantages. Emerging mobile mapping systems however introduce a combination of images and highly dense and accurate LiDAR data. Unfortunately presenting the entire mobile mapping data consisting of terabytes of vertex and image data to many users is very demanding and not yet feasible in a bigger scope. This research though addresses the question of presenting the massive mobile mapping data in the fashion of existing systems like Street View and thus adding additional value gained from Figure 1. Depth illusion with layers (angry birds example)
This contribution has been peer-reviewed. The double-blind peer-review was conducted on the basis of the full paper. doi:10.5194/isprsannals-II-5-W2-73-2013
73
ISPRS Annals of the Photogrammetry, Remote Sensing and Spatial Information Sciences, Volume II-5/W2, 2013 ISPRS Workshop Laser Scanning 2013, 11 – 13 November 2013, Antalya, Turkey The focus of this paper is to derive such a layered visualization from the available mobile mapping data, providing a more immersive view to the user by adding this particular depth illusion. 2. RELATED WORK The handling of huge amounts of mobile mapping data has recently been addressed by various publications. One of the major fields of research is the fusion of the different sensor data. First of all the recorded vertex data has to be georeferenced which is done by fusing the LiDAR measurements with the recorded IMU/GPS track. Afterwards the RGB colors of the vertices are determined. Both are simple transformation steps. Yet, the color determination might raise some problems. Depending on the camera and laser scanner orientation the problem of objects occluding other objects occur. However, this is addressed by (Hammoudi, 2012a) and (Hammoudi, 2012b) within the scope of mobile mapping systems by generating occlusion masks for each image. Based on these masks the RGB color is only extracted from images where the corresponding vertex is not occluded. Unfortunately this might lead to a situation where no image is found for extracting the color. The color of single vertices might be easily interpolated by those of the surrounding ones. Simple interpolation though is not feasible at bigger uncolored areas. In such cases the missing color can be synthetically generated as described in (Stahlhut, 2005). Extracting the color of neighboring vertices from different images generates another problem. Even though captured by the very same camera subsequent images are subject to vary in brightness and contrast. Images from different camera and different angles even increase this deviation. This results in visible color transitions of neighboring vertices. (El-Hakim, 1998) solves this by a global least square adjustment of the image brightness. Having a naturally colored point cloud, the creation of texture representations of vertices remains to be addressed. (Wahl, 2005) presents an approach of identifying planes within point clouds and creating texture representations of those detected planes. The position and orientation of the identified planes however might be arbitrary, while in our case the identified planes or layers have to be more or less parallel to the vehicles track. Rendering multiple transparent textures is also not a trivial task. Rendering scenes is usually done object by object. In order to get the scene correctly rendered, the order of the rendered objects has to be taken into account. Basically the background objects have to be rendered first and subsequently all closer objects. In this scope closer means closer towards the virtual camera, being the core of the problem. The order in which the different objects are rendered depends on the camera and is subject to change anytime the camera position changes. (Shade, 1998) firstly mentioned this problem as “layered depth images”, while (Everitt, 2001) firstly addressed it in the scope of modern graphic pipelines as “order-independent transparency rendering”. Multiple approaches regarding this problem had been proposed. (Bavoil, 2008) for instance introduced an algorithm called dual depth peeling, while (Everitt, 2006) proposing an algorithm which partially removes already rendered pixels based on previously generated depth layers database. The problem of order-independent transparency rendering however is only relevant in case the generated multilayered model will be rendered as a 3D scene. Rendering the model in a pure 2D fashion overcomes the problem entirely.
3. MOBILE MAPPING SYSTEM The used mobile mapping system is the Riegl VMX-250. It consists of 2 VQ-250 laser scanners providing 360° profiles at a measurement rate of 300,000 measurements per second each. In addition to the IMU/GNSS equipment the system includes 2 Riegl VMX-250-CS6 as well as 2 Nikon D700 cameras. The image resolution ranges from 5MP for the CS6 cameras and 12MP for the Nikons. As shown in Figure 2 the entire system is mounted on the rooftop of the acquisition vehicle.
Figure 2. Riegl VMX-250 mobile mapping system 4. PREPROCESSING The data acquired by the mobile mapping system includes the LiDAR measurements from the laser scanners, the vehicles track from the IMU/GNSS sensor and finally the pictures captured by the 4 cameras. All data is accurately time stamped and can be fused based on the individual timestamp of each record. Integrating all three data types results in a georeferenced colored point cloud. 4.1 Tiling Considering the measurement rate of 600,000 points per second the resulting point cloud is very dense and demands a high memory capacity. In order to face these demands the point cloud is divided into equally sized tiles. A tile size of 25x25 m² was found to be the best trade-off between number of tiles and number of points per tile.
Figure 3. Tiled point cloud dataset and vehicle track
This contribution has been peer-reviewed. The double-blind peer-review was conducted on the basis of the full paper. doi:10.5194/isprsannals-II-5-W2-73-2013
74
ISPRS Annals of the Photogrammetry, Remote Sensing and Spatial Information Sciences, Volume II-5/W2, 2013 ISPRS Workshop Laser Scanning 2013, 11 – 13 November 2013, Antalya, Turkey The resulting tiles usually contain a maximum number of 2 million points per tile. Figure 3 shows a tiled dataset acquired in the urban area of Hanover, Germany. While the translucent blue squares represent the recorded point cloud tiles the red line shows the track driven during the data acquisition.
or building are considered potential occluders and thus projected into the occlusion masks. Finally the masks are morphologically closed, creating a more reliable occlusion mask. Figure 5 illustrates this with a car occluding the building façade (left) and the resulting occlusion mask (right).
Having now a manageable tiled datastructure, all subsequent processing steps are based on individual or multiple tiles. The further workflow includes vertex normal calculation and various segmentation and classification steps. The classification builds the foundation for identifying occluding objects and the corresponding occlusion masks. Furthermore the layer identification described in section 5.1 can find relevant layers based on the classified points, e.g. include only vertices belonging to a façade or building. Finally the classification can be used to create a different colored layer representation, e.g. object based colored. 4.2 Segmentation and classification In order to support various visualization modes, e.g. façades only, the point cloud is segmented and classified into predefined object types. The segmentation approach is very easy. First the ground is removed. This is done via region growing all vertices with an almost vertical normal. As seed region a previous defined percentage, e.g. 5%, of the vertices with the smallest height is used. Having the ground removed all remaining objects can again be segmented by region growing, since they aren’t connected by the ground. The now separated object point clouds can be classified, into e.g. buildings, trees, cars, etc. For a more reliable building classification we included cadastral data into the algorithm. Figure 4 shows the segmentation and classification result. While the green colored vertices represent the ground, red colored vertices belong to buildings and all remaining vertices are considered potential occluding vertices and colored blue.
Figure 5. Car occluding a building façade (left) and corresponding occlusion mask (right) Utilizing the generated occlusion masks all vertices are colored based on the RGB pixel color of the vertex projected into the image. 5. MULTI-LAYER GENERATION After the preprocessing the desired point cloud visualization can be generated. The range of possible visualization scheme range from plain map-like representations to full three dimensional point cloud rendering. The visualization described in the following will render transparent vertical layers as ordinary textured rectangles. 5.1 Layer Identification The first step in generating the desired layer textures is to identify the vertical main layers within the point cloud. For a proper visualization only layers almost parallel to the vehicles track shall be considered. In order to identify those layers algorithms like RANSAC described in (Fischler, 1981) or Hough-Transformation (Hough, 1962) can be applied to a 2D representation of the vertices like shown in Figure 6. As mentioned earlier, relevant layers might also be identified in the classified point cloud by searching for façades in the vertices classified as building. Moreover layers can be derived from various classes assigned in the classification step. Layer and class correspondence might be: • • • •
Figure 4. Classified point cloud - ground (green) - building (red) - occluders (blue) 4.3 Vertex coloring As mentioned above the building façades are often subject to occlusion. This problem is addressed by creating occlusion masks for all images based on the segmented and classified point cloud. Therefore all vertices not belonging to either street
layer 1: cars, pedestrians, street furniture, … layer 2: building/facades layer 3: background horizontal layer: ground
Finally the layers might also be manually defined as a semiautomatic approach. Figure 6 shows three identified layers (red) which satisfy the parallel (in respect to the track) condition. Once the layers have been identified for the area of interest, e.g. a single tile or a particular track segment, the texture representations will be generated.
This contribution has been peer-reviewed. The double-blind peer-review was conducted on the basis of the full paper. doi:10.5194/isprsannals-II-5-W2-73-2013
75
ISPRS Annals of the Photogrammetry, Remote Sensing and Spatial Information Sciences, Volume II-5/W2, 2013 ISPRS Workshop Laser Scanning 2013, 11 – 13 November 2013, Antalya, Turkey therefore left transparent. Our implementation skipped all triangles which real world bounding box edges exceed 0.2 meters. This creates genuine object outlines, especially in the non-façade layers, like shown in Figure 8 (bottom).
α α
β β
Figure 6. Track (green) and identified layers (red) 5.2 Texture generation For each layer a series of textured rectangles is generated. Therefore all relevant vertices will projected on the plane representing the layer. However, first the size of the resulting layer rectangle has to be defined. In this case size does not define the resolution of the final texture image, but rather the extension of the covered area in meters. This might be a fixed value, or dynamically derived from the track or the identified layers. We used a fixed size 𝑠 of 20 meters. Based on this value the track is then generalized into segments of length 𝑠. At this point the track segments as well as the layer represent two opposite borders of the area of relevant vertices. In order to close the desired polygon buffer the angle bisectors of the previous and subsequent buffers are used. At the start as well at the end of the track perpendicular lines are used. Figure 7 visualizes the resulting buffer (green) outlined by the track (black), the layer (red) and the angle bisectors. Finally all vertices within this buffer are projected onto the layer plane. Texture pixels not covered by projected vertex pixels are set transparent. This way all texture images are generated, while the layers closer to the track have to be generated first, since the buffer of the layers further away include the closer ones. Furthermore a vertex already projected onto a texture will not be projected onto another layer, even though it might be contained in the corresponding buffer. Depending on the number of projected vertices and the texture resolution the resulting texture images might be very sparse. In order to get a denser image the color in between the projected vertex pixels is interpolated. Therefore the pixels are triangulated using a Delaunay triangulation. Finally the color of each pixel within a triangle is interpolated according the known color of the pixels building the triangle. However this will fill the entire convex hull of the projected vertex pixels. Since the model is built of multiple overlapping transparent textures, filling the complete convex hull will produce unnatural shaped objects and hide contents of background layers. Figure 8 (top) illustrates this problem. In order to maintain the object’s shape and leave most of the texture transparent to see the background layers a triangle size threshold is introduced. The color of triangles exceeding this threshold will not be interpolated and
Figure 7. Buffer and texture image generation (top down view)
Figure 8. Color interpolation - entire convex hull (top) - triangle size treshold (bottom)
5.3 Results We applied the described procedure to the mobile mapping dataset shown in Figure 3. A 500m track segment was used. The track segment covered 45 tiles containing about 31 million vertices. The desired layers were manually defined at 5, 10 and 20 meters distance from the track. The 500m track consisting of
This contribution has been peer-reviewed. The double-blind peer-review was conducted on the basis of the full paper. doi:10.5194/isprsannals-II-5-W2-73-2013
76
ISPRS Annals of the Photogrammetry, Remote Sensing and Spatial Information Sciences, Volume II-5/W2, 2013 ISPRS Workshop Laser Scanning 2013, 11 – 13 November 2013, Antalya, Turkey 20,000 positions is generalized into 20m long segments, so the number of track positions is cut down to 26. The resulting multi-layered model consists of 75 textured quads with an overall file size of about 7MB at a texture width of 1024 pixels. The overall file size of the original 45 tiles was about 350MB. The achieved compression is about 98%. In order to compress the vertex data even more, the texture width might be lowered or the track segment size might be raised. Both of course result in a decreased visualization quality. A panoramic overview of the generated dataset shows Figure 11. In contrast Figure 9 and Figure 10 show a generated model based on only two layers with a track segment length (area covered by one textured quad) of about 100m. The runtime performance of the proposed layered model generation process is also considerably high. A Java implementation generating 75 textured quads from the 31 million vertices of the 500m long track segment took merely 4 minutes on an average workstation. Still the most time consuming part represents the color interpolation within the created Delaunay triangulation, which, of course, highly depends on the chosen texture resolution. The higher the resolution, the more pixel colors have to be interpolated, leading to increased memory and runtime requirements. Either way the generated models can be rendered at maximum frame rates even on older graphics hardware or mobile and webbased platforms. In order to render the model as a three dimensional scene the order-independent transparency problem (see end of section 2) has to be addressed. Therefore all textures are sorted according their distance to the track, which is also used as the virtual camera position. This guarantees a correctly rendered transparency without reordering the textures at each change of the camera’s position.
Figure 9. 2 layer model - front view
Figure 10. 2 layer model - tilted view 6.
CONCLUSION AND FUTURE WORK
This paper proposes a multi-layer visualization approach for dense mobile mapping data. The generation of the layered model includes preprocessing steps like the tiled datastructure, vertex coloring, the generation of vertex normals as well as point cloud segmentation and classification. The actual model generation includes the identification of vertical layers within the point cloud where different approaches were proposed as well as a polygon buffer based vertex to texture projection. The resulting multi-layer model can be considered a highly compressed representation of the original mobile mapping point cloud. With a compression rate of about 98 percent the generated model is best suitable for fast data browsing as well as preview visualizations of the recorded mobile mapping data. Furthermore this also enables less powerful machines along with web-based visualization clients to render the resulting model. Furthermore the layer model might be rendered as a 3D scene as shown in the example images, or as a pure 2D visualization in the fashion of the previously mentioned parallax scrolling jump and run game engines. The future work includes the integration of the color adaption and the generation of synthetic texture parts of highly occluded façade areas in order to create even more realistic vertex and therefore texture colors. Extending the coloring beyond photorealistic colors towards non-photorealistic schemes is also subject of our further research. Finally the layer identification will be extended towards methods proposed in section 5.1.
Figure 11. Multi-layer visualization – top view (top) – panoramic front view (bottom) This contribution has been peer-reviewed. The double-blind peer-review was conducted on the basis of the full paper. doi:10.5194/isprsannals-II-5-W2-73-2013
77
ISPRS Annals of the Photogrammetry, Remote Sensing and Spatial Information Sciences, Volume II-5/W2, 2013 ISPRS Workshop Laser Scanning 2013, 11 – 13 November 2013, Antalya, Turkey 7. REFERENCES Bavoil, L., Myers, K., 2008. Order independent transparency with dual depth peeling, NVIDIA OpenGL SDK. El-Hakim, S. F., Brenner, C., Roth, G., 1998. A multi-sensor approach to creating accurate virtual environments, ISPRS journal of photogrammetry and remote sensing, 53(6), 379-391. Everitt, C. W., 2001. Interactive order-independent transparency. White paper, nVIDIA, 2(6), 7. Everitt, C. W., Bastos, R. M., Kilgard, M. J., 2006. Orderindependent transparency rendering system and method - U.S. Patent No. 6,989,840, Washington, DC: U.S. Patent and Trademark Office. Fischler, M. A., Bolles, R. C., 1981. Random sample consensus: a paradigm for model fitting with applications to image analysis and automated cartography, Communications of the ACM, 24(6), 381-395. Hammoudi, K., Dornaika, F., Soheilian, B., Vallet, B., McDonald, J., Paparoditis, N., 2012a. Recovering OcclusionFree Textured 3D Maps of Urban Facades by a Synergistic Use of Terrestrial Images, 3D Point Clouds and Area-Based Information, Procedia Engineering, 41, 971-980. Hammoudi, K., Dornaika, F., Soheilian, B., Vallet, B., McDonald, J., Paparoditis, N., 2012b. Recovering quasi-real occlusion-free textures for facade models by exploiting fusion of image and laser street data and image inpainting, In Image Analysis for Multimedia Interactive Services (WIAMIS), 2012 13th International Workshop on (pp. 1-4). IEEE. Hough, P. V., 1962. Method and Means for Recognizing complex Patterns - U.S. Patent No. 3,069,654, Washington, DC: U.S. Patent and Trademark Office. Kopf, J., Chen, B., Szeliski, R., Cohen, M., 2010. Street slide: browsing street level imagery, ACM Transactions on Graphics (TOG), 29(4), 96. Shade, J., Gortler, S., He, L. W., Szeliski, R., 1998. Layered depth images, In Proceedings of the 25th annual conference on Computer graphics and interactive techniques (pp. 231-242). ACM. Stahlhut, O., 2005. Extending natural textures with multi-scale synthesis, Graphical models, 67(6), 496-517. Vincent, L., 2007. Taking online maps down to street level, Computer, 40(12), 118-120. Wahl, R., Guthe, M., Klein, R., 2005. Identifying planes in point-clouds for efficient hybrid rendering, In The 13th Pacific Conference on Computer Graphics and Applications (pp. 1-8).
This contribution has been peer-reviewed. The double-blind peer-review was conducted on the basis of the full paper. doi:10.5194/isprsannals-II-5-W2-73-2013
78