Accepted Manuscript Title: Multicomponent and multi-dimensional modeling and simulation of adsorption-based carbon dioxide separation Authors: R. Ben-Mansour, M. Basha, N.A.A. Qasem PII: DOI: Reference:
S0098-1354(17)30049-2 http://dx.doi.org/doi:10.1016/j.compchemeng.2017.01.040 CACE 5696
To appear in:
Computers and Chemical Engineering
Received date: Revised date: Accepted date:
20-6-2016 11-1-2017 20-1-2017
Please cite this article as: R. Ben-Mansour, M. Basha, N.A.A. Qasem, Multicomponent and multi-dimensional modeling and simulation of adsorption-based carbon dioxide separation, Computers & Chemical Engineering, Volume 99, 6 April 2017, Pages 255-270. http://dx.doi.org/10.1016/j.compchemeng.2017.01.040
This is a PDF file of an unedited manuscript that has been accepted for publication. As a service to our customers we are providing this early version of the manuscript. The manuscript will undergo copyediting, typesetting, and review of the resulting proof before it is published in its final form. Please note that during the production process errors may be discovered which could affect the content, and all legal disclaimers that apply to the journal pertain.
Multicomponent and multi-dimensional modeling and simulation of
adsorption-based carbon dioxide separation
R. Ben-Mansour*, M. Basha, and N. A. A. Qasem
Mechanical Engineering Department, KFUPM
Dhahran, Saudi Arabia 31261
(*) Corresponding author: R. Ben-Mansour, email:
[email protected]
1
Highlights New developed two-dimensional-transient adsorption model and code applied for CO2 separation from flue gas. The model is coded as AnsysFluent User Defined Functions (UDFs) The developed code could handle any number of species in a gas mixture. Different configurations and dimensions of a fixed bed column could be modeled by the code. Different aspect ratio and taper shaped of the adsorbent bed have been investigated to see their effect on the CO2 separation performance. Pressure swing adsorption cycle has been simulated.
ABSTRACT A two-dimensional transient numerical study of the adsorption of CO2/N2 and CO2/H2 mixtures on activated carbon and MOF-177 in a fixed bed is presented. Because most of the commercial CFD codes are not capable of simulating adsorption processes in a straightforward fashion, we developed an additional code to solve for the different species transport including adsorption and diffusion and used Fluent to simulate the adsorption process, fluid flow, heat and, mass transfer. We simulated the adsorption process at high temperature-low pressure and low temperature-high pressure conditions as well as the pressure swing adsorption. For adsorption of CO2/N2 and CO2/H2 mixtures, Toth and Viral models are used calculate equilibrium isotherms. The breakthrough curves obtained from the simulations compare well with the experimental data. Moreover, the effects of aspect ratio and geometric shapes were studied. The results show that varying the bed aspect ratio from 7.77 to 2 has an insignificant effect on the adsorption capacity and performance. Keywords: adsorption, carbon capture, carbon-dioxide, separation, activated carbon, MOFs.
2
Nomenclature 𝐶
Concentration, mol/m3
𝑦
mole fraction
𝑞
adsorption rate, mol/kg
𝑙
wall thickness, m
𝑥, 𝑟
coordinates directions
u
velocity in axial direction , m/s
w
velocity in radial direction, m/s
𝑡
time, s
𝑘, 𝜆
thermal conductivity, W/m K
𝑇
temperature, K
𝑝
pressure, Pa
𝑅
universal gas constant, J/mol K
ℎ𝑤
heat transfer coefficient between the gas and the reactor wall, W/m2 K
ℎ𝑓
fluid heat transfer coefficient, W/m2 K
𝐶𝑝
specific heat capacity, J/kg K
𝐷
diffusion (dispersion) coefficient, m2/s
𝐿
length, m
𝜌
density, kg/m3
𝜇
viscosity, kg/m s
𝜀
void fraction
Δ𝐻
heat of adsorption, j/ mol
𝑑
diameter, m
𝐾𝑙
mass transfer coefficient, 1/s
𝐾0
constant, 1/Pa
𝑛
adsorption constant
3
Subscript 𝐶𝑂2 , 𝑁2
Carbon dioxide, nitrogen gas
𝑝
particle, constant pressure
𝑖
gas species index
𝑔
gas
𝑠
solid
𝑣
constant volume
𝑤
wall
𝑖𝑛
inlet
𝑖𝑛𝑡
internal
1. INTRODUCTION The emissions from the combustion of fossil fuel, coal, wood, etc. (from either power generation plants or from engine exhaust) mainly contain CO2 and N2. Removal of CO2 from flue gas is necessary to reduce the CO2 level in the atmosphere and to abide by the stringent environmental emission norms. Apart from heavy industrial application of hydrogen (hydrogen cracking, food processing, packing, etc.), recent developments on the use of hydrogen for combustion for mobile applications and energy conversion have promoted further research on the purification and storage of hydrogen [1-3] for use as an alternate resource for combustion to reduce CO2 emissions. CO2, H2, and N2 can be separated by cyclic adsorption and desorption using pressure swing adsorption (PSA) and temperature swing adsorption (TSA) columns [4]. Several experimental and numerical studies addressing the separation and purification of CO2, H2, N2, etc., via an adsorption process can be found in the literature [1-20]. The physical process of pressure and temperature swing adsorption is explained in detail in refs. [16, 19]. Several researchers have conducted experimental and numerical studies to explore the intrinsic CO2 and N2 adsorption phenomenon on various adsorbents [13, 16] for various critical parameters, including temperature, operating pressure, feed concentrations, initial bed concentration, adsorption equilibrium models, etc. In an earlier research study, Hwang et. al 4
[14] developed a mathematical 1D model of a fixed bed adsorption system for bulk gas adsorption on activated carbon. This model used temperature-dependent Langmuir isotherms along with non-adiabatic and non-isothermal thermal boundary conditions. The results from the model were very well validated against their in-house experiments. Numerical simulations of VPSA and PSA of multi-component gases (binary H2-CO2, ternary H2-CO2-CO and five component H2-CO2-CO-CH4-N2) on activated carbon extrudes were conducted by Lopes et. al [17]. The results showed that the use of single-component adsorption equilibrium isotherms had successfully helped in prediction of the adsorption behavior of the multi-component gases during breakthrough and PSA modeling. Adsorption of CO2/CH4 on activated carbon at high pressure was studied by Grande et. al [13]. This study used the multi-site Langmuir, Virial, and Sips models to fit pure adsorption equilibrium data to obtain multi-component equilibrium data. Simulation of Multi-bed VPSA for CO2 capture form flue gases was studied by Liu et. al [16]. In this study, three configurations, namely two, three and four beds with Zeolite 5A, for different process cycles were conducted. They concluded that a multi-bed approach can raise the efficiency of the adsorption process. Dantas et. al [8] conducted experiments and performed modeling of fixed bed adsorption of CO2 form flue gases. The linear driving force model was used to predict adsorption kinetics at different temperature and pressure conditions using activated carbon. It was concluded that activated carbon has high selectivity for CO2. In another study, Dantas et. al [10] simulated the fixed-bed adsorption of carbon dioxide and a carbon dioxide–nitrogen mixture on zeolite 13X. This study also showed that the linear driving force model can predict acceptable adsorption kinetics at different temperature and pressure conditions. Casas et. al [6] conducted comprehensive experimental and simulation studies of fixed-bed adsorption of a CO2/H2 mixture on activated carbon. The Sips and Langmuir model was used to fit the adsorption data, and simulations were conducted at various temperatures and pressures ranging from 20 to 100 oC and 1 to 35 bars, respectively. A robust numerical model for the simulation of the pressure swing adsorption process with a strong adsorbate of CO2 was presented by Chang et. al [7]. This study outlined the detailed equations with dimensional analysis of various mass transfer models used in the adsorption simulation, namely the isothermal local equilibrium model, the isothermal linear driving force model, and the non-isothermal linear driving force model. The fundamental principles of fast-cycling PSA for H2 purification from a binary mixture of H2 and CO2 were presented by Lopes et. al [1]. Their experiment used a single 5
rapid vacuum PSA with fast cyclic sequence of 5-steps in a fixed-bed with activated carbon. The results revealed that 61.8% of hydrogen was recovered with a purity of > 99.99%. Two versions of mathematical models for the adsorption process of hydrogen from a multicomponent mixture by pressure swing adsorption were presented by Ribeiro et. al [2]. An experimental and simulation study of hybrid VPSA of carbon dioxide on Zeolite 13X was presented by Wang et. al [18]. Adsorption equilibrium data obtained from their experiment were fitted to a multi-site Langmuir model. A binary linear driving force mass transfer model was used in a breakthrough simulation to predict the adsorption kinetics. Delgado [21, 22] described a mathematical model to describe the adsorption separation of CO2 from binary gas mixtures (CO2-N2, CO2-He and CO2-CH4) on sepiolite, silicate pellets and a resin. He used the LDF approximation model for mass transfer and PDECOL as the software tool for modeling. Shafeeyan et. al [23] reviewed different existing mathematical modeling methods of the fixed-bed adsorption of carbon dioxide. Shendalman and Mitchell [24] obtained a linear mathematical model using the characteristic method while developing a mathematical model to describe Pressure Swing Adsorption separation of CO2 from a binary gas mixture of carbon dioxide and helium (CO2-He). Cen and Yang [25] obtained a mathematical model to describe Pressure Swing Adsorption separation of CO2 and other gaseous products of coal gasification. The flow pattern was described using the plug flow model, while the mass transfer pattern was described using the local equilibrium model and the Linear Driving Force (LDF) approximation model. An empirical relationship was used for the determination of the mass transfer coefficient for CO2. A mathematical model was developed by Raghavan and Hassan [26] to describe Pressure Swing Adsorption separation of CO2 from a binary gas mixture of carbon dioxide and helium (CO2-He). The flow pattern was described using the axial dispersed plug flow model, while the mass transfer pattern was described using the LDF approximation model. Furthermore, a mathematical model that describes Pressure Swing Adsorption separation of CO2 from a gas mixture of carbon dioxide (CO2) and methane (CH4) was developed by Kapoor and Yang [27]. A Langmuir equilibrium isotherm was assumed. The results provided by the model were found to be very close to the experimental data used, within an approximately 3% margin of error [23]. Cavenati and Grande [28] developed a mathematical model to describe the adsorption separation of a gas mixture of carbon dioxide (CO2) and methane (CH4) on a Tekada carbon molecular sieve via Vacuum Swing and Pressure Swing (VSA-PSA). The study relied on gPROMS software for performing the simulation. Recently researchers at IFPEN have published reviews on their 3D CFD code which has been developed to handle complex 6
problems in the oil and gas and industry [29] and processes involving adsorption and desorption [30]. The majority of numerical research has used a simplified one-dimensional (1D) model in their studies, in conjunction with various critical assumptions [31]. Moreover, these models can only be applied to a long cylindrical fixed bed column. If these adsorption systems are to be adapted to confined spaces in mobile applications, then multi-dimensional modeling is required to model the process. The main objective of the present research is to develop a multi-dimensional, multispecies, transient adsorption computational model capable of performing a simulation of gas adsorption-separation and gas-adsorption storage for realistic feed gas mixtures, such as N2/CO2/H2O exhaust gases under different operating flow and temperature conditions. Because most commercial computational fluid dynamic codes (Fluent, CFX, etc.) do not offer this capability, the objective has been realized by developing a set of add-on user defined functions (UDFs) and scalar (UDS) transport equations to simulate the binary mixture adsorption process, accounting for the following: molar concentrations and locally averaged absorbed concentrations of CO2, N2 and H2, as well as heat transfer in the fluid and porous fixed bed for any given column geometry under different operating conditions. A twodimensional (2D) transient numerical study on the adsorption of CO2/N2 and CO2/H2 mixtures on activated carbon in a fixed bed using the newly developed model was performed, and the numerical results were validated against the experimental data of reference [8]. In addition, we consider the adsorption process for a new adsorbent material named MOF177 after extending the model used in reference [15, 32] and originally developed by da Silva [33]. In the present study, two extreme sets of feed boundary conditions are considered: high pressure and low temperature feed, and low pressure and high temperature feed. In addition, adiabatic and non-adiabatic column wall boundary conditions are considered. The Toth and Viral models are used calculate equilibrium isotherms of CO2/N2 and CO2/H2 mixtures. A full cycle of pressure swing adsorption is also involved.
2. MATHEMATICAL MODELING A set of equations that governs the adsorption process is presented in Table 1 and Table 2. The original one-dimensional transient models were developed by two research teams. The first set of equation corresponds to the models used by Dantas et. al [32] and originally developed by da Silva in his PhD thesis and later published in reference [33]. This 7
model is more comprehensive and accounts for the energy transport and the heat transfer. The second model case (Krishna and Long [15]) focuses only on the adsorption assuming isothermal medium. We selected these two cases to validate our model and to investigate the differences in the adsorption process for two materials relevant for CO2 separation. In the first case, activated carbon is used, and in the second case, MOF177, a newly developed adsorbent with superior adsorption capacity, is used. In this investigation, we extended the models by treating two-dimensional behavior instead of one-dimensional behavior. In addition, we incorporated the energy transport in the Krishna and Long model because it is important to consider the heat of adsorption and hence the temperature rise and variation in the bed.
For both cases, the following assumptions are adopted: the gas phase obeys ideal gas law, the flow is unsteady and laminar, the porous media is homogenous, the physical properties of the adsorbent are constant, and the Linear Driving Force (LDF) model is used to account for the mass transfer rate during the adsorption process.
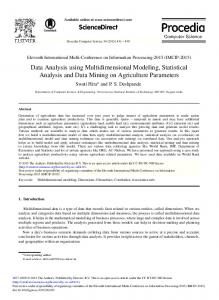
Computational Methodology The present study considers a fixed bed column filled with activated carbon. Figure 1 shows the schematics of the computational domains used for all cases. The computational domain shown in Fig. 1 is discretized non-uniformly with a grid size of 60×300 and with high resolution at the wall, inlet and outlet; the computational domain is deemed to give refined results. This grid was established from the results of a mesh independence study.
Laminar fluid flow in porous activated carbon is simulated using Ansys Fluent builtin solver [34]. Other transport equations, such as CO2 and N2 concentrations, gas temperature, porous bed temperature and average mass transfer to the adsorbent particles, are solved using user defined scalars (UDS) together with user defined functions and Memories (UDFs & UDMs) in the Ansys Fluent utility. Altogether, the study uses 7 UDSs along with 14 UDMs to simulate the adsorption phenomenon for case 1 and 4 UDFs and 12 UDMs for case 2. 8
A simple algorithm is used to link pressure and velocity. First-order discretization schemes are used to estimate the flow variables. Convergence criteria for all variables are set to 10-9. The bed dimension and the material properties used in the simulation are from refs. [8, 15] and are presented in Tables 3 and 4. Boundary and initial conditions For case 1, two inlet gas temperatures are 373 K and 423 K at atmospheric pressure, while for case 2, the outlet pressures are 50 bars at room temperature, as per the boundary conditions in references [8, 15]. At the inlet, the gas mixture has a velocity of 0.00131 m/s. The mole fractions of CO2 and N2 are 0.2 and 0.8, respectively. For case 1, the adsorption process is adiabatic, and initial conditions of CO2, N2 concentration, pressure and bed temperature are set to 5.76, 23.05 mol/m3, 101325 Pa and 373 K and 423 K, respectively. For case 2, heat transfer is not considered, and the initial conditions of CO2, N2 concentration and pressure are set to 384.3 mol/m3, 1537 mol/m3 and 5 MPa, respectively. The initial and boundary conditions used in the simulation are presented in Table 5.
3. RESULTS AND DISCUSSION Fluid flow and species transport fields in the porous bed are computed using the Ansys Fluent built-in solver and six User Defined Scalar transport equations coupled to the solver to obtain the CO2 and N2 molar concentrations, the CO2 and N2 absorbed concentrations, and the fluid and porous bed temperatures. Adsorption equilibrium isotherms for the activated carbon are obtained using the Toth model.
Validation of Case 1- Activated Carbon adsorbent: Figures 2 (a) and (b) show the comparison between the simulated concentration ratio breakthrough curves with experimental data of [8] at the bed outlet for 373 K and 423 K, respectively. It can be seen that the N2 concentration profile compares well with the experimental data, while the CO2 concentration profile shows a slight discrepancy; the good agreement indicates that the Fluent with UDF code is a feasible tool to investigate such systems. It is clear that the concentration ratio of CO2 is zero at the bed outlet for the first 13 minutes (in the 373 K case) and approximately 7 minutes (in the 423 K case), while the concentration ratio value of N2 rises up to approximately 1.27 (373 K case) and 1.22 (423 K) due to the absence of CO2, which adsorbed onto the adsorbent material. Thus, the 9
concentration ratio increases up to 1 for CO2 and decreases down to 1 for N2 at approximately 50 minutes and approximately 30 minutes for the temperatures of 373 K and 423 K, respectively. The good time of CO2 adsorption appearing for the 373 K case is interpreted by the inherent exothermic process of adsorption. The breakthrough curves in terms of molar fraction for the two cases (373 K and 423 K) are shown in Fig. 3.
Figure 4 shows the CO2 concentration contours at two flow times during the adsorption process. The upper two CO2 contours are for the inlet gas temperature of 373 K, while the lower two CO2 contours are for the inlet gas temperature of 423 K. For the first 10 minutes of the adsorption process, the CO2 concentration values for 373 K (a1) are much higher than those of 423 K (b1) because at low temperature, the dissipation energy of the adsorption process is more efficient, providing the bed with a higher adsorption capacity. The same effect appears at 30 minutes of adsorption time, which could be considered as the saturation time for the 423 K case, whereas the contour values of 373 K (b2) have not yet reached this saturation case.
The N2 concentration contours at two flow times during the adsorption process and two different temperatures (373 K and 423 K) are illustrated in Fig. 5. Again, a similar observation can be made as that in Fig. 2, except that the N2 concentration in the column exceeds the inlet concentration during the early stages of the adsorption process; this difference is known as the rolling effect [35]. Furthermore, the higher temperature is responsible for the higher concentration values in the 423 K case compared to the 373 K case. Figure 6 shows the gas temperature contours at two flow times during the adsorption process. The upper two CO2 contours are for an inlet gas temperature of 373 K, while the lower two CO2 contours are for an inlet gas temperature of 423 K of the column. It can be seen that initially, the gas temperature in the core region is high due the exothermic nature of the adsorption process.
10
The gas velocity contours are shown in Fig. 7. It is obvious that the same values of velocity appeared in the early stage (10 min) for both temperatures (373 K and 423 K), while a small diversion was shown at 30 min for both cases due to the continuity of the adsorption process in the lower temperature case (373 K). Another point to note is that the velocity at the bed wall is zero, whereas inside the bed core, the velocity has the maximum values.
Validation of Case 2- MOF177 adsorbent: In the second validation case of the developed UDF code, the viral model used by Krishna and Long [15] utilizing MOF-177 as the adsorbate at T = 323 K and P = 5 bar is implemented to validate the present modeling method. The obtained results are in good agreement with those of Krishna and Long [15], as shown in Fig. 8. The molar fraction of CO2 started from zero and increased up to the original case (20% vol.). Figure 9 illustrates the outlet temperature for long times (approximately 2600 min) associated with the adsorption process.
Effects of aspect ratio and geometric shape To study the effect of the aspect ratio (length/diameter) of the adsorbent bed (Dantas [8]) on the adsorption behavior, four aspect ratios (L/D) were investigated, namely L/D=3.5, 5, 6.5 and 7.77, at the same bed volume (6.5 *10-5 m3), inlet mass flow (4.55*10-7 kg/s), inlet gas temperature (423 K), and the operation pressure (1 atm). Fig. 10 shows the breakthrough curves of the concentration ratio for these four cases of aspect ratios. The contour values of carbon dioxide concentrations exhibit larger values along the bed column for increasing the bed length and decreasing diameter (increasing aspect ratio), as shown in Fig. 11 at 30 minutes of adsorption time. However, the breakthrough curves and CO2 concentration contours are not sufficient to conclude which aspect ratio is better. Therefore, the adsorbed amounts of the CO2 contours at the same time (30 min) are provided, as shown in Fig. 12. In this figure, it is clear that increasing the aspect ratio is more appropriate for higher CO2 adsorption caused by the ease of rejecting the adsorption energy. The bed adsorbs a higher amount of CO2 in the case of the aspect ratio equal to 7.77 compared to those of 6.5 and so on. However, the difference is not significant (e.g., reduction of the aspect ratio from 7.77 to 6.5, 5, and 3.5 minimizes the adsorption capacity by 0.1%, 0.3% and 0.8%). Moreover, the
11
aspect ratio of 2 corresponds to an adsorption capacity reduction of 2.3% from the original case (aspect ratio of 7.77).
Figure 13 depicts the N2 concentration contours for the four aspect ratio cases at 30 minutes of adsorption. The contours show a slight increase in the N2 concentration values with a decreasing aspect ratio, which is the opposite behavior compared to the behavior of the CO2 concentration (shown in Fig. 11).
The gas temperature contours of aspect ratios are shown in Fig. 14. The observed high temperature values are associated with decreasing the aspect ratio in which the bed diameter is larger, so that the dissipation energy increases in the radial direction. This process explains the slight variation in adsorbent amounts with aspect ratio, as discussed in Fig. 12.
The physical domain of the adsorption bed, as shown in Fig. 1, is investigated to determine the effect of changing the configuration of the bed as convergent and divergent tapers compared to the normal bed. For the same operational conditions (such as bed volume (6.5 *10-5 m3), inlet mass flow (4.55*10-7 kg/s), inlet gas temperature (423 K), and operating pressure (1 atm)), normal bed (A), divergent taper (B) and convergent taper (C) are studied in the remaining part of this research. Figure 15 shows the CO2 breakthrough concentration ratio curves at the bed outlet. This figure shows little differences in the concentration ratio values of the three configurations. The CO2 concentration contours have larger values for the normal case, followed by convergent taper and then divergent taper, as shown in Fig. 16. In addition, the adsorbed amount of carbon dioxide values are slightly higher in the normal case (A) compared to the convergent cylinder case (C), while the divergent cylinder (B) adsorbed the least amount compared to the two other configurations due to the decrease in the dissipation energy at the downstream region, as shown in Fig. 17. However, the differences in adsorbed amount for the three cases are considered to be very low, with approximately 0.34% and 0.63% reduction of divergent and convergent cylinders compared to the normal bed column, respectively. 12
The N2 concentration contours emphasize the performance behavior shown in Fig. 18 because the high values of N2 concentrations are for the divergent taper and then for convergent taper and without taper bed. Fig. 19 shows the gas temperature contours of the three configurations. The temperature values are close to each other for the three cases (between 426 K and 428 K).
PSA Simulation For particle applications of CO2 capture, Pressure Swing Adsorption (PSA) is an important method for adsorption and desorption processes by changing the applied pressure through some steps in purpose of a continuous adsorption/desorption operation. In this paper, four steps have been carried out to present a full PSA cycle namely: Pressurization, Feed, Blowdown and Purge. The model has been validated with the experimental work of Dantas et. al [9] for a column bed filling with zeolite 13X. All-important parameters and column properties are shown in Table 6. The pressurization process (consumed 20 s) is mainly targeted to raise the pressure of the bed up to 1.3 bars (Fig. 20) by pure N2. Then, the feed process takes place with a mixture flow contains CO2/N2 (15% CO2, 85% N2 by volume) at 1.3 bars and 323 K. After a stipulated feed time (100 s), the CO2 desorption is performed by blowdown process (for 70 s) in which the pressure is minimized to about 0.1 bar as shown in Fig. 21. During the blow down process, the majority of captured CO2 is removed from the bed. The reaming amounts of adsorbed CO2 can, moreover, be reduced by counter-current flow purge process (by applying 0.5 liter/min of pure N2) at about 0.187 bar and 323 K for about 70 s. The detailed boundary conditions are shown in Fig. 20.
13
Figure 22 shows a CO2 molar flow rate of a complete PSA cycle (1st cycle) for both of experimental and 1D simulation modeling [9] and the present 2D laminar and turbulent simulation study. The turbulence has been solved by standard k-ε model to explore the effect of turbulent flow on the PSA when the Reynolds number is greater than 10 such as the case of the feed step (Re=16.26). The modeled transport equations for standard turbulence kinetic energy (k) and its rate of dissipation (ε) are: k-equation: 𝜕 𝜕 𝜕 𝜇𝑡 𝜕𝑘 (𝜌𝑘) + 𝑗 (𝜌𝑘𝑢𝑗 ) = 𝑗 [(𝜇 + ) 𝑗 ] + 𝐺𝑘 − 𝜌𝜖 + 𝑌𝑀 𝜕𝑡 𝜕𝑥 𝜕𝑥 𝜎𝑘 𝜕𝑥 and ε-equation: 𝜕 𝜕 𝜕 𝜇𝑡 𝜕𝜖 𝜖 𝜖 (𝜌𝜖) + 𝑗 (𝜌𝜖𝑢𝑗 ) = 𝑗 [(𝜇 + ) 𝑗 ] + 𝐶1𝜖 𝐺𝑘 − 𝐶2𝜖 𝜌 𝜕𝑡 𝜕𝑥 𝜕𝑥 𝜎𝜖 𝜕𝑥 𝑘 𝑘 where, Gk represents the generation of turbulence due to mean velocity gradient. YM represents the contribution of the fluctuating dilatation in compressible flow to the overall dissipation rate. 𝐶𝜖1 and 𝐶𝜖2 are constants. σk and σε are the turbulent Prandtl numbers for k and ε, respectively. More details about the standard k-ε model are described in [34]. The turbulent intensity and turbulent viscosity ratios have been taken as 5 and 10, respectively. The results shown in Fig.22 confirm that the CO2 molar fraction of both the laminar and the turbulent flow overlaps during all PSA steps, indicating that the laminar flow is sufficient under the studied boundary conditions. The CO2 molar flow rate values of the 2D simulation have a much better agreement with those of the experimental [9] in comparison with the results of 1D simulation. This can be attributed to the existence of the radial diffusion of both mass and heat transfer in the 2D model and involves the thermal diffusion term of the porous bed energy equation. 14
Figure 23 shows the temperature distribution along the bed at selective times during all PSA steps (at 10, 20, 30, 70 120, 150, 190, 230, and 260 s). Obviously, the bed temperature increases for few degrees during pressurization process while the temperature of the 1st third of the bed column raised up to almost 375 K (as a maximum) during feed process due to CO2 adsorption process. As evident, the adsorption process only took place at the 1st third of the bed column during all dedicated adsorption time (100 s). Therefore, the temperature in the remaining part of the bed has not increased more than 330 K. During the purging process, the temperature dropped down to almost 326 K at the desorption zone and to about 300 K in the remaining zone of the column due to the huge drop of the pressure, and also because of the desorption process which consumed some energy. The temperature continually decreased during the purge process as a result of desorbing some CO2 from the bed under purging N2 at a low pressure (18.7 kPa). The minimum temperature recorded during the desorption process is about 290 K.
4. CONCLUSIONS A two-dimensional transient numerical study of gas-solid adsorption fixed-bed systems of CO2/N2-Activated Carbon and CO2/H2-MOF177 was conducted. A set of add-on user defined functions (UDFs) and scalar (UDSs) transport equations were developed that can be coupled with the ANSYS-Fluent solver to predict molar concentrations and absorbed concentrations of CO2, N2 and H2 as well as the fluid and porous bed temperatures. In addition, the code can simulate any number of species in the gas mixtures for any type of fixed-bed column geometry, including two- and three-dimensional geometries. The code was used to simulate a 2D adsorption process at high temperature-low pressure and low temperature-high pressure for adsorption of CO2/N2 and CO2/H2 gas mixtures. The inlet gas temperature, pressure, adiabatic and non-adiabatic column wall boundary condition were considered to verify the code. The breakthrough curves and the pressure swing adsorption results obtained from the simulations compared well with experimental data. The study of the aspect ratio of the bed between 2 and 7.77 showed that the enhancement in the adsorption capability of the bed is not substantial (up to 2.3%) and 15
that the taper shapes do not have much effect on the adsorption performance at the same bed volume, inlet gas flow rate, operation pressure and temperature. Different from most publications, which have utilized one-dimensional models simulating CO2/N2 separation, the developed tool can be used to investigate the adsorption process of real exhaust gas mixture including water vapor and other gases. In addition, the proposed model can be used to investigate and optimize adsorption-separation and adsorption-storage systems with complex three-dimensional geometries. The contours of different variables and animations that can be obtained from these multi-dimensional simulations provide additional insight into the dynamics of the adsorption process, which are very helpful in understanding the process better.
ACKNOWLEDGMENT The authors wish to acknowledge the support received from King Abdulaziz City for Science and Technology (KACST) Carbon Capture and Sequestration Technology Innovation Center (CCS-TIC #32-753) at King Fahd University of Petroleum and Minerals (KFUPM) for funding this work through Project No. CCS10. The support of KFUPM through the Research Institute and the Deanship of Scientific Research is greatly appreciated.
References 1. 2.
3.
4. 5.
6. 7.
Lopes, F.V.S., Grande, C.A., and Rodrigues, A.E., Fast-cycling VPSA for hydrogen purification. Fuel, 2012. 93: p. 510-523. Ribeiro, A.M., Grande, C.A., Lopes, F.V.S., Loureiro, J.M., and Rodrigues, A.E., A parametric study of layered bed PSA for hydrogen purification. Chemical Engineering Science, 2008. 63(21): p. 5258-5273. Silva, B., Solomon, I., Ribeiro, A.M., Lee, U.H., Hwang, Y.K., Chang, J.-S., Loureiro, J.M., and Rodrigues, A.E., H2 purification by pressure swing adsorption using CuBTC. Separation and Purification Technology, 2013. 118: p. 744-756. Helfferich, F.G., Principles of adsorption & adsorption processes, by D. M. Ruthven, John Wiley & Sons, 1984, xxiv + 433 pp. AIChE Journal, 1985. 31(3): p. 523-524. Casas, N., Schell, J., Blom, R., and Mazzotti, M., MOF and UiO-67/MCM-41 adsorbents for pre-combustion CO2 capture by PSA: Breakthrough experiments and process design. Separation and Purification Technology, 2013. 112: p. 34-48. Casas, N., Schell, J., Pini, R., and Mazzotti, M., Fixed bed adsorption of CO2/H2 mixtures on activated carbon: experiments and modeling. Adsorption, 2012. 18(2): p. 143-161. Chang, D., Min, J., Moon, K., Park, Y.-K., Jeon, J.-K., and Ihm, S.-K., Robust numerical simulation of pressure swing adsorption process with strong adsorbate CO2. Chemical Engineering Science, 2004. 59(13): p. 2715-2725.
16
8.
9.
10.
11. 12. 13. 14.
15.
16.
17.
18.
19.
20.
21.
22.
23.
24. 25.
Dantas, T.L.P., Luna, F.M.T., Silva, I.J., de Azevedo, D.C.S., Grande, C.A., Rodrigues, A.E., and Moreira, R.F.P.M., Carbon dioxide–nitrogen separation through adsorption on activated carbon in a fixed bed. Chemical Engineering Journal, 2011. 169(1-3): p. 11-19. Dantas, T.L.P., Luna, F.M.T., Silva, I.J., Torres, A.E.B., de Azevedo, D.C.S., Rodrigues, A.E., and Moreira, R.F.P.M., Carbon dioxide–nitrogen separation through pressure swing adsorption. Chemical Engineering Journal, 2011. 172(2-3): p. 698-704. Dantas, T.L.P., Luna, F.M.T., Silva Jr, I.J., Torres, A.E.B., de Azevedo, D.C.S., Rodrigues, A.E., and Moreira, R.F.P.M., Modeling of the fixed - bed adsorption of carbon dioxide and a carbon dioxide - nitrogen mixture on zeolite 13X. Brazilian Journal of Chemical Engineering, 2011. 28(3): p. 533-544. Dunham, R.Q., Rosin-Rammler Distributions in ANSYS Fluent. 2012, Office of Scientific and Technical Information (OSTI). Gomes, V.G. and Yee, K.W.K., Pressure swing adsorption for carbon dioxide sequestration from exhaust gases. Separation and Purification Technology, 2002. 28(2): p. 161-171. Grande, C.A., Blom, R., Möller, A., and Möllmer, J., High-pressure separation of CH4/CO2 using activated carbon. Chemical Engineering Science, 2013. 89: p. 10-20. Hwang, K.S., Jun, J.H., and Lee, W.K., Fixed-bed adsorption for bulk component system. Nonequilibrium, non-isothermal and non-adiabatic model. Chemical Engineering Science, 1995. 50(5): p. 813-825. Krishna, R. and Long, J.R., Screening Metal–Organic Frameworks by Analysis of Transient Breakthrough of Gas Mixtures in a Fixed Bed Adsorber. The Journal of Physical Chemistry C, 2011. 115(26): p. 12941-12950. Liu, Z., Grande, C.A., Li, P., Yu, J., and Rodrigues, A.E., Multi-bed Vacuum Pressure Swing Adsorption for carbon dioxide capture from flue gas. Separation and Purification Technology, 2011. 81(3): p. 307-317. Lopes, F.V.S., Grande, C.A., and Rodrigues, A.E., Activated carbon for hydrogen purification by pressure swing adsorption: Multicomponent breakthrough curves and PSA performance. Chemical Engineering Science, 2011. 66(3): p. 303-317. Wang, L., Liu, Z., Li, P., Yu, J., and Rodrigues, A.E., Experimental and modeling investigation on post-combustion carbon dioxide capture using zeolite 13X-APG by hybrid VTSA process. Chemical Engineering Journal, 2012. 197: p. 151-161. Wang, Y., Adroher, X.C., Chen, J., Yang, X.G., and Miller, T., Three-dimensional modeling of hydrogen sorption in metal hydride hydrogen storage beds. Journal of Power Sources, 2009. 194(2): p. 997-1006. Won, W., Lee, S., and Lee, K.S., Modeling and parameter estimation for a fixed-bed adsorption process for CO2 capture using zeolite 13X. Separation and Purification Technology, 2012. 85: p. 120-129. Delgado, J.A., Uguina, M.A., Sotelo, J.L., and Ruíz, B., Fixed-bed adsorption of carbon dioxide– helium, nitrogen–helium and carbon dioxide–nitrogen mixtures onto silicalite pellets. Separation and Purification Technology, 2006. 49(1): p. 91-100. Delgado, J.A., Uguina, M.A., Sotelo, J.L., Ruíz, B., and Rosário, M., Separation of carbon dioxide/methane mixtures by adsorption on a basic resin. Adsorption, 2007. 13(3-4): p. 373383. Shafeeyan, M.S., Wan Daud, W.M.A., and Shamiri, A., A review of mathematical modeling of fixed-bed columns for carbon dioxide adsorption. Chemical Engineering Research and Design, 2014. 92(5): p. 961-988. Shendalman, L.H. and Mitchell, J.E., A study of heatless adsorption in the model system CO2 in He, I. Chemical Engineering Science, 1972. 27(7): p. 1449-1458. Cen, P. and Yang, R.T., Separation of a Five-Component Gas Mixture by Pressure Swing Adsorption. Separation Science and Technology, 1985. 20(9-10): p. 725-747.
17
26.
27.
28. 29.
30.
31.
32.
33. 34. 35.
Raghavan, N.S., Hassan, M.M., and Ruthven, D.M., Numerical simulation of a PSA system. Part I: Isothermal trace component system with linear equilibrium and finite mass transfer resistance. AIChE Journal, 1985. 31(3): p. 385-392. Kapoor, A. and Yang, R.T., Kinetic separation of methane—carbon dioxide mixture by adsorption on molecular sieve carbon. Chemical Engineering Science, 1989. 44(8): p. 17231733. Cavenati, S., Grande, C.A., and Rodrigues, A.E., Upgrade of Methane from Landfill Gas by Pressure Swing Adsorption. Energy & Fuels, 2005. 19(6): p. 2545-2555. Raynal, L., Augier, F., Bazer-Bachi, F., Haroun, Y., and Pereira da Fonte, C., CFD Applied to Process Development in the Oil and Gas Industry – A Review. Oil Gas Sci. Technol. – Rev. IFP Energies nouvelles, 2016. 71(3): p. 42. de Oliveira, L.P., Hudebine, D., Guillaume, D., and Verstraete, J.J., A Review of Kinetic Modeling Methodologies for Complex Processes. Oil Gas Sci. Technol. – Rev. IFP Energies nouvelles, 2016. 71(3): p. 45. Ben-Mansour, R., Habib, M.A., Bamidele, O.E., Basha, M., Qasem, N.A.A., Peedikakkal, A., Laoui, T., and Ali, M., Carbon capture by physical adsorption: Materials, experimental investigations and numerical modeling and simulations – A review. Applied Energy, 2016. 161: p. 225-255. Dantas, T.L., Amorim, S.M., Luna, F.M.T., Silva Jr, I.J., de Azevedo, D.C., Rodrigues, A.E., and Moreira, R.F., Adsorption of carbon dioxide onto activated carbon and nitrogen-enriched activated carbon: surface changes, equilibrium, and modeling of fixed-bed adsorption. Separation Science and Technology, 2009. 45(1): p. 73-84. Da Silva, F.A., Silva, J.A., and Rodrigues, A.E., A General Package for the Simulation of Cyclic Adsorption Processes. Adsorption, 1999. 5(3): p. 229-244. ANSYS-Fluent-Inc., manual. 2012: USA. Li, G., Xiao, P., Xu, D., and Webley, P.A., Dual mode roll-up effect in multicomponent nonisothermal adsorption processes with multilayered bed packing. Chemical Engineering Science, 2011. 66(9): p. 1825-1834.
18
CO2&N2 Inlet
Outlet
A
Inlet
Outlet
B
Inlet C
Outlet
Fig. 1: Physical domain of the adsorption bed: (A) regular cylinder, (B) diverging conical cylinder, and (C) converging conical cylinder; all have the same volume.
19
(a)
Concentration ratio (C/C_0)
1.4 1.2 1.0 0.8
C/C_0 (CO2) C/C_0 (CO2 - Exp.) C/C_0 (N2) C/C_0 (N2 - Exp.)
0.6 0.4 0.2 0.0 0
20
40
60
80
100
Time (min)
(b)
Concentration ratio (C/C_0)
1.40 1.20 1.00 0.80
C/C_0 (CO2)
0.60
C/C_0 (CO2 - Exp.) C/C_0(N2)
0.40
C/C_0 (N2 - Exp.)
0.20 0.00 0
20
40
60
80
Time (min)
Fig. 2: Breakthrough concentration ratio curves of CO2 separation at the outlet during the adsorption process as a comparison of the modeled concentration ratio with the experimental values:
(a) 373 K and (b) 423 K.
20
(a) 1.2 y (CO2)
Molar fraction (y)
1.0
y (N2)
0.8 0.6 0.4 0.2 0.0 0
10
20
30
40
50
60
70
80
90
Time (min)
(b) Molar fraction (y)
1.2 y (CO2)
1.0
y (N2)
0.8 0.6 0.4 0.2 0.0 0
10
20
30
40
50
60
70
Time (min)
Fig. 3: Molar fraction curves of CO2 separation at outlet during the adsorption process: (a) 373 K and (b) 423 K.
21
Fig. 4: CO2 concentration contours at different flow times: (a) 373 K and (b) 423 K.
22
Fig. 5: N2 concentration contours at different flow times: (a) 373 K and (b) 423 K.
23
Fig. 6: Gas temperature contours at different flow times: (a) 373 K and (b) 423 K.
24
Fig. 7: Velocity contours at different flow times: (a) 373 K and (b) 423 K.
25
100 90
mole fraction (y)
80 70 60 50
CO2
40
H2
30 20 10 0 0
4
8
12
16
20
24
28
32
36
40
(t u/ε L)
Fig. 8: Comparison of the concentration at the outlet during the adsorption process at T = 323 K and P = 5 bar for the MOF177 bed.
26
460.00
Temperature (K)
440.00 420.00 400.00 380.00 360.00 340.00 320.00 300.00 0
500
1000
1500
2000
2500
3000
Time (min)
Fig. 9: Outlet temperature during the adsorption process at T = 323 K and P = 5 bar for the MOF177 bed.
27
Concentration ratio (C/C_0)
1.4
N2
1.2 1 0.8 0.6
CO2
Aspect ratio = 7.77 Aspect ratio = 6.5 Aspect ratio =5 Aspect ratio = 3.5
0.4 0.2 0 0
5
10
15
20
25
30
35
40
45
Time (min) Fig. 10: Breakthrough concentration ratio curves at the bed outlet for different aspect ratios of the bed at the same operation condition (inlet mass flow rate, temperature and pressure).
28
Fig. 11:
CO2 concentration contours for different aspect ratios of the bed at the same
operation condition (inlet mass flow rate, temperature and pressure).
29
Fig. 12: CO2 adsorbent amount contours for different aspect ratios of the bed at the same operation condition (inlet mass flow rate, temperature and pressure).
30
Fig. 13:
N2 concentration contours for different aspect ratios of the bed at 30 min for the
same operation condition (inlet mass flow rate, temperature and pressure).
31
Fig. 14: Gas temperature contours for different aspect ratios of the bed at 30 min of the adsorption process for the same operation condition (inlet mass flow rate, temperature and pressure).
32
Concentration ratio (C/C_0)
1.4 1.2
N2
1.0 0.8 A (without taper)
0.6
B (divergent taper)
CO2
0.4
C (convergent taper)
0.2 0.0 0
10
20
30
40
50
Time (min)
Fig. 15: Breakthrough concentration ratio curves for different taper configurations of the activated carbon bed at the same operation condition (inlet mass flow rate, temperature and pressure).
33
Fig. 16: CO2 concentration contours for different taper configurations of the activated carbon bed at 30 min of the adsorption process for the same operation condition (inlet mass flow rate, temperature and pressure).
34
Fig. 17: CO2 adsorbent amount contours for different taper configurations of the activated carbon bed at the same operation condition (inlet mass flow rate, temperature and pressure).
35
Fig. 18: N2 concentration contours for different taper configurations of the activated carbon bed at 30 min of the adsorption process for the same operation condition (inlet mass flow rate, temperature and pressure).
36
Fig. 19: Gas temperature contours for different taper configurations of the bed at 30 min of the adsorption process for the same operation condition (inlet mass flow rate, temperature and pressure).
37
Fig. 20: Boundary conditions for the 4 steps of the 1st cycle of PSA according to the experimental work [9].
38
140000 120000
Pressure (Pa)
100000 80000 Experimental Simulation
60000
40000 20000 0 0
20 40 60 80 100 120 140 160 180 200 220 240 260 280 Time (s)
Fig. 21: Variation of the bed pressure (Pa) with the 1st cycle time of the experimental work [9] and the present simulation.
39
Feed
0.001
Blowdown
Purge
0.0008 Exp.
Pressurization
CO2 molar flow rate (mol/s)
0.0012
0.0006 0.0004
Simulation-1D Simulation-2D (laminar) Simulation-2D (turbulent)
0.0002 0 0
20
40
60
80 100 120 140 160 180 200 220 240 260 280 Time (s)
Fig. 22: A comparison of the CO2 molar flow rate history between the experimental work, the 1D simulation [9] and the present 2D laminar and turbulent simulation during a full PSA 1st cycle (4 steps).
40
Fig. 23: Bed temperature contours at selective times during 1st cycle of PSA; arrows show the flow path.
41
Table 1. Extended 2D-transient mathematical model used for activated carbon fixed-bed breakthrough simulation (for cylindrical coordinates: x: axial direction, r: radial direction) Title
Equation
Mass balance for each species of
𝜀
gas
𝜕𝐶𝑖 𝜕(𝑢𝐶𝑖 ) 𝜕(𝑤𝐶𝑖 ) +( + ) 𝜕𝑡 𝜕𝑥 𝜕𝑟 𝜕 2 𝐶𝑖 1 𝜕 𝑟 𝜕𝐶𝑖 = 𝜀𝐷 ( 2 + ( )) 𝜕 𝑥 𝑟 𝜕𝑟 𝜕𝑟 − (1 − 𝜀)𝜌𝑝
𝜕𝑞̅𝑖 𝜕𝑡
𝑞̅𝑖 is the average amount of component 𝑖 adsorbed in the solid sorbent (activated carbon), 𝐷𝑎𝑥 is the axial mass dispersion coefficient, and 𝜌𝑝 is the particle density.
Overall mass balance
𝜀
𝜕𝐶𝑟 𝜕(𝐶𝑟 𝑢) 1 𝜕(𝐶𝑟 𝑟𝑤) 𝜕𝑞̅𝑖 + + = (1 − 𝜀)𝜌𝑝 ∑ ( ) 𝜕𝑡 𝜕𝑥 𝑟 𝜕𝑟 𝑖 𝜕𝑡
𝐶r is the bulk gas concentration. Ergun equation
Energy balance of the gas phase
−∇𝑃 = 150
𝜀 𝜌𝑔 𝐶𝑣,𝑔
𝜇𝑔 (1 − 𝜀)2 𝜀 3 𝑑𝑝2
𝑢 ⃗ + 1.75
(1 − 𝜀) 𝜌 𝑢 ⃗𝑢 ⃗ 𝜀 3 𝑑𝑝 𝑔
𝜕𝑇𝑔 𝜕𝑇𝑔 𝜕𝑇𝑔 + 𝜌𝑔 𝐶𝑝,𝑔 (𝑢 +𝑤 ) 𝜕𝑡 𝜕𝑥 𝜕𝑟 𝜕 2 𝑇𝑔 1 𝜕 𝜕𝑇𝑔 = 𝜀𝜆𝐿 ( 2 + (𝑟 )) 𝜕𝑥 𝑟 𝜕𝑟 𝜕𝑟 𝜕𝑇𝑠 + (1 𝜕𝑡 𝜕𝑞̅𝑖 4ℎ𝑤 − 𝜀)𝜌𝑝 ∑ (−𝛥𝐻𝑖 )− (𝑇 − 𝑇𝑤 ) 𝜕𝑡 𝑑𝑖𝑛𝑡 𝑔 − 𝐶𝑠 (1 − 𝜀)𝜌𝑝
𝑖
where 𝐶𝑣,𝑔 is the specific heat at constant volume, 𝐶𝑝,𝑔 is the specific heat at constant pressure for gas phase,𝜆𝐿 is the thermal conductivity, 𝐶𝑠 is the bed specific heat, Δ𝐻𝑖 is the heat of adsorption for individual gas species, and ℎ𝑤 is the internal heat transfer coefficient between the gas and the reactor wall.
42
Energy balance of the porous bed
(1 − 𝜀)𝜌𝑝 𝐶𝑠
𝜕𝑇𝑠 𝜕𝑡 𝜕 2 𝑇𝑠 1 𝜕 𝜕𝑇𝑠 = (1 − 𝜀)𝑘 ( 2 + (𝑟 )) 𝜕𝑥 𝑟 𝜕𝑟 𝜕𝑟 + 𝜌𝑝 ∑ (−Δ𝐻𝑖 𝑖
Energy balance for the reactor wall
𝜌𝑤 𝐶𝑝,𝑤
6ℎ𝑓 𝜕𝑞̅𝑖 )+ (𝑇 − 𝑇𝑠 ) 𝜕𝑡 𝑑𝑝 𝑔
𝜕𝑇𝑤 𝜕 2 𝑇𝑤 = 𝛼𝑤 ℎ𝑤 (𝑇𝑔 − 𝑇𝑤 ) + 𝑘𝑤 𝜕𝑡 𝜕𝑥 2
where 𝛼𝑤 = 𝑑𝑖𝑛𝑡 /𝑙(𝑑𝑖𝑛𝑡 + 𝑙)
LDF equation for mass transfer for 𝜕𝑞̅𝑖 each component
𝜕𝑡
= 𝐾𝐿,𝑖 (𝑞𝑖∗ − 𝑞̅𝑖 )
where 𝐾𝐿,𝑖 is the overall mass transfer coefficient of component 𝑖 𝑞𝑖 ∗ = 𝑞𝑚,𝑖 𝐾𝑒𝑞,𝑖 𝑃𝑖 /[1 + (𝐾𝑒𝑞,𝑖 𝑃𝑖 )𝑛 ]1/𝑛 and 𝐾𝑒𝑞,𝑖 = 𝐾0,𝑖 𝑒 (−∆𝐻𝑖/𝑅𝑇) , where 𝐾0,𝑖 is the adsorption constant (values used are presented in Table 3). See Table 3.
The concentration 𝐶𝑖 is given by
𝐶𝑖 = 𝑦𝑖 𝑃/(𝑅𝑇𝑔 ) where 𝑦𝑖 is the molar fraction of each gas species, 𝑃 is the total pressure, 𝑇𝑔 is the temperature, and 𝑅 is the universal gas constant.
43
Table 2.
Extended 2D-transient mathematical model used for MOF177 fixed-bed
breakthrough simulation (1D model: Krishna and Long [15]). Title
Equation
Mass balance for each species of
𝜀
gas
𝜕𝐶𝑖 𝜕(𝑢𝐶𝑖 ) 𝜕(𝑤𝐶𝑖 ) +( + ) 𝜕𝑡 𝜕𝑥 𝜕𝑟 𝜕 2 𝐶𝑖 1 𝜕 𝜕𝐶𝑖 = 𝜀𝐷𝑎𝑥 ( 2 + (𝑟 )) 𝜕 𝑥 𝑟 𝜕𝑟 𝜕𝑟 − (1 − 𝜀)𝜌𝑝
𝜕𝑞̅𝑖 𝜕𝑡
𝑞̅𝑖 is the average amount of component 𝑖 adsorbed in the solid sorbent (MOF-177), 𝐷 is the mass dispersion coefficient, and 𝜌𝑝 is the particle density.
Overall mass balance
Ergun equation Energy balance of the gas phase
𝜀
𝜕𝜌 𝜕(𝜌𝑢) 1 𝜕(𝜌𝑟𝑤) 𝜕𝑞̅𝑖 + + = (1 − 𝜀)𝜌𝑝 ∑ ( ) 𝜕𝑡 𝜕𝑥 𝑟 𝜕𝑟 𝑖 𝜕𝑡
−∇𝑃 = 150 𝜀 𝜌𝑔 𝐶𝑣,𝑔
𝜇𝑔 (1 − 𝜀)2 (1 − 𝜀) 𝑢 ⃗ + 1.75 3 𝜌 𝑢 ⃗𝑢 ⃗ 2 3 𝜀 𝑑𝑝 𝑔 𝜀 𝑑𝑝
𝜕𝑇𝑔 𝜕𝑇𝑔 𝜕𝑇𝑔 + 𝜌𝑔 𝐶𝑝,𝑔 (𝑢 +𝑤 ) 𝜕𝑡 𝜕𝑥 𝜕𝑟 𝜕 2 𝑇 1 𝜕 𝑟 𝜕𝑇𝑔 = 𝜀𝜆 ( 2 + ( )) 𝜕𝑥 𝑟 𝜕𝑟 𝜕𝑟 𝜕𝑇𝑠 + (1 𝜕𝑡 𝜕𝑞̅𝑖 4ℎ𝑤 − 𝜀)𝜌𝑝 ∑ (−𝛥𝐻𝑖 )− (𝑇 − 𝑇𝑤 ) 𝜕𝑡 𝑑𝑖𝑛𝑡 𝑔 − 𝐶𝑠 (1 − 𝜀)𝜌𝑝
𝑖
Energy balance of the porous bed
(1 − 𝜀)𝜌𝑝 𝐶𝑠
𝜕𝑇𝑠 𝜕 2 𝑇𝑠 1 𝜕 𝑟 𝜕𝑇𝑠 = (1 − 𝜀)𝑘 ( 2 + ( )) 𝜕𝑡 𝜕𝑥 𝑟 𝜕𝑟 𝜕𝑟 + 𝜌𝑝 ∑ (−Δ𝐻𝑖 𝑖
𝑞̅𝑖 = 𝑞𝑖 ∗
LDF equation for mass transfer for each component
6ℎ𝑓 𝜕𝑞̅𝑖 )+ (𝑇 − 𝑇𝑠 ) 𝜕𝑡 𝑑𝑝 𝑔
𝑞𝑖 ∗ =
𝑞𝑚,𝑖1 𝐾𝑒𝑞,𝑖1 𝑃𝑖 𝑛1 𝑞𝑚,𝑖2 𝐾𝑒𝑞,𝑖2 𝑃𝑖 𝑛2 1+𝐾𝑒𝑞,𝑖1 𝑃𝑖 𝑛1
+
1+𝐾𝑒𝑞,𝑖2 𝑃𝑖 𝑛2
And 𝐾𝑒𝑞,𝑖1 = 𝐾0,𝑖1 exp(−∆𝐻𝑖 /𝑅𝑇), where
𝐾0,𝑖1 ,𝐾0,𝑖2 n1
and n2 are adsorption constants
The concentration 𝐶𝑖 is given by
𝐶𝑖 = 𝑦𝑖 𝑃/(𝑅𝑇𝑔 ) where 𝑦𝑖 is the molar fraction of each gas species, 𝑃 is the
44
total pressure, 𝑇𝑔 is the temperature, and 𝑅 is the universal gas constant (the values used are presented in Table 3).
45
Table 3. Values of the constants used in validation case 1. Fixed-bed characteristics Bed void fraction, 𝜀
0.52
Bed diameter, 𝑑𝑖𝑛𝑡
Axial dispersion 𝐷𝑎𝑥
0.10*10-4 m2/s
Column wall density, 7830 kg/m3
0.022 m
𝜌𝑤 Particle density, 𝜌𝑝
1138 kg/m3
Column
wall 0.0015 m
thickness, l Mass transfer coefficient 0.032, 0.128 1/s
Bed length, L
0.171 m
𝑛𝑐𝑜2 , 𝑛𝑁2
20%, 80%
𝐾0,𝐶𝑂2, 𝐾0,𝑁2
7.62*10-5,
𝐾𝑙,𝑐𝑜2 𝐾𝑙,𝑁2 Particle diameter, 𝑑𝑃 Thermal
conductivity 0.01660,
𝜆 (CO2, N2) Column
0.0038 m
wall
specific 440 J/kg.K
Δ𝐻𝐶𝑂2, Δ𝐻𝑁2
Ambient temperature, 303 K 𝑇∞
heat capacity Adsorption
6.91*10-5 1/Pa
0.02599 W/m.K
heat -21840, -16310 𝑞𝑚,𝐶𝑂2, 𝑞𝑚,𝑁2 J/mol
10.05,
9.74
mol/kg
46
Table 4. Values of the constants used in validation case 2. Fixed-bed characteristics Bed void fraction, 𝜀
0.52
Bed
diameter, 0.022 m
𝑑𝑖𝑛𝑡 Axial dispersion 𝐷𝑎𝑥
1.4*10-6 m2/s
Column
wall 7830 kg/m3
density, 𝜌𝑤 Particle density, 𝜌𝑝
905 kg/m3
Column
wall 0.0015 m
thickness, l 𝐾0,𝐶𝑂2, 𝐾0,𝑁2
3.56*10-19,
Bed length, L
0.085 m
Ambient
303 K
1.12*10-8 (1/Pa) Particle diameter, 𝑑𝑃
0.0038 m
temperature, 𝑇∞ Thermal
conductivity 0.01867,
𝜆𝑙 (CO2, N2) Column
wall
𝑞𝑚,𝐶𝑂2, 𝑞𝑚,𝑁2
0.02762 W/m.K specific 440 J/kg.K
25.15,
100
(mol/kg) 𝑛𝐶𝑂2 , 𝑛𝑁2
20%, 80%
heat capacity
47
Table 5. Initial and boundary conditions. Initial conditions 𝑦𝑖 = 𝐶𝑖 = 𝑞𝑖 = 0,
𝑦𝑖𝑛𝑒𝑟𝑡 = 1, 𝐶𝑖𝑛𝑒𝑟𝑡 = 𝐶𝑔,𝑇 , 𝑇𝑔 = 𝑇𝑠 = 𝑇𝑤 = 𝑇𝑖𝑛𝑙𝑒𝑡
Boundary condition Inlet 𝜀𝐷
Outlet 𝜕𝐶𝑖 𝜕𝑥
𝜕𝐶𝑖
|+ = 𝑢 (𝐶𝑖|− − 𝐶𝑖|+ )
𝜕𝑥
and 𝑢 𝐶𝑖|− = 𝑢 𝐶𝑖|+ 𝜀𝜆
𝜕𝑇𝑔 𝜕𝑥
= 0, 𝜕𝑟 wall
𝜕𝑇𝑔 𝜕𝑥
|− = 0
𝑃 = 𝑃𝑜𝑢𝑡𝑙𝑒𝑡
|+ = 𝑢 𝐶 𝐶𝑝 (𝑇𝑔 |− − 𝑇𝑔 |+ )
Wall: 𝜕𝐶𝑖
|− = 0,
Centerline: 𝑎𝑡 𝑟 = 𝑑𝑡𝑢𝑏𝑒 /2
,
impermeable
𝜕𝐶𝑖 𝜕𝑟 𝜕𝑇𝑔 𝜕𝑟
= 0, 𝑎𝑡 𝑟 = 0 ; Symmetry = 0, 𝑎𝑡 𝑟 = 0; Symmetry
48
Table 6. Properties of the bed column and adsorbent (13X) used in the experimental work [9] and the current simulation. Properties Value Bed Length, L
0.83 m
Bed diameter, dint
0.021 m
Column wall thickness, l
0.0041 m
Column wall specific heat
500 J kg−1 K−1
capacity, Cw Column wall density
8238 kg m−3
Particle density, ρ
1228.5
Bed void fraction, ε
0.62
Solid Specific heat, Cs
920 J kg−1 K−1
CO2 maximum adsorbed concentration (qm)
5.09 mol kg-1
N2 maximum adsorbed concentration (qm)
3.08 mol kg-1
Toth constant n (CO2)
0.429
Toth constant n (N2)
0.869
Toth constant Ko (CO2)
4.31e-9 Pa-1
Toth constant Ko (N2)
8.81e-10 Pa-1
CO2 adsorption heat H
-29380 J mol-1
N2 adsorption heat H
-17190 J mol-1
49