VOL. 8, NO. 12, DECEMBER 2013
ISSN 1819-6608
ARPN Journal of Engineering and Applied Sciences ©2006-2013 Asian Research Publishing Network (ARPN). All rights reserved.
www.arpnjournals.com
MULTILAYER PERCEPTRON-MULTIACTIVATION FUNCTION ARTIFICIAL NEURAL NETWORK MODEL FOR MUNICIPAL WATER DEMAND FORECASTING Jowhar R. Mohammed1 and Hekmat M. Ibrahim2 1
Water Resources Engineering, Faculty of Engineering and Applied Science, University of Dohuk, Iraq 2 Dams and Water Resources Engineering, Faculty of Engineering, University of Sulaimani, Iraq E-Mail:
[email protected]
ABSTRACT In this research, a multilayer perceptron neural network model with multiactivation function called (MLP-MAF) model has been developed for municipal water demand forecasting. The developed model uses different activation functions in the hidden layer neurons. Different combinations of the linear, logistic, tangent hyperbolic, exponential, sine and cosine activation functions were used in the hidden layer neurons. In order to assess the credibility of developed model results, the model was run over the available data which include the time series of daily and monthly municipal water consumption for fourteen years (1/1/1992 - 31/12/2004) of Tampa city, USA. Each time series was divided into two subsets: the estimate subset for fitting the model and the holdout subset for evaluating the forecasting ability of the model. Additionally, three statistical measurements, namely the coefficient of determination (R2), the root mean square error (RMSE) and the mean absolute percent error (MAPE) and two hypothesis tests, namely the t-test and F-test have been reported for examining the forecasting accuracy of the developed model. The results show that the combination of linear, sine and cosine functions is better than other combinations. Furthermore, the effectiveness assessment of this model shows that this approach is considerably more accurate and performs better than the traditional multilayer perceptron (MLP) and radial basis function (RBF) neural networks. Keywords: forecasting, ANN, water demand.
INTRODUCTION The scarcity of water is considered the most challenging problem that is facing the countries in the world. The long term forecasting of municipal water demand in such countries is a critical and essential factor for water supply planning, which includes the determining of type, size, location and timing of the required improvements and developments of the water supply systems. On the other hand, short term forecasting of municipal water demand is required for water utilities to proactively optimize pumping and treatment operations to minimize energy, water supply and treatment costs while maintaining a reliable and high quality product for their customers. There are considerable amounts of published material dealing with water demand forecasting, all of which cannot be reviewed here. However, some principal contributions of historical interest will be cited. In the last few decades there has been a growing scientific interest in the development and use of water consumption forecasting models with monthly, weekly, daily and hourly time scales. Different mathematical models have been investigated and developed by a number of researchers, including regression models that estimate the water consumption as a function of economic and climatic variables and time series models. The autoregressive and autoregressive integrated moving average based models for forecasting of urban water consumption were also developed and compared. Several investigators proposed artificial neural networks as water consumption forecasting models with climatic variables and additional seasonal indices being the model inputs and these models
have become prominent for water demand forecast as the neural network was found to outperform the regression and time-series models in some studies. Other models were proposed that explicitly take into account the seasonal, weekly and daily periodicity of urban water consumption. On the other hand, some studies can be found on the application of fuzzy logic, adaptive neurofuzzy inference system and wavelet approach for water demand forecasting. Jain, et al. (2001) investigated a relatively new technique of Artificial Neural Networks (ANNs) for using in forecasting short term water demand. The ANN models consistently outperformed the regression and time series models developed in their study and complex ANN performs better than simple ANN. Zhang, et al. (2001) presented an experimental evaluation of neural networks for nonlinear time series forecasting. They focused on the feed forward multilayer networks which is known as the multilayer perceptrons (MLPs) and the effects of three important factors (the number of input nodes, the number of hidden nodes and the training sample size) on the neural network forecasting ability were examined by conducting a trail. They found that both the number of input nodes and the number of hidden nodes have significant effects and the number of observations (training sample size) has limited effects on ANN model building and predictive ability. Kim, et al. (2001) established an effective model for forecasting the daily urban water demand using feed forward neural networks with genetic algorithms. Alaa and Nisai (2004) presented an approach for short-term (daily) forecasting of municipal water use that utilizes a deterministic smoothing algorithm to predict monthly
1019
VOL. 8, NO. 12, DECEMBER 2013
ISSN 1819-6608
ARPN Journal of Engineering and Applied Sciences ©2006-2013 Asian Research Publishing Network (ARPN). All rights reserved.
www.arpnjournals.com water use. A two-step approach is employed whereby monthly forecasts are first developed using an adaptive exponential smoothing algorithm, then the daily forecasts is developed by forecasting daily deviations from the monthly average using a time-series regression model. Bougadis, et al. (2005) investigated a relative performance of regression, time series analysis and artificial neural network (ANN) models for short-term peak water demand forecasting. In their study, the Fourier analysis for detecting the seasonal and periodic components of time series was used. They found that the ANN technique substantially outperformed regression and time-series methods in terms of accuracy of forecasting. Zhang, et al. (2006) developed ANN models for short-term water demand forecasting with a detailed ANN modeling procedure, including identification and selection of input variables and training process. Two ANN models, one for the summer season, and another for the winter season, were developed independently, with different input variables. They found the concept of a division of summer and winter seasons were valid because it simplified the winter season model. Chang and Makkeasorn (2006) proposed and investigated a methodology to predict the water demand with respect to monthly scales in a major metropolitan area using population growth and land use/economic change estimations (i.e., real estate property tax variations) for two types of cities, (fast growth and slow growth) in the Great Orlando Metropolitan Area in Florida. The data (population, water consumption, land use, average incomes, etc.) are projected forward using ANNs models in the first stage analysis and the second stage analysis of their work aims at conducting a forecasting analysis using multilayer perceptron-based neural network models to forecast the future water demand. They concluded that the ANN model would create more accurate predictions if a better database was used. Zhang, et al. (2007) employed an ensemble technique to integrate the uncertainty associated with weather variables in short-term water demand forecasting models to provide more reliable and reasonable forecasts. They found that the ensemble forecasting results, compared to the single final forecast computed from the usual deterministic models, improves the robustness of the prediction and the confidence band obtained from the ensemble model provides more reliable. Msiza, et al. (2007) compared the efficiency of Artificial Neural Networks (ANNs) and Support Vector Machines (SVMs) techniques in water demand forecasting. They found that the ANNs perform significantly better than SVMs. Also Msiza, et al. (2007) in another study investigated the multilayer perceptron (MLP) and the radial basis function (RBF) artificial neural networks for forecasting both shortterm and long-term water demand in the Gauteng Province, in the Republic of South Africa. They found that the most optimum approximation is the RBF with (r4logr) activation function. It was observed that the RBF converges to a solution faster than the MLP and it is the most accurate and the most reliable tool in terms of processing large amounts of non-linear, non-parametric
data. Adamowski (2008) developed and compared multiple linear regressions, time series analysis, and artificial neural networks (ANNs) as techniques for peak daily summer water demand forecast modeling. The artificial neural network approach was shown to provide a better prediction of peak daily summer water demand than multiple linear regression and time series analysis. Ghiassi, et al. (2008) developed a dynamic artificial neural network model (DAN2) for comprehensive (long, medium, and short term) urban water demand forecasting. The DAN2 neural network model employs a different architecture than the traditional Feed Forward Back Propagation (FFBP) model and developed to forecast monthly demand values. Results have shown that DAN2 models outperformed ARIMA and a FFBP-based ANN across all time horizons. Firat, et al. (2009) evaluated three artificial neural network techniques, Generalized Regression Neural Networks (GRNN), Feed Forward Neural Networks (FFNN) and Radial Basis Neural Networks (RBNN) based on their performance in forecasting monthly water consumptions from several socio-economic and climatic factors, which affect water use. They found that the model based on multiple input variables performances is better than the model based on a single input variable and Generalized Regression Neural Networks (GRNN) method is better than other ANNs and Multiple Linear Regression (MLR) models and can be successfully applied to establish accurate and reliable water consumption forecasting models. Leon F. and Zaharia M. H. (2010) proposed a stacked hybrid neural network model for time series forecasting. The model contains one normal multilayer perceptron with bipolar sigmoid activation functions and the other with an exponential activation function in the output layer. They found that the stacked hybrid neural network model performs well on a variety of benchmark problems for time series. The overall objective of this research is to develop an accurate model to forecast short and long term municipal water demand and apply it to the available data of water consumption. In order to meet this goal, a multilayer perceptron multi activation function neural network (MLP-MAF) model has been developed. The model differs from the traditional multilayer perceptron neural network that it uses neurons in the hidden layer with different types of activation functions. The model applied to the time series of daily and monthly water consumption of Tampa city, USA. The study area and available data Because the development of the water forecasting model is dependent on the availability of water consumption data, therefore, to illustrate the applicability and capability of the model developed in the present research is applied to area, which can access to the required data. The area that the required data have been obtained for and the developed model applied to it as a case study is Tampa in the USA. The available data includes the daily water consumption and climatological
1020
VOL. 8, NO. 12, DECEMBER 2013
ISSN 1819-6608
ARPN Journal of Engineering and Applied Sciences ©2006-2013 Asian Research Publishing Network (ARPN). All rights reserved.
www.arpnjournals.com data (minimum and maximum temperature, rainfall, mean relative humidity and mean wind speed) for a period of thirteen years from 1-January-1992 to 31-December-2004 and the monthly data were derived from the daily data. The Tampa Bay Area is the region of west central Florida adjacent to Tampa Bay, USA. Tampa Bay Water is a regional wholesale drinking water utility that serves customers in the Tampa Bay, Florida region, USA as shown in Figure-1. The agency is special districts of the state created by inter local agreement among six member governments. Customers served in the area are predominantly residential users, with commercial, industrial and public consumption included (Asefa and Adams, 2007).
Model performance and accuracy measurements The most important criterion for evaluating forecasting models or choosing between competing models is accuracy. Generally speaking, the closer the forecasts to the observed values y, of the series, the more accurate the forecasting model is. Thus the quality of a model can be evaluated by examining the series of forecast errors ( ). The most commonly used measures of forecast accuracy are mean absolute error (MAE), mean squared error (MSE), root mean squared error (RMSE) and mean absolute percentage error (MAPE) (Rumantir, 1995). In addition to these measures, the most commonly used error measures in water resources modeling include the mean squared relative error (MSRE), the coefficient of determination (R2) and the coefficient of efficiency (CE) (Kingston, 2006).
Figure-1. Tampa Bay area map which is used as a study area in the research (Asefa and Adams, 2007). A more realistic way of assessing a model’s accuracy is to use a holdout set, that is, some of the data at the end of the series are omitted before the models are estimated. Then the models are compared on the basis of how well they forecast the data, which have been withheld rather than how well they forecast the same data which has
been used for modeling (Makridakis, et al., 1998). Therefore, in the present research for the purpose of selecting and comparison of forecasting models, the time series data were split into two sets. The first set of the data is used to estimate the parameters of the particular model (estimate set). Then with these estimates, the model is
1021
VOL. 8, NO. 12, DECEMBER 2013
ISSN 1819-6608
ARPN Journal of Engineering and Applied Sciences ©2006-2013 Asian Research Publishing Network (ARPN). All rights reserved.
www.arpnjournals.com used to forecast ahead the remaining data points (holdout set). To obtain information about the model’s ahead forecasting performance; the resulting out of sample forecasts is compared to the actual holdout series values. Some of the above measures are used for holdout data and the model that yields best values for these statistics on holdout set would be chosen as a good model. For monthly water consumption data, the last 24 months of the data
were to be held out, and then the model were fitted on the remaining data and used to forecast 24 months ahead. On the other hand, for daily water consumption data the last 5, 10 and 15 days of the data were held out. According to this partitioning of data, the number of estimation and holdout sets for the data considered in this research will be as shown in Table-1.
Table-1. Duration and estimation with holdout water consumption data sets for Tampa area. Data
156 months
Estimation data No. 132
Holdout data No. 24
4745 days
4740, 4735, 4730
5, 10, 15
Years
Duration
Monthly data
1992 - 2004
Daily data
1992 - 2004
In order to provide an indication for the performance of the developed models in the present research and goodness of fit between the observed and each of predicted values for estimating set (fit) and holdout set (forecast), R2, RMSE and MAPE were used for the models investigated in this research as shown in the following equations:
(1)
(2)
(5) Where N1 and N2 are the subseries sizes, Xi is the sample values in the N1 series and Xj in the N2 series. The variable t of Equation (4) follows the Student -distribution with (N1 + N2 – 2) degrees of freedom. The critical value tc for the 95% significance probability level is taken from the Student t-tables. If , then there is a difference in the mean of two series. In statistics, an F-test for the null hypothesis that two normal populations have the same variance is sometimes used. The expected values for two populations can be different, and the hypothesis to be tested is that the variances are equal. The F-test statistic is:
(3) In which N is the number of data points,
,
are
the observed data with its mean, respectively and , are the corresponding predicted data with its mean, respectively. Also two additional statistical tests, t-test and F-test were used in this research to compare the mean and variance of observed and predicted series for estimating and holdout sets. Among the most frequently used t-tests are a two sample location test of the null hypothesis that the means of two normally distributed populations are equal. The t-test statistic is:
(4)
(6) Where
,
are the variance of observed and predicted
data, respectively. The observed and predicted sets have an F-distribution with N-2 degrees of freedom if the null hypothesis of equality of variances is true. The null hypothesis is rejected if F is either too large or too small. Multilayer perceptron neural network (MLP) The basic architecture of artificial neural network consists of three types of neuron layers: input layer, hidden layers and an output layer. Artificial neurons in one layer are connected, fully or partially, to the artificial neurons in the next layer. Feedback connections to previous layers are also possible (Engelbrecht, 2007). A multilayer perceptron is feed forward neural network architecture with unidirectional full connections between successive layers. Figure-2 shows the structure of a multilayer perceptron artificial neural network which has an input layer, a hidden layer, and an output layer of neurons. These three layers are linked by connections
1022
VOL. 8, NO. 12, DECEMBER 2013
ISSN 1819-6608
ARPN Journal of Engineering and Applied Sciences ©2006-2013 Asian Research Publishing Network (ARPN). All rights reserved.
www.arpnjournals.com Where n is the number of training cases. It is clear that the bigger the difference between predictions of the network and the targets, the higher the error value, which means more weight adjustment, is needed by the training algorithm (Hill and Lewicki, 2007). There are three main types of learning: supervised, unsupervised and reinforcement learning. The primary interests are the supervised learning algorithms, the most frequently used in real applications, such as the back propagation training algorithm, also known as the generalized delta rule. Two types of supervised learning algorithms exist based on when weights are updated:
whose strength is called weight. Thus there are two sets of weights: the input-hidden layer weights and the hiddenoutput layer weights. These weights provide the network with tremendous flexibility to freely adapt to the data; they are the free parameters, and their number is equivalent to the degrees of freedom of a network (Samarasinghe, 2006). The output of typical MLP neural networks with a single layer of hidden neurons, as shown in Figure-2, is given by:
(7) is the output, n Where x is the input variable, is the number of neurons in input layer which is equal to the number of input variables, m is the number of neurons in hidden layer, w is the weights of input-hidden and hidden-output layers, b is the bias of hidden and output layers, fh is the activation function of hidden layer and fo is the activation function of output layer (Dreyfus, 2005). Training of multilayer perceptron artificial neural network basically involves feeding training samples as input vectors through a neural network, calculating the error of the output layer, and then adjusting the weights of the network to minimize the error. The average of all the squared errors for the outputs is computed to make the derivative easier. Once the error is computed, the weights can be updated one by one (Engelbrecht, 2007). The sum of squares error is simply given by the sum of differences between the target and prediction outputs defined over the entire training set. Thus:
Learning iterations which are referred to as epochs, consists of two phases: a) Feed forward pass, which simply calculates the output value(s) of the neural network for each training pattern. b) Backward propagation, which propagates an error signal back from the output layer toward the input layer. Weights are adjusted as functions of the back propagated error signal (Engelbrecht, 2007). It has been proven that back propagation learning with sufficient hidden layers can approximate any nonlinear function to arbitrary accuracy. This makes back propagation learning neural network a good candidate for signal prediction and system modeling (Abraham, 2005).
(8) Input layer
Hidden layer
Stochastic/online learning, where weights are adjusted after each pattern presentation. In this case the next input pattern is selected randomly from the training set, to prevent any bias that may occur due to the order in which patterns occur in the training set. Batch/offline learning, where weight changes are accumulated and used to adjust weights only after all training patterns have been presented.
Output layer
x1
bj n
sj = w j,ixi+ bj
xi
f h (sj)
f
hj
i=1
Bias x1
b
x1
b xn f1
bk m
x1 x1
1
1
f
sk = w k,jf h j+bk f o (sk)
j
yˆ k
j=1
f
xi
i
xn
n
j
w j,i w*j,i
m
Adjusted weights
k
w k,j
m
yˆ Output
Compare
y Target
Error
w*k,j
Back propagation training
Figure-2. Structure of typical multilayer perceptron artificial neural network.
1023
VOL. 8, NO. 12, DECEMBER 2013
ISSN 1819-6608
ARPN Journal of Engineering and Applied Sciences ©2006-2013 Asian Research Publishing Network (ARPN). All rights reserved.
www.arpnjournals.com Radial basis function neural networks may require more neurons than standard feed forward back propagation networks, but often they can be designed with less time (Abraham, 2005). Figure-3 illustrates a general architecture of the radial basis function neural network. The architecture is very similar to that of a standard multilayer perceptron neural network, with the following differences:
Radial basis function neural networks (RBF) A radial basis function neural network is a feed forward neural network where hidden units do not implement an activation function, but represents a radial basis function (Engelbrecht, 2007). The common architecture of a radial basis function neural network firmly consists of three layers: the input layer, the hidden layer, and the output layer. In the neurons of the hidden layer, the activation functions are placed. The input layer of the network does no processing and it is directly connected with the hidden layer of the network, so that only the connections between the hidden layer and the output layer are weighted (Palit and Popovic, 2005). Therefore, the radial basis function neural network can be considered as a two-layer network in which the hidden layer performs a fixed nonlinear transformation with no adjustable parameters, so that the input space is mapped into a new space. The hidden layer in a radial basis function neural network consists of an array of nodes and contains a parameter vector called a center. A distance measure, to determine how an input vector is far from the center, is typically the standard Euclidean distance measure. The node calculates the Euclidean distance between the center and the input vector of the network and the result is passed through a nonlinear function. A transfer function, which is a function of a single variable, determines the output of the distance function. The output layer then combines outputs in the latter space linearly (Taylor, 1996).
Input layer
Hidden layer
Hidden units implement a radial basis function. Weights from the input neuron to a hidden neuron, referred to as µ which represents the center of the radial basis function. Some radial basis functions are characterized by a width σ. For such basis functions, the weight from the basis neuron in the input layer to each hidden neuron represents the width of the basis function. Note that input neuron b refers to an input signal of +1 (bias).
Each hidden unit implements a radial basis function. These functions, also referred to as kernel functions, are strictly positive, radially symmetric functions. A radial basis function has a unique maximum at its center µ, and the function usually drops off to zero rapidly further away from the center. The output of a hidden unit indicates the closeness of the input vector x, to the center of the basis function.
Output layer
x1
bj n
2
(x i -
Bias
b
)
f 2
x1
ji
i=1
f j =exp -
xi
j
2 j
b
x1
xn f1
bk m
x1 x1
1
1
yˆ =
f
j
f
m
(wkj f j) +bk
yˆ
j=1
xi
j
i
Compare
k
yˆ Output xn
n
m
y Target
wkj Error
ji
w*kj Adjusted weights Training
Figure-3. Structure of typical radial basis function artificial neural network. A number of radial basis functions have been proposed: linear, cubic, thin plate spline, multi-quadratic, Inverse multi-quadratic, Gaussian and logistic functions (Engelbrecht, 2007). The input data are presented the network in input layer and these data are transferred to hidden layer by radial basis function. The response of the network is obtained in the output layer. The various types of radial basis functions can be used for transferring of the
input data to the hidden layer (Firat and Gungor, 2007). However, in this research, the Gaussian activation function, the most commonly used, is selected as the activation function for training data set. The mathematical structure of Gaussian activation function is demonstrated as follows:
1024
VOL. 8, NO. 12, DECEMBER 2013
ISSN 1819-6608
ARPN Journal of Engineering and Applied Sciences ©2006-2013 Asian Research Publishing Network (ARPN). All rights reserved.
www.arpnjournals.com
(9) Where x is the input, n is the number of inputs, µ is the parameter which is the position of the center of the is its standard deviation. The has an Gaussian and appreciable value only in the neighborhood of the center (Taylor, 1996). The standard deviation and center determine the properties of each function during the training process. The response of each hidden neuron is scaled by its connecting weights to the output neurons and then summed to produce the overall network output. Therefore, the output of the neural network for Gaussian radial basis functions is given by:
(10) Where w is the weight of connection between the hidden neuron j and the output neuron k, b is the bias and m is the number of neurons in the hidden layer (Dreyfus, 2005). The methods used to train radial basis function neural networks are fundamentally different from those employed for multilayer perceptron neural networks (Hill and Lewicki, 2007). The most important issue here for each neuron in the hidden layers is the selection of the center u, the spread around the center σ and the weights between the hidden and output neurons. Training of a radial basis function neural network should therefore consider methods to find the best values for the parameters µ, σ and w. The network training process mainly includes two training phases:
Initialization of radial basis function centers u, for instance using unsupervised clustering methods, linear vector quantization, or decision trees. Output weight training of the radial basis function network using an adaptive algorithm to estimate its appropriate values. In some cases, it is recommended to add a third training phase, in which the entire network architecture is adjusted using an optimization method (Palit and Popovic, 2005). Artificial neural networks generalization and performance The performance of neural networks is measured by how well they can predict unseen data (an unseen data set is one that was not used during training). This is known as generalization. There is a relation between over fitting the training data and poor generalization (Hill and Lewicki, 2007). That is, neural networks that over fit cannot predict correct output for data patterns not seen
during training. Therefore, generalization is a very important aspect of neural network learning (Engelbrecht, 2007). To avoid over fitting, the flexibility of a neural network must be reduced. Flexibility comes from the hidden neurons and as the number of hidden neurons increases, the number of network parameters (weights) increases as well. On the other hand, there must be enough neurons to avoid bias or under fitting (Samarasinghe, 2006). There are several techniques to combat the problem of over fitting and tackling the generalization issue. The most popular is cross validation which is a traditional statistical procedure for random partitioning of collected data into a training set and a test set (Palit and Popovic, 2005). Test data is a holdout sample that will never be used in training. Instead, it will be used to halt training to mitigate over fitting. The process of halting neural network training to prevent over fitting and improving the generalization ability is known as early stopping. Sometimes the test data alone may not be sufficient proof of a good generalization ability of a trained neural network. For example, a good performance on the test sample may actually be just a coincidence. To make sure that this is not the case, another set of data known as the validation sample is often used. Just like the test sample, a validation sample is never used for training the neural network. Instead, it is used at the end of training as an extra check on the performance of the model. If the performance of the network was found to be consistently good on both the test and validation samples, then it is reasonable to assume that the network generalizes well on unseen data. There are a number of main steps in the artificial neural network development process as shown in Figure-4 and there are also a number of options available at each step and, while this provides great flexibility in artificial neural network modeling, it also leaves the modeler faced with the difficult task of selecting the most suitable methods. One of the most important steps in using a neural network to solve real world problems is to collect and transform data into a form acceptable to the neural network. In practice, the simplest and linear transformation are most frequently used and obtained by rescaling or by standardization as follows:
(11)
(12)
(13) Where transformed data,
is the untransformed data, ,
is the
are the minimum and
1025
VOL. 8, NO. 12, DECEMBER 2013
ISSN 1819-6608
ARPN Journal of Engineering and Applied Sciences ©2006-2013 Asian Research Publishing Network (ARPN). All rights reserved.
www.arpnjournals.com maximum of untransformed data and , are the mean and standard deviation of untransformed data (Palit and Popovic, 2005).
Figure-4. Main steps in the development of an artificial neural network (Kingston, 2006).
layer. Therefore, this research deals with a developed multilayer perceptron neural network with different activation functions for different nodes in the hidden layer named multilayer perceptron multiactivation function neural network (MLP-MAF). The neural network developed here consists of three layers: input, hidden and output layer as shown in Figure-5. Equal numbers of nodes in the hidden layer have been used for activation functions. A several combinations of the linear, logistic, tangent hyperbolic, exponential, sine and cosine functions in the hidden nodes were investigated. On the other hand, only the linear function was used in the output node. In order to form and train the model, a code has been written using the MATLAB version 7.0 package software named MLP-MAF code. The training of the neural networks is performed with the traditional backward propagation algorithm. The lagged observations of water consumption were used as inputs to the input layer nodes. The results of the developed model were compared with the results of different traditional MLP and RBF neural networks developed using STATISTICA version 8.0 package software. The neurons of the hidden layer are equally divided into groups with a different activation function for each one.
For an explanatory or causal forecasting problem, the inputs to an ANN are usually the independent or predictor variables. The functional relationship estimated by the ANN can be written as: (14) Where
are s independent variables
and is a dependent variable. In this sense, the neural network is functionally equivalent to a nonlinear regression model. On the other hand, for an extrapolative or time series forecasting problem, the inputs are typically the past observations of the data series and the output is the future value. The ANN performs the following function mapping: (15)
Figure-5. Architecture of multilayer perceptronmultiactivation function (MLP-MAF) artificial neural network.Building of MLP-MAF model. Basically, the MLP-MAF model predicts the value of the time series at the time step depending on
Where is the observation at time t. Thus the ANN is equivalent to the nonlinear autoregressive model for time series forecasting problems. It is also easy to incorporate both predictor variables and time lagged observations into one ANN model, which amounts to the general transfer function model (Zhang, et al., 1998).
the past values. The output of the neuron in the output layer of the network can be expressed as follows:
The developed MLP-MAF ANN model Generally, a neural network may have different activation functions for different nodes in the same or different layers. Yet, almost all the networks use the same activation function, particularly for the nodes in the same
is the output, n Where x is the input variable, is the number of neurons in input layer which is equal to the number of input variables, m is the number of neurons in each group in the hidden layer, g is the number of
(16)
1026
VOL. 8, NO. 12, DECEMBER 2013
ISSN 1819-6608
ARPN Journal of Engineering and Applied Sciences ©2006-2013 Asian Research Publishing Network (ARPN). All rights reserved.
www.arpnjournals.com groups, w is the weights of input-hidden and hidden-output layers, b is the bias of hidden and output layers, fp is the activation function of group p in the hidden layer and fo is the activation function of output layer. Following the steps of artificial neural network building, described earlier, the methods adopted here for carrying out each step of the MLP-MAF development processes are summarized below: MLP-MAF network architecture: the input variables in the present study’s case are the past values of water consumption time series used to determine the underlying pattern in the time series and to make forecasts for future values. On the other hand, the output layer includes one node corresponding to the present water consumption value in the output vector. Selection of the
input variables is one of the most important steps in developing a satisfactory forecasting model, because these variables determine the structure of the forecasting model and affect the weighted coefficient and the results of the model. For forecasting urban water consumption, a number of time lagged values were selected as input variables based on the lag correlations between the present value and lagged values in order to determine the best input structure. The lag correlations between the present value of water consumption and the lagged values of Tampa water consumption time series are shown in Table2. The time lags that have been used as inputs to the developed MLP-MAF model for Tampa water consumption data are shown in the mentioned table in bold style.
Table-2. Lag correlations between the present water consumption value and time lagged values for Tampa data.
0
Tampa monthly water consumption (m3) 1.00
Tampa daily water consumption (m3) 1.00
7
Tampa monthly water consumption (m3) 0.01
Tampa daily water consumption (m3) 0.77
1
0.57
0.82
8
-0.09
-
2
0.26
0.68
9
-0.03
-
3
-0.10
0.71
10
0.20
-
4
-0.21
0.69
11
0.34
-
5
-0.08
0.60
12
0.52
-
6
-0.08
0.67
365
-
0.34
Lag
In the developed model, only one hidden layer was used, and the trial-and-error procedure was used to select the optimum number of hidden neurons in the hidden layer based on the best generalizability. For each group in the hidden layer, a number of hidden neurons from one to two-time input variables (2N) have been investigated in order to find the optimal neuron numbers. Activation function: the activation functions, which have been used in the hidden layer of the MLPMAF developed model, include several combinations of functions. For daily and monthly water consumption time series of Tampa, four combinations of the activation functions were used in the hidden layer. These combinations are as below: a) Linear, logistic, tangent hyperbolic, exponential and sine (five groups of neurons). b) Logistic, tangent hyperbolic, exponential and sine (four groups of neurons). c) Tangent hyperbolic, exponential and sine (three groups of neurons). d) Linear, sine and cosine (three groups of neurons).
Lag
the results of different traditional MLP and RBF neural networks produced using STATISTICA version 8.0 package software. Training algorithm: the training of the developed MLP-MAF network is performed with the traditional backward propagation algorithm. The following equation describes the weights adjusting of input-hidden and hidden-output of multilayer perceptronmultiactivation function neural network. The inputs to the hidden layer neurons are: (17)
(18) The output of the hidden neurons:
(19) The inputs to the output layer neurons are:
In all the above models, the linear activation function was used in the output neuron of the output layer. The results of the developed models were compared with
(20)
1027
VOL. 8, NO. 12, DECEMBER 2013
ISSN 1819-6608
ARPN Journal of Engineering and Applied Sciences ©2006-2013 Asian Research Publishing Network (ARPN). All rights reserved.
www.arpnjournals.com The output of the output layer neurons is: (21) Where O is the output vector, I is the input vector, WI is the input-hidden weights, WO is the hiddenoutput weights and are the activation functions of hidden and output layer neurons respectively. The weight updates of hidden-output become: (22) Note that in case of the present research, by using linear function for , the term will be equal
error (RMSE) and mean absolute percentage error (MAPE). The stopping of the training process was based on the performance of testing sample of the estimate subset. MLP-MAF MATLAB code: Because the capability of all available software packages for building neural networks are limited to build neural networks use the same activation function in the same layer, therefore, a MATLAB code has been written using MATLAB version 7.0 package software to build and train the developed multilayer perceptron multiactivation function neural network called MLP-MAF code. Figure-6 illustrates the back propagation algorithm and the main training steps in MLP-MAF MATLAB code.
is the difference between the outputs to 1 and the and targets. The weight updates of input-hidden become:
Start Epoch=1
(23) The term
Initialize the weights and bias
is calculated as below: (24)
In which ηa and ηb are the learning rates for inputhidden and hidden-output weights respectively. Initializing the weights was made randomly in the range (-0.1, +0.1) and choosing the learning rate will be done by trial and error. Data preprocessing: data preprocessing for the developed MLP-MAF model was achieved by normalization using Equation (12). The time series of water consumption were transformed into the range (-1, +1), before the training process began by the model. On the other hand, the traditional models developed using STATISTICA version 8.0 package software for comparison were used a transformed data in the range (0, 1) which is applied by the software automatically before the training process. Training and test sets: as mentioned earlier, the entire available data set was divided into estimate and holdout subsets. The estimate subset was divided into training and test samples randomly to be used in MLPMAF, classic MLP and RBF modeling. The estimating sets of data were divided with 80% of the data allocated to training subset and 20% allocated to the testing subset.
Pattern=1
Calculate the output and the Pattern=Pattern+1
error between the model output and model target
Update weights from the output layer backwards
No Epoch=Epoch+1
All patterns trained? Yes Compute the statistical criteria for model performance evaluation
No
Stopping criteria met? Yes
Stop Performance criteria: the performance of the developed MLP-MAF models for estimate and holdout subsets was evaluated according to statistical criteria described earlier. For stopping the training process of the model for estimate subset, three statistical criteria will be entered to the MATLAB code. These statistical criteria are: coefficient of determination (R2), root mean square
Figure-6. The schema of the back propagation algorithm, outlining the main training steps in MLP-MAF MATLAB code.
1028
VOL. 8, NO. 12, DECEMBER 2013
ISSN 1819-6608
ARPN Journal of Engineering and Applied Sciences ©2006-2013 Asian Research Publishing Network (ARPN). All rights reserved.
www.arpnjournals.com MLP-MAF model application To demonstrate the effectiveness of the proposed MLP-MAF neural network model, it has been applied to two classes of forecasting problems. The first class includes long term forecasting of monthly water consumption time series of Tampa area. The second class of the problem is a short term forecasting of daily water consumption time series of Tampa area. For each class of the problems, the performance of MLP-MAF models have been measured and compared using three criteria: the coefficient of determination (R2), the root mean squared error (RMSE) and the mean absolute percentage error (MAPE). The MLP-MAF results were compared against the best traditional MLP and RBF models. The same exact set of input data is used in all comparisons and the same percentage of data partitioning was used for all models. Monthly water consumption time series As mentioned earlier, the developed MLP-MAF neural network model has been applied to monthly water consumption time series. The input variables to the model are the past values of the time series. To investigate the dependency between past values and present water demand and to determine the lagged values to be used as inputs to the model, lag correlation coefficients between the present monthly demand and past monthly values were calculated and are shown in Table-2. This information was used to aid in selecting input variables for MLP-MAF and traditional MLP and RBF neural networks. This Table shows the strong correlations of present monthly water demand with the lagged values. The lagged values used as inputs to the models are: lags 1, 2, 10, 11 and 12. Four MLP-MAF models with different combinations of activation functions in the hidden layer, as described earlier, were developed for monthly water consumption time series. On the other hand, the STATISTICA version 8.0 package software was used to develop the traditional MLP and RBF neural network models. For comparison purpose with MLP-MAF models twenty five separate traditional MLP models and one RBF model were developed. Different activation functions were used in the hidden and output layer of traditional MLP models, and Gaussian function was used in the hidden layer of RBF model with linear function in the output layer. All developed ANNs were consisting of an input layer, one single hidden layer and one output layer consisting of one node denoting the predicted water demand. All the MLP-MAF and traditional MLP and RBF models used the same input variables (lagged values) and first, trained using the data in the estimate subset to obtain the optimized set of connection strengths and then evaluated using the data in the holdout subset and compared using the statistical measures of goodness of fit that were described earlier. The architecture of the
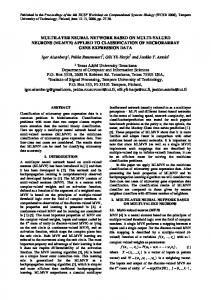
developed models and the performance measures of the results for monthly water consumption time series are shown in Table-3. As seen in this table, the models are evaluated based on their performance in estimate and holdout sets. The models have shown variations in the performance evaluation. Comparing the results of MLP models with RBF model, generally, the performance of MLP models is better than RBF model. The correlations of determination values (R2) for MLP models are higher than that for RBF model and MAPE with RMSE values for MLP models are lower than that for RBF model for both estimate and holdout sets. Comparing the results of MLP models for the estimate set, it is seen that the performance of the models with tangent hyperbolic activation function in the hidden layer is better than other models, while for the holdout set, the results of the models with logistic activation function in the hidden layer, in general, are better than other MLP models. On the other hand, generally, the performance of MLP-MAF models is better than other models for the estimate set. In addition, for the holdout set, the MLPMAF models performances are better than the traditional ANN models. The performance of model M30, which consists of three activation functions (linear, sine, cosine) in the hidden layer, is better than other MLP-MAF models for the holdout set of data. Furthermore, it is seen that the performance of M27 model is close to M28 model. In addition to R2, MAPE and RMSE measurements, the t value was also used to test the hypothesis that MLP-MAF and traditional ANN models forecasts have the same means of the observed values. Comparing the t-test values for MLP-MAF models with critical t values indicate that the hypotheses are not statistically significant. The results of the models demonstrate that MLP-MAF can be applied to forecast urban water consumption. Comparisons of results of four MLP-MAF models for monthly water consumption with the observation data records are shown in Figure-7. An overall conclusion of MLP-MAF and traditional MLP and RBF applied to Tampa monthly water consumption data indicates that none of the methods was performed very well in forecasting monthly urban water demand. This seems to indicate that there were problems with the data used or the wrong deriving input variables were used. The present research focused on the modelling of monthly water demand forecasts using past water consumptions as inputs to the developed models. The models could potentially be improved if other variables such as socioeconomic and climatic that affect water demand were used. Therefore, a further study recommended to be carried out in the future on the same and other data using socioeconomic and climatic variables in addition to past water demands as input variables in the MLP-MAF models.
1029
VOL. 8, NO. 12, DECEMBER 2013
ISSN 1819-6608
ARPN Journal of Engineering and Applied Sciences ©2006-2013 Asian Research Publishing Network (ARPN). All rights reserved.
www.arpnjournals.com Table-3. Structure and statistical performance measurements of MLP-MAF, traditional MLP and RBF models of monthly water consumption time series for Tampa. Output layer activation function/s Linear
R2
MAPE (%)
RMSE
t-value
Fvalue
R2
MAPE (%)
RMSE
tvalue
Fvalue
M1: MLP (5-5-1)
Hidden layer activation function/s Linear
0.422
6.993
1789807
0.400
2.995
0.353
4.728
1078685
0.586
3.623
M2: MLP (5-10-1)
Linear
Logistic
0.467
6.916
1719513
0.199
2.724
0.319
4.814
1088278
0.033
2.695
M3: MLP (5-3-1)
Linear
Tanh
0.440
6.854
1768002
0.478
3.014
0.364
4.649
1064610
0.550
2.845
M4: MLP (5-7-1)
Linear
Exponential
0.443
6.845
1750239
-0.029
2.633
0.380
4.363
1043436
-0.060
3.558
Model
Estimate set (Observed - Fit)
Holdout set (Observed - Forecast)
M5: MLP (5-3-1)
Linear
Sine
0.455
6.671
1741698
0.732
2.555
0.373
4.842
1077116
0.755
2.141
M6: MLP (5-5-1)
Logistic
Linear
0.450
6.930
1746433
-0.185
2.862
0.402
4.231
1020800
-0.220
2.370
M7: MLP (5-3-1)
Logistic
Logistic
0.455
6.896
1732843
0.005
2.624
0.320
4.925
1091549
0.306
2.773
M8: MLP (5-4-1)
Logistic
Tanh
0.452
7.137
1774698
-0.243
3.826
0.351
4.634
1068632
-0.402
3.112
M9: MLP (5-10-1)
Logistic
Exponential
0.437
6.916
1771360
0.168
3.134
0.351
4.655
1070552
0.105
4.254
M10: MLP (5-11-1)
Logistic
Sine
0.457
6.734
1750815
0.630
3.136
0.388
4.440
1038758
0.407
2.671
M11: MLP (5-3-1)
Tanh
Linear
0.433
7.037
1768800
0.174
1.920
0.304
5.320
1165426
1.081
2.221
M12: MLP (5-8-1)
Tanh
Logistic
0.464
7.059
1733740
-0.064
3.087
0.263
5.003
1132521
-0.195
3.553
M13: MLP (5-3-1)
Tanh
Tanh
0.522
6.293
1619946
0.219
1.876
0.304
4.822
1124179
0.511
2.175
M14: MLP (5-3-1)
Tanh
Exponential
0.441
7.846
1902359
-2.073
1.352
0.330
4.860
1104011
-0.730
2.686
M15: MLP (5-3-1)
Tanh
Sine
0.513
6.396
1635276
0.280
1.867
0.347
4.570
1086822
0.571
2.205
M16: MLP (5-6-1)
Exponential
Linear
0.444
6.720
1748322
0.186
1.979
0.383
4.374
1046564
0.485
2.904
M17: MLP (5-12-1)
Exponential
Logistic
0.429
7.402
1855749
-0.120
5.806
0.335
5.200
1164488
-0.809
12.309
M18: MLP (5-5-1)
Exponential
Tanh
0.516
6.546
1631085
0.226
1.820
0.276
5.381
1153103
0.699
2.450
M19: MLP (5-4-1)
Exponential
Exponential
0.457
6.847
1725124
-0.022
2.350
0.326
5.001
1095769
0.477
2.464
M20: MLP (5-4-1)
Exponential
Sine
0.394
6.961
1838387
0.446
1.948
0.366
4.527
1095276
0.650
5.819
M21: MLP (5-5-1)
Sine
Linear
0.422
6.995
1789716
0.394
2.992
0.353
4.727
1078469
0.582
3.622
M22: MLP (5-11-1)
Sine
Logistic
0.452
6.831
1761150
0.437
3.365
0.358
4.601
1062896
0.267
3.621
M23: MLP (5-3-1)
Sine
Tanh
0.435
7.087
1766395
0.010
1.873
0.354
4.983
1111610
0.807
1.802
M24: MLP (5-9-1)
Sine
Exponential
0.452
6.849
1740990
-0.078
2.776
0.370
4.473
1053199
-0.128
3.760
M25: MLP (5-4-1)
Sine
Sine
0.452
6.864
1758973
1.187
2.204
0.347
5.331
1170580
1.413
2.110
M26: RBF (5-12-1)
Gaussian
Linear
0.402
7.188
1811467
0.245
2.306
0.197
5.098
1306811
0.395
1.361
Linear
0.443
7.207
1823100
1.753
1.723
0.389
5.403
1261845
2.120
1.911
Linear
0.450
6.747
1736520
0.187
2.171
0.395
4.347
1032719
0.340
2.170
Linear
0.465
6.967
1742633
-0.746
3.119
0.357
4.460
1112156
-0.838
1.785
Linear
0.520
6.738
1678592
1.590
1.770
0.481
4.389
961969
-0.310
1.627
2.256
1.435
2.317
2.312
M27: MLP-MAF (5-15-1) M28: MLP-MAF (5-12-1) M29: MLP-MAF (5-12-1) M30: MLP-MAF (5-12-1)
Linear, logistic, tanh, exp, sine Logistic, tanh, exp, sine Logistic, tanh, exp Linear, sine, cosine
Critical values of t and F
Critical values of t and F
1030
VOL. 8, NO. 12, DECEMBER 2013
ISSN 1819-6608
ARPN Journal of Engineering and Applied Sciences ©2006-2013 Asian Research Publishing Network (ARPN). All rights reserved.
www.arpnjournals.com
Estimate set (Observed-Fit)
2.80E+07 Water Consumption (m3)
Holdout set (Observed-Forecast)
3.00E+07
2.60E+07 2.40E+07 2.20E+07 2.00E+07 1.80E+07 1.60E+07
Jul-2004
Jul-2003
Jan-2004
Jul-2002
Jan-2003
Jul-2001
Jan-2002
Jul-2000
Jan-2001
Jul-1999
Jan-2000
Jul-1998
Jan-1999
Jul-1997
Jan-1998
Jul-1996
Jan-1997
Jul-1995
Jan-1996
Jul-1994
Jan-1995
Jul-1993
Jan-1994
Jul-1992
Jan-1993
1.20E+07
Jan-1992
1.40E+07
Observed MLP-MAF (M27) MLP-MAF (M28) MLP-MAF (M29) MLP-MAF (M30)
Figure-7. Observed, fit and forecast of MLP-MAF models for monthly water consumption time series of Tampa. Daily water consumption time series The second problem that MLP-MAF and traditional MLP and RBF were applied is short term forecasting of daily water consumption time series. The available daily water consumption time series in Tampa is from 1 January 1992 to 31 December 2004 (4745 observations). February 29 in the leap years has been dropped in order to maintain 365 days in each year. The first 4740, 4735 and 4730 observations from 1 January 1992 were used as a training sample for model estimation, and the remaining 5, 10 and 15 observations as holdout sample for forecast evaluation, respectively. Lag correlation coefficients between the present daily demand and past daily values were calculated as shown in Table-2. This information was used to aid in selecting the lagged values as input variables for the developed MLP-MAF and traditional MLP and RBF neural network models. The lagged (past) values used as inputs to the models are the lags 1 through 7 and lag 365, i.e., the past values of water consumption for seven days ago and the consumption of same day for the previous year were used as inputs. Four MLP-MAF models with different combinations of activation functions in the hidden layer, as described earlier, were developed for daily water consumption time series of Tampa. For comparison purpose, additional forecasts by traditional ANN methods were carried out on the same data. The STATISTICA version 8.0 package software was used to develop twenty five separate traditional MLP models and one RBF model. After applying the models to forecasting daily urban water consumption in the area of Tampa in the USA, the performance of the models were evaluated from the aspect of comparison between the forecasted values and the observed values. The performances of the developed models were evaluated by computing R2, MAPE and RMSE statistics to estimate set and 5, 10 and 15 days forecasts ahead set. Tables (4) through (6) give the forecasts results for the in-sample (estimate set) and outsample (holdout set) periods of 5, 10 and 15 days forecasts.
It can be observed that the traditional MLP models performed best than RBF model for the estimate and holdout sets for forecasting 5, 10 and 15 days ahead, with the highest R2 values of 0.777, 0.769 and 0.685 for models M12, M7 and M21 respectively, and lowest MAPE and MRSE statistics. Comparing traditional MLP models with the developed MLP-MAF models, it is clear that for forecasting 5 days ahead for estimate set there is no significant difference between them. For forecasting 10 and 15 days ahead, the developed MLP-MAF models are better than traditional MLP model with highest R2 values of 0.775 and 0.758 and lowest MAPE and MRSE values for models M28 and M30 respectively. On the other hand, the statistical analysis on the results of traditional ANN and developed MLP-MAF of 5, 10 and 15 days forecasting ahead models for holdout sets reveals that the MLP-MAF models perform better than traditional MLP and RBF models. Among the four MLP-MAF models developed for each forecasting 5, 10, 15 days ahead, the model M30 which consists of linear, sine and cosine activation functions in the hidden layer and linear activation function in the output layer appears to be the best one with highest R2 values of 0.814, 0.556, 0.411, lowest MAPE values of 2.224%, 4.301%, 3.698% and lowest RMSE values of 15868, 32479, 31571, respectively. Furthermore, the models M27 and M28 of MLP-MAF appear to have the same forecast performance and be very close to each other for all the daily forecasting (5, 10, 15 days ahead) models. Moreover, it is seen from ttest that there is no difference between the means of the observed and forecasted values of estimate and holdout sets. The accuracy of the models is particularly better for short term forecasting 5 days ahead than 10 days ahead and forecasting 10 days ahead is better than 15 days ahead and this is convenient, because by increasing the forecasting periods ahead the accuracy will decrease. Figures 8 through 10 show the observed and forecasted series of estimate and holdout sets of the four developed
1031
VOL. 8, NO. 12, DECEMBER 2013
ISSN 1819-6608
ARPN Journal of Engineering and Applied Sciences ©2006-2013 Asian Research Publishing Network (ARPN). All rights reserved.
www.arpnjournals.com MLP-MAF models for forecasting 5, 10 and 15 days ahead. As mentioned earlier in monthly water demand forecasting, none of traditional MLP and RBF and MLPMAF models applied to Tampa daily water consumption time series none of the methods performed very well in forecasting short term urban water demand. This seems to indicate that there were problems with the data used or data pre-processing or the wrong deriving input variables were used. The present models of daily water demand
forecasts are nonlinear autoregressive models for time series forecasting by using past water consumptions as inputs to the developed ANN models. The models could potentially be improved if other variables such as socioeconomic and climatic that affect water demand were used. Therefore, a further study recommended to be carried out in the future on the daily water consumption by incorporating both climatic variables and time lagged observations in the input variables of the model.
Table-4. Structure and statistical performance measurements of MLP-MAF, traditional MLP and RBF models of daily water consumption time series for Tampa - forecasting 5 days ahead.
M1: MLP (8-9-1)
Linear
Output layer activation function/s Linear
0.677
4.037
33441
-0.406
1.381
0.614
2.970
19290
0.466
1.238
M2: MLP (8-2-1)
Linear
Logistic
0.741
3.713
29896
-0.173
1.348
0.779
3.485
23576
0.603
2.294
Model
Hidden layer activation function/s
Estimate set (Observed - Fit)
Holdout set (Observed - Forecast)
R2
MAPE (%)
RMSE
t-value
Fvalue
R2
MAPE (%)
RMSE
tvalue
Fvalue
M3: MLP (8-7-1)
Linear
Tanh
0.724
3.789
30986
-0.557
1.447
0.789
3.248
22995
0.679
2.083
M4: MLP (8-10-1)
Linear
Exponential
0.728
3.824
30698
-0.286
1.444
0.810
2.413
18352
0.689
1.407
M5: MLP (8-16-1)
Linear
Sine
0.745
3.681
29742
-0.017
1.250
0.775
3.444
24502
0.751
2.114
M6: MLP (8-11-1)
Logistic
Linear
0.751
3.642
29320
-0.297
1.290
0.643
2.831
22054
0.804
1.214
M7: MLP (8-9-1)
Logistic
Logistic
0.772
3.515
28210
-0.632
1.229
0.653
3.605
23344
0.445
2.081
M8: MLP (8-2-1)
Logistic
Tanh
0.764
3.564
28591
-0.219
1.222
0.578
3.483
24652
0.713
1.596
M9: MLP (8-4-1)
Logistic
Exponential
0.763
3.557
28625
-0.251
1.249
0.758
2.879
20856
0.801
1.387
M10: MLP (8-3-1)
Logistic
Sine
0.752
3.637
29324
-0.282
1.252
0.644
2.848
22727
0.843
1.248
M11: MLP (8-2-1)
Tanh
Linear
0.742
3.698
29863
-0.041
1.282
0.802
3.527
24222
0.595
2.485
M12: MLP (8-7-1)
Tanh
Logistic
0.777
3.478
27847
-0.294
1.195
0.559
4.120
28158
1.013
1.502
M13: MLP (8-2-1)
Tanh
Tanh
0.761
3.581
28880
-0.330
1.179
0.594
3.415
23924
0.636
1.667
M14: MLP (8-2-1)
Tanh
Exponential
0.756
3.647
29129
-0.492
1.263
0.780
2.766
19573
0.642
1.602
M15: MLP (8-13-1)
Tanh
Sine
0.745
3.683
29793
-0.647
1.354
0.780
2.926
19423
0.489
1.865
M16: MLP (8-11-1)
Exponential
Linear
0.749
3.644
29451
0.109
1.381
0.812
2.957
20898
0.661
1.876
M17: MLP (8-5-1)
Exponential
Logistic
0.765
3.573
28594
-0.150
1.178
0.615
3.429
24267
0.866
1.363
M18: MLP (8-13-1)
Exponential
Tanh
0.742
3.693
29924
-0.440
1.419
0.798
3.099
21432
0.610
2.015
M19: MLP (8-6-1)
Exponential
Exponential
0.767
3.519
28403
-0.318
1.257
0.637
3.351
21562
0.768
1.185
M20: MLP (8-17-1)
Exponential
Sine
0.748
3.672
29575
-0.475
1.328
0.785
2.956
19724
0.540
1.843
M21: MLP (8-6-1)
Sine
Linear
0.746
3.684
29699
-0.547
1.347
0.758
2.882
20287
0.649
1.623
M22: MLP (8-9-1)
Sine
Logistic
0.733
3.739
30481
-0.251
1.503
0.753
3.378
24120
0.696
2.104
M23: MLP (8-13-1)
Sine
Tanh
0.725
3.757
30833
0.468
1.395
0.784
3.585
25928
0.734
2.395
M24: MLP (8-2-1)
Sine
Exponential
0.726
3.871
30861
-0.333
1.513
0.812
2.604
18825
0.606
1.671
M25: MLP (8-7-1)
Sine
Sine
0.746
3.675
29683
-0.390
1.389
0.765
2.915
20418
0.640
1.685
M26: RBF (8-17-1) M27: MLP-MAF (8-20-1) M28: MLP-MAF (8-16-1) M29: MLP-MAF (8-12-1) M30: MLP-MAF (8-12-1)
Gaussian Linear, logistic, Tanh, Exp, Sine Logistic, Tanh, Exp, Sine Logistic, tanh, exp Linear, Sine, Cosine
Linear
0.665
4.221
34092
0.574
1.454
0.772
3.264
22083
0.983
1.200
Linear
0.770
3.519
28243
0.196
1.377
0.625
3.293
23004
0.671
1.565
Linear
0.756
3.614
29085
0.239
1.401
0.729
2.987
21972
0.772
1.541
Linear
0.756
3.612
29071
0.190
1.438
0.803
2.809
19341
0.597
1.738
Linear
0.758
3.590
29046
-0.634
1.371
0.814
2.224
15868
0.542
1.316
Critical values of t and F
2.242
1.061
Critical values of t and F
2.752
9.605
1032
VOL. 8, NO. 12, DECEMBER 2013
ISSN 1819-6608
ARPN Journal of Engineering and Applied Sciences ©2006-2013 Asian Research Publishing Network (ARPN). All rights reserved.
www.arpnjournals.com Table-5. Structure and statistical performance measurements of MLP-MAF, traditional MLP and RBF models of daily water consumption time series for Tampa - forecasting 10 days ahead. Hidden layer activation function/s
Output layer activation function/s
M1: MLP (8-4-1)
Linear
Linear
M2: MLP (8-12-1)
Linear
M3: MLP (8-4-1)
Model
Estimate set (Observed - Fit) MAPE (%)
RMSE
0.753
3.636
Logistic
0.750
Linear
Tanh
0.735
M4: MLP (8-4-1)
Linear
Exponential
0.733
3.778
30569
0.907
M5: MLP (8-4-1)
Linear
Sine
0.751
3.646
29434
0.744
M6: MLP (8-4-1)
Logistic
Linear
0.769
3.539
28205
0.407
M7: MLP (8-16-1)
Logistic
Logistic
0.769
3.555
28228
M8: MLP (8-6-1)
Logistic
Tanh
0.769
3.574
M9: MLP (8-16-1)
Logistic
Exponential
0.780
M10: MLP (8-8-1)
Logistic
Sine
M11: MLP (8-9-1)
Tanh
M12: MLP (8-12-1)
Holdout set (Observed - Forecast) MAPE (%)
RMSE
0.370
4.812
39098
1.315
0.377
4.952
39150
1.624
0.368
4.948
39438
1.306
0.395
4.766
37431
1.408
0.396
4.794
38204
1.308
0.393
4.509
38732
0.468
1.318
0.369
4.893
39862
28247
0.552
1.313
0.343
4.895
40186
3.470
27509
0.377
1.297
0.379
4.795
39315
0.768
3.551
28284
0.363
1.280
0.360
4.769
39889
Linear
0.757
3.613
28987
0.508
1.360
0.383
4.621
38785
Tanh
Logistic
0.766
3.593
28450
0.550
1.310
0.361
4.821
39614
M13: MLP (8-8-1)
Tanh
Tanh
0.771
3.542
28084
0.380
1.339
0.341
4.967
40301
M14: MLP (8-4-1)
Tanh
Exponential
0.777
3.491
27711
0.351
1.262
0.371
4.934
39522
M15: MLP (8-9-1)
Tanh
Sine
0.769
3.545
28175
0.261
1.284
0.360
4.809
39901
M16: MLP (8-7-1)
Exponential
Linear
0.765
3.563
28498
0.500
1.299
0.384
4.593
38754
M17: MLP (8-10-1)
Exponential
Logistic
0.759
3.615
28861
0.443
1.329
0.368
4.802
39216
M18: MLP (8-11-1)
Exponential
Tanh
0.767
3.561
28318
0.336
1.303
0.372
4.529
39317
M19: MLP (8-12-1)
Exponential
Exponential
0.768
3.551
28312
0.423
1.291
0.371
4.825
39462
M20: MLP (8-10-1)
Exponential
Sine
0.768
3.538
28261
0.315
1.283
0.381
4.663
38917
M21: MLP (8-6-1)
Sine
Linear
0.750
3.655
29368
0.482
1.369
0.383
4.645
38686
M22: MLP (8-4-1)
Sine
Logistic
0.747
3.637
29508
0.267
1.275
0.386
5.027
38912
M23: MLP (8-9-1)
Sine
Tanh
0.733
3.697
30517
0.620
1.514
0.407
4.597
38441
M24: MLP (8-12-1)
Sine
Exponential
0.722
3.831
31111
0.527
1.256
0.415
4.697
37019
M25: MLP (8-13-1) M26: RBF (8-3-1) M27: MLP-MAF (8-20-1) M28: MLP-MAF (8-16-1) M29: MLP-MAF (8-12-1) M30: MLP-MAF (8-12-1)
R
2
t-value
Fvalue
R
29169
0.307
1.367
3.647
29376
0.391
3.737
30525
0.397
2
Sine
Sine
0.751
3.640
29458
0.671
1.432
0.398
4.664
37811
Gaussian Linear, Logistic, Tanh, Exp, Sine Logistic, Tanh, Exp, Sine Logistic, Tanh, Exp Linear, Sine, Cosine
Linear
0.632
4.425
35628
0.550
1.560
0.125
6.047
45107
Linear
0.772
3.519
28084
0.462
1.312
0.384
4.629
38864
Linear
0.775
3.492
27893
0.490
1.280
0.383
4.608
38825
Linear
0.753
3.636
29169
0.307
1.367
0.370
4.812
39098
Linear
0.744
3.795
29699
-0.042
1.252
0.556
4.301
32479
2.242
1.061
Critical values of t and F
Critical values of t and F
1033
tvalue 0.134 0.128 0.184 0.019 0.071 0.153 0.173 0.082 0.224 0.142 0.133 0.130 0.133 0.137 0.193 0.076 0.169 0.135 0.111 0.151 0.068 0.159 0.178 0.108 0.093 0.010 0.126 0.079 0.134 0.253 2.445
Fvalue 1.689 1.551 1.606 2.526 1.620 1.502 1.451 1.631 1.532 1.534 1.611 1.610 1.637 1.507 1.562 1.579 1.684 1.570 1.526 1.589 1.613 1.536 1.437 1.966 1.798 5.994 1.558 1.565 1.689 1.786 4.026
VOL. 8, NO. 12, DECEMBER 2013
ISSN 1819-6608
ARPN Journal of Engineering and Applied Sciences ©2006-2013 Asian Research Publishing Network (ARPN). All rights reserved.
www.arpnjournals.com Table-6. Structure and statistical performance measurements of MLP-MAF, traditional MLP and RBF models of daily water consumption time series for Tampa - forecasting 15 days ahead. Hidden layer activation function/s
Output layer activation function/s
M1: MLP (8-5-1)
Linear
M2: MLP (8-4-1)
Model
Estimate set (Observed - Fit)
Holdout set (Observed - Forecast)
R
MAPE (%)
RMSE
Linear
0.673
4.135
Linear
Logistic
0.671
M3: MLP (8-4-1)
Linear
Tanh
0.671
M4: MLP (8-6-1)
Linear
Exponential
0.658
4.456
35786
0.988
2.275
0.293
4.133
34966
M5: MLP (8-4-1)
Linear
Sine
0.672
4.140
33898
-0.464
1.397
0.305
4.102
34438
M6: MLP (8-12-1)
Logistic
Linear
0.680
4.048
33428
-0.303
1.414
0.327
4.076
33708
M7: MLP (8-6-1)
Logistic
Logistic
0.670
4.184
34163
-0.799
1.332
0.301
4.224
35220
M8: MLP (8-7-1)
Logistic
Tanh
0.674
4.148
33992
-0.667
1.301
0.307
4.160
34801
M9: MLP (8-9-1)
Logistic
Exponential
0.680
4.068
33427
-0.180
1.372
0.318
4.098
33992
M10: MLP (8-11-1)
Logistic
Sine
0.669
4.159
34221
-0.669
1.325
0.315
4.112
34478
M11: MLP (8-8-1)
Tanh
Linear
0.672
4.127
34000
-0.598
1.334
0.314
4.112
34377
M12: MLP (8-7-1)
Tanh
Logistic
0.677
4.114
33792
-0.604
1.305
0.303
4.175
34806
M13: MLP (8-5-1)
Tanh
Tanh
0.674
4.135
33840
-0.647
1.419
0.320
4.037
34259
M14: MLP (8-9-1)
Tanh
Exponential
0.673
4.145
34096
-0.785
1.301
0.310
4.162
34978
M15: MLP (8-7-1)
Tanh
Sine
0.676
4.114
33818
-0.681
1.332
0.310
4.142
34654
M16: MLP (8-9-1)
Exponential
Linear
0.679
4.063
33533
-0.446
1.401
0.314
4.090
34029
M17: MLP (8-13-1)
Exponential
Logistic
0.673
4.126
34018
-0.593
1.300
0.315
4.133
34331
M18: MLP (8-10-1)
Exponential
Tanh
0.675
4.086
33768
-0.242
1.326
0.309
4.135
34068
M19: MLP (8-7-1)
Exponential
Exponential
0.678
4.072
33696
-0.512
1.318
0.319
4.120
34084
M20: MLP (8-6-1)
Exponential
Sine
0.678
4.068
33584
-0.546
1.426
0.327
4.056
33855
M21: MLP (8-6-1)
Sine
Linear
0.685
4.038
33160
-0.169
1.356
0.317
4.107
33885
M22: MLP (8-9-1)
Sine
Logistic
0.682
4.160
33662
0.718
1.742
0.312
4.057
33874
2
t-value
Fvalue
R
MAPE (%)
RMSE
33886
-0.464
1.375
0.305
4.110
34427
4.152
33920
0.331
1.398
0.297
4.120
34084
4.164
34047
-0.693
1.355
0.312
4.120
34747
2
M23: MLP (8-5-1)
Sine
Tanh
0.671
4.191
34193
-1.100
1.406
0.308
4.104
35233
M24: MLP (8-11-1)
Sine
Exponential
0.664
4.413
35460
0.750
2.259
0.295
4.056
34863
M25: MLP (8-7-1)
Sine
Sine
0.680
4.085
33498
-0.480
1.390
0.312
4.095
34248
M26: RBF (8-13-1)
Gaussian
Linear
0.677
4.181
34358
-0.855
1.153
0.267
4.336
35454
Linear
0.674
4.099
33830
-0.395
1.339
0.314
4.114
34138
Linear
0.675
4.096
33811
-0.430
1.337
0.315
4.113
34139
Linear
0.674
4.166
34358
-0.901
1.194
0.307
4.224
35172
Linear
0.758
3.612
29029
-0.034
1.294
0.411
3.698
31571
2.242
1.061
M27: MLP-MAF (8-20-1) M28: MLP-MAF (8-16-1) M29: MLP-MAF (8-12-1) M30: MLP-MAF (8-12-1)
Linear, Logistic, Tanh, Exp, Sine Logistic, Tanh, Exp, Sine Logistic, Tanh, Exp Linear, Sine, Cosine
Critical values of t and F
Critical values of t and F
tvalue 0.511 0.069 0.684 0.101 0.518 0.373 0.689 0.628 0.435 0.583 0.554 0.598 0.581 0.698 0.615 0.415 0.523 0.356 0.457 0.448 0.389 0.007 0.801 0.040 0.508 0.462 0.457 0.468 0.705 0.247 2.368
1034
Fvalue 3.278 4.008 2.900 7.964 3.347 2.509 2.509 2.650 2.818 2.615 2.790 2.675 2.933 2.571 2.734 2.858 2.582 2.812 2.536 2.558 2.991 4.658 2.999 7.696 3.179 2.672 2.772 2.738 2.410 1.842 2.979
VOL. 8, NO. 12, DECEMBER 2013
ISSN 1819-6608
ARPN Journal of Engineering and Applied Sciences ©2006-2013 Asian Research Publishing Network (ARPN). All rights reserved.
www.arpnjournals.com
Water Consumption (m3)
6.80E+05
Holdout set (Observed-Forecast)
7.00E+05 Estimate set (Observed-Fit)
6.60E+05 6.40E+05 6.20E+05 6.00E+05 5.80E+05 5.60E+05 5.40E+05
5.00E+05
1-Dec-04 2-Dec-04 3-Dec-04 4-Dec-04 5-Dec-04 6-Dec-04 7-Dec-04 8-Dec-04 9-Dec-04 10-Dec-04 11-Dec-04 12-Dec-04 13-Dec-04 14-Dec-04 15-Dec-04 16-Dec-04 17-Dec-04 18-Dec-04 19-Dec-04 20-Dec-04 21-Dec-04 22-Dec-04 23-Dec-04 24-Dec-04 25-Dec-04 26-Dec-04 27-Dec-04 28-Dec-04 29-Dec-04 30-Dec-04 31-Dec-04
5.20E+05
Observed MLP-MAF (M27) MLP-MAF (M28) MLP-MAF (M29) MLP-MAF (M30)
Figure-8. Observed, fit and forecast (5 days ahead) of MLP-MAF models for daily water consumption time series of Tampa. 7.00E+05 Estimate set (Observed-Fit)
Holdout set (Observed-Forecast)
6.60E+05 6.40E+05 6.20E+05 6.00E+05 5.80E+05 5.60E+05 5.40E+05 5.20E+05 5.00E+05
1-Dec-04 2-Dec-04 3-Dec-04 4-Dec-04 5-Dec-04 6-Dec-04 7-Dec-04 8-Dec-04 9-Dec-04 10-Dec-04 11-Dec-04 12-Dec-04 13-Dec-04 14-Dec-04 15-Dec-04 16-Dec-04 17-Dec-04 18-Dec-04 19-Dec-04 20-Dec-04 21-Dec-04 22-Dec-04 23-Dec-04 24-Dec-04 25-Dec-04 26-Dec-04 27-Dec-04 28-Dec-04 29-Dec-04 30-Dec-04 31-Dec-04
Water Consumption (m3)
6.80E+05
Observed MLP-MAF (M27) MLP-MAF (M28) MLP-MAF (M29) MLP-MAF (M30)
Figure-9. Observed, fit and forecast (10 days ahead) of MLP-MAF models for daily water consumption time series of Tampa.
1035
VOL. 8, NO. 12, DECEMBER 2013
ISSN 1819-6608
ARPN Journal of Engineering and Applied Sciences ©2006-2013 Asian Research Publishing Network (ARPN). All rights reserved.
www.arpnjournals.com 7.00E+05
Water Consumption (m3)
6.80E+05
Holdout set (Observed-Forecast)
Estimate set (Observed-Fit)
6.60E+05 6.40E+05 6.20E+05 6.00E+05 5.80E+05 5.60E+05 5.40E+05
5.00E+05
1-Dec-04 2-Dec-04 3-Dec-04 4-Dec-04 5-Dec-04 6-Dec-04 7-Dec-04 8-Dec-04 9-Dec-04 10-Dec-04 11-Dec-04 12-Dec-04 13-Dec-04 14-Dec-04 15-Dec-04 16-Dec-04 17-Dec-04 18-Dec-04 19-Dec-04 20-Dec-04 21-Dec-04 22-Dec-04 23-Dec-04 24-Dec-04 25-Dec-04 26-Dec-04 27-Dec-04 28-Dec-04 29-Dec-04 30-Dec-04 31-Dec-04
5.20E+05
Observed MLP-MAF (M27) MLP-MAF (M28) MLP-MAF (M29) MLP-MAF (M30)
Figure-10. Observed, fit and forecast (15 days ahead) of MLP-MAF models for daily water consumption time series of Tampa. CONCLUSIONS The model developed in this research for daily and monthly municipal water demand forecasting is a Multilayer Perceptron - Multiactivation Function (MLPMAF) neural network that contains different activation functions in the nodes of the hidden layer. Even though the developed MLP-MAF time series models for water consumption time series of Tampa had not performed well, the models are better than traditional MLP and RBF neural network models in terms of statistical measurements, R2, MAPE and RMSE. Among the different activation functions in the hidden layer of MLPMAF, the combination of linear, sine and cosine functions is performing better than other combinations for daily and monthly water consumption time series of Tampa. Comparing the results of the traditional MLP and RBF neural network models for both daily and monthly water demand forecasting indicates that the forecasting accuracy of traditional MLP model is more accurate than the traditional RBF model. Appendix-I: Notations Symbol b
fh(.) fk fo(.) fp
Description The bias to the neuron in a layer of neural network The classical F statistic The activation function of hidden layer in neural network The activation function of neuron in a layer of neural network The activation function of output layer The activation function of group p in the hidden layer of MLP-MAF
g HIN I N
O
, t tc
w WI WO x
The number of neuron groups in the hidden layer of MLP-MAF The inputs to the hidden layer of MLP-MAF The inputs to the input layer of MLP-MAF The number of data points The number of neurons in a neural network The outputs of the output layer of MLP-MAF The standard deviation The variance of observed and forecasted data, respectively The time (day, month) The critical t-statistic at a significance level The classical t-statistic The weight between the layers of MLP network The input-hidden layers weights of MLP-MAF The hidden-output layers weights of MLP-MAF The independent variable The mean of time series The linear regression value for annual means The maximum value of series x The mean value of series x The minimum value of series x
1036
VOL. 8, NO. 12, DECEMBER 2013
ISSN 1819-6608
ARPN Journal of Engineering and Applied Sciences ©2006-2013 Asian Research Publishing Network (ARPN). All rights reserved.
www.arpnjournals.com The scaled value of variable xi The standard deviation of series x y yk
yt , ,
µ ηa ηb
The dependent variable The output of neuron k in a layer of neural network Output of a neural network model The observation at time t The forecasted data with its mean for observed data The observed data with its mean, respectively The random error The parameters in the Gaussian function The learning rate for input-hidden weights of MLP-MAF The learning rate for hidden-output weights of MLP-MAF The standard deviations in the Gaussian function
Appendix-II: Abbreviations Abbreviation
Description
ANN
Artificial neural network
CE
FFBP
Coefficient of efficiency Dynamic artificial neural network model Feed forward back propagation
MAE
Mean absolute error
MAPE
Mean absolute percentage error
MLP
Multilayer perceptron
MSE
Mean squared error
DAN2
R
2
Coefficient of determination
RBF
Radial basis function
RMSE
Root mean squared error
SSE
Sum of square error
SVM
Support vector machines
USA
The United State of America Multilayer perceptron multiactivation function neural network
MLP-MAF REFERENCES
Abraham A. 2005. Artificial Neural Networks. In: Handbook of Measuring System Design. s.l.: John Wiley and Sons, Ltd. pp. 901-908.
Adamowski J. F. 2008. Peak Daily Water Demand Forecast Modelling Using Artificial Neural Networks. Journal of Water Resources Planning and Management. 134(2): 119-128. Alaa H. A. and Nisai W. 2004. Short Term Forecasting for Urban Water Consumption. Journal of Water Resources Planning and Management, 1 September. 130(5): 405-410. Asefa T. and Adams A. 2007. Short Term Urban Water Demand Forecast Models in Action: Challenges from Model Development to Implementation to Real Time Operations. Tampa, Florida, ASCE. Bougadis J., Adamowski K. and Diduch R. 2005. Short Term Municipal Water Demand Forecasting. Journal of Hydrological Processes, January. 19(1): 137-148. Chang N. and Makkeasorn A. 2006. Water Demand Analysis in Urban Region by Neural Network Models. Cincinnati, Ohio, USA, ASCE. Dreyfus G. 2005. Neural Networks: Methodology and Applications. 2nd Ed. s.l.:Springer-Verlag Berlin Heidelberg. Engelbrecht A. P. 2007. Computational Intelligence: An Introduction. 2nd Ed. The Atrium, Southern Gate, Chichester, West Sussex PO19 8SQ: John Wiley and Sons Ltd. Firat M. and Gungor M. 2007. River Flow Estimation Using Feed Forward and Radial Basis Neural Networks Approaches. Antalya, Turkey, INPIM. pp. 599-611. Firat M., Yurdusev M. A. and Turan M. E. 2009. Evaluation of Artificial Neural Network Techniques for Municipal Water Consumption Modelling. Journal of Water Resources Management. 23(4): 617-632. Ghiassi M., Zimbra D. K. and Saidane H. 2008. Urban Water Demand Forecasting with a Dynamic Artificial Neural Network Model. Journal of Water Resources Planning and Management. 134(2): 138-146. Hill T. and Lewicki P. 2007. Statistics Methods and Applications. Tulsa, OK: StatSoft, Inc. Jain D. A., Varshney A. K. and Joshi U. C. 2001. Short Term Water Demand Forecasting at IIT Kanpur Using Artificial Neural Networks. Journal of Water Resources Management. 15(5): 299-321. Kim J. H., Hwang S. H. and Shin H. S. 2001. A NeuroGenetic Approach for Daily Water Demand Forecasting. KSCE. Journal of Civil Engineering, September. 5(3): 281-288. Kingston G. B. 2006. Ph.D Thesis. Adelaide: Computer and Mathematical Sciences, Faculty of Engineering,
1037
VOL. 8, NO. 12, DECEMBER 2013
ISSN 1819-6608
ARPN Journal of Engineering and Applied Sciences ©2006-2013 Asian Research Publishing Network (ARPN). All rights reserved.
www.arpnjournals.com School of Civil and Environmental Engineering, The University of Adelaide, Australia. Leon F. and Zaharia M. h. 2010. Stacked Heterogeneous Neural Network for Time Series Forecasting. Mathematical Problems in Engineering. pp. 1-21. Makridakis S., Wheelwright S. C. and Hyndman R. J. 1998. Forecasting, Methods and Applications. 3rd Ed. New York: John Wiley and Sons, Inc. Msiza I. S., Nelwamondo F. V. and Marwala T. 2007. Artificial Neural Networks and Support Vector Machines for Water Demand Time Series Forecasting. Montreal, Quebec, Canada, IEEE. pp. 638-643. Msiza I. S., Nelwamondo F. V. and Marwala T. 2007. Water Demand Forecasting Using Multi-Layer Perceptron and Radial Basis Functions. Orlando, Florida, USA, IEEE. pp. 13-18. Palit A. K. and Popovic D. 2005. Computational Intelligence in Time Series Forecasting. Theory and Engineering Applications. London: Springer-Verlag London Limited. Rumantir G. W. 1995. M.Sc Thesis. Melbourne: Department of Computer Science. Royal Melbourne Institute of Technology. Samarasinghe S. 2006. Nueral Networks for Applied Sciences and Engineering: From Fundamentals to Complex Pattern Recognition. New York: Taylor and Francis Group, LLC. Taylor J. G. 1996. Neural Networks and Their Applications. Baffins Lane, Chichester, West Sussex PO19 1UD: John Wiley and Sons, Ltd. Zhang G., Patuwo B. E. and Hu M. Y. 1998. Forecasting With Aartificial Neural Networks: The State of the Art. International Journal of Forecasting. (14): 35-62. Zhang G. P., Patuwo B. E. and Hu M. Y. 2001. A Simulation Study of Artificial Neural Networks for Nonlinear Time Series Forecasting. Journal of Computers and Operations Research, April. 28(4): 381-396. Zhang J., Song R., Bhaskar N. R. and French M. N. 2006. Short Term Water Demand Forecasting: A Case Study. Cincinnati, Ohio, USA, ASCE. Zhang J., Song R., Bhaskar N. R. and French M. N. 2007. Ensemble Forecasting of Daily Water Demand. Tampa, Florida, ASCE.
1038